Oscilloscopio Tektronix type 515A matr. 005869 1ª parte

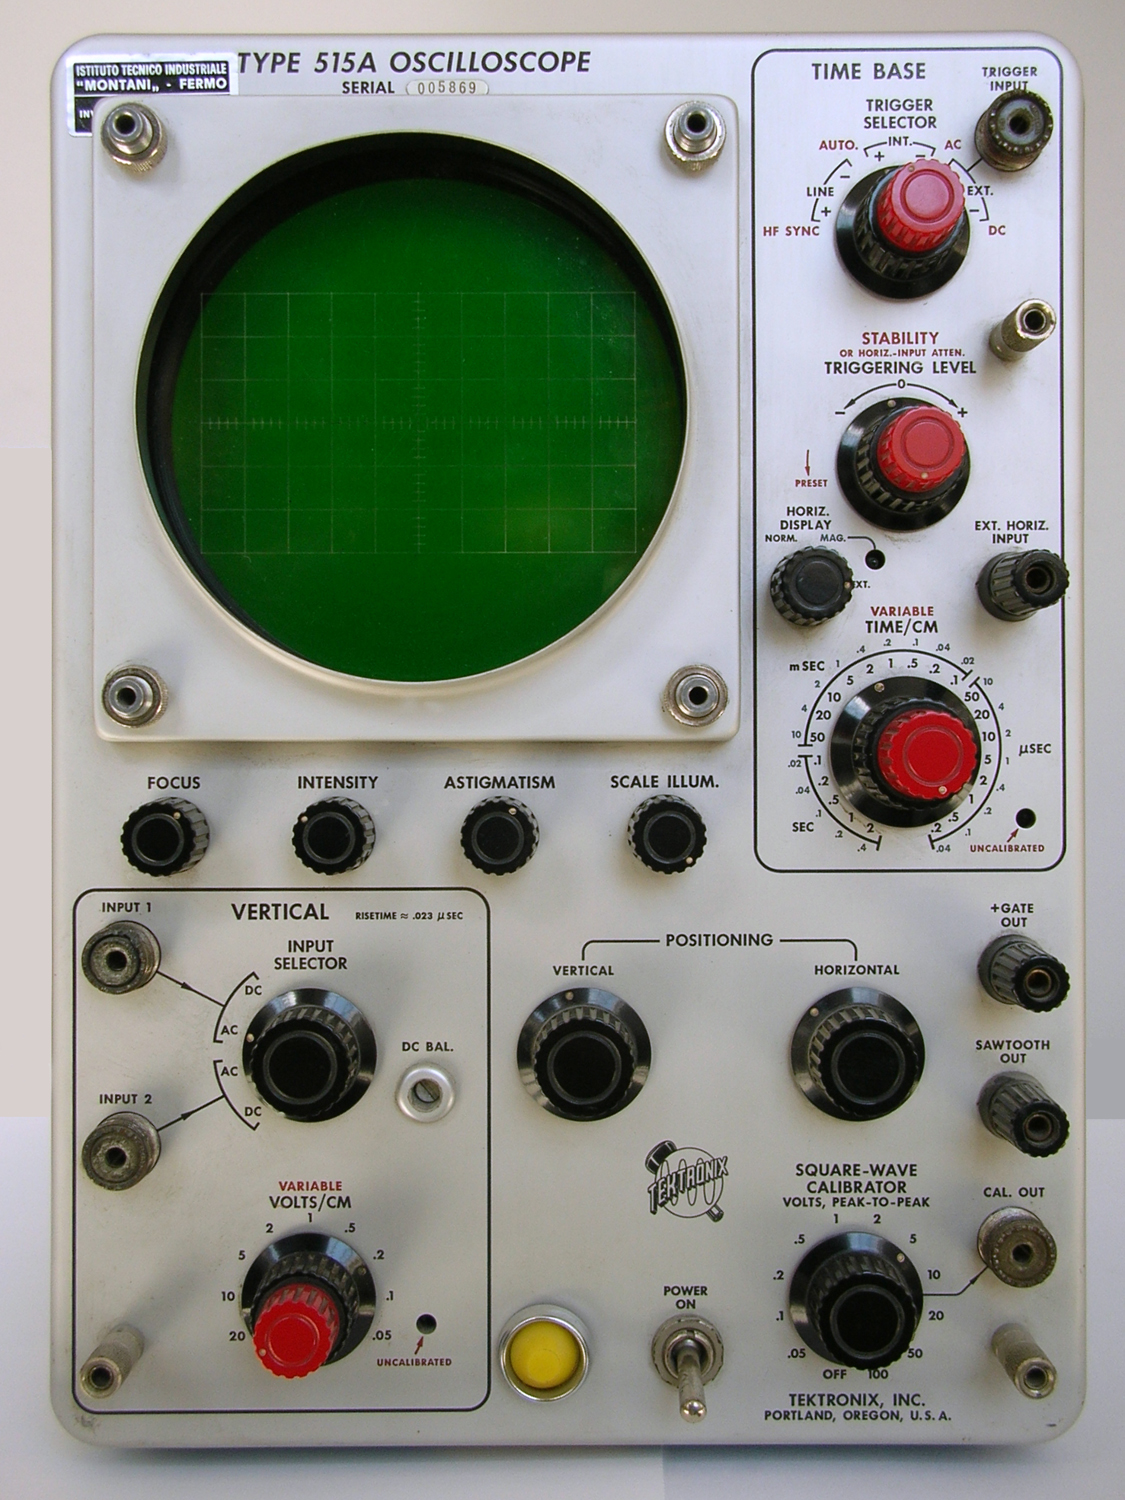
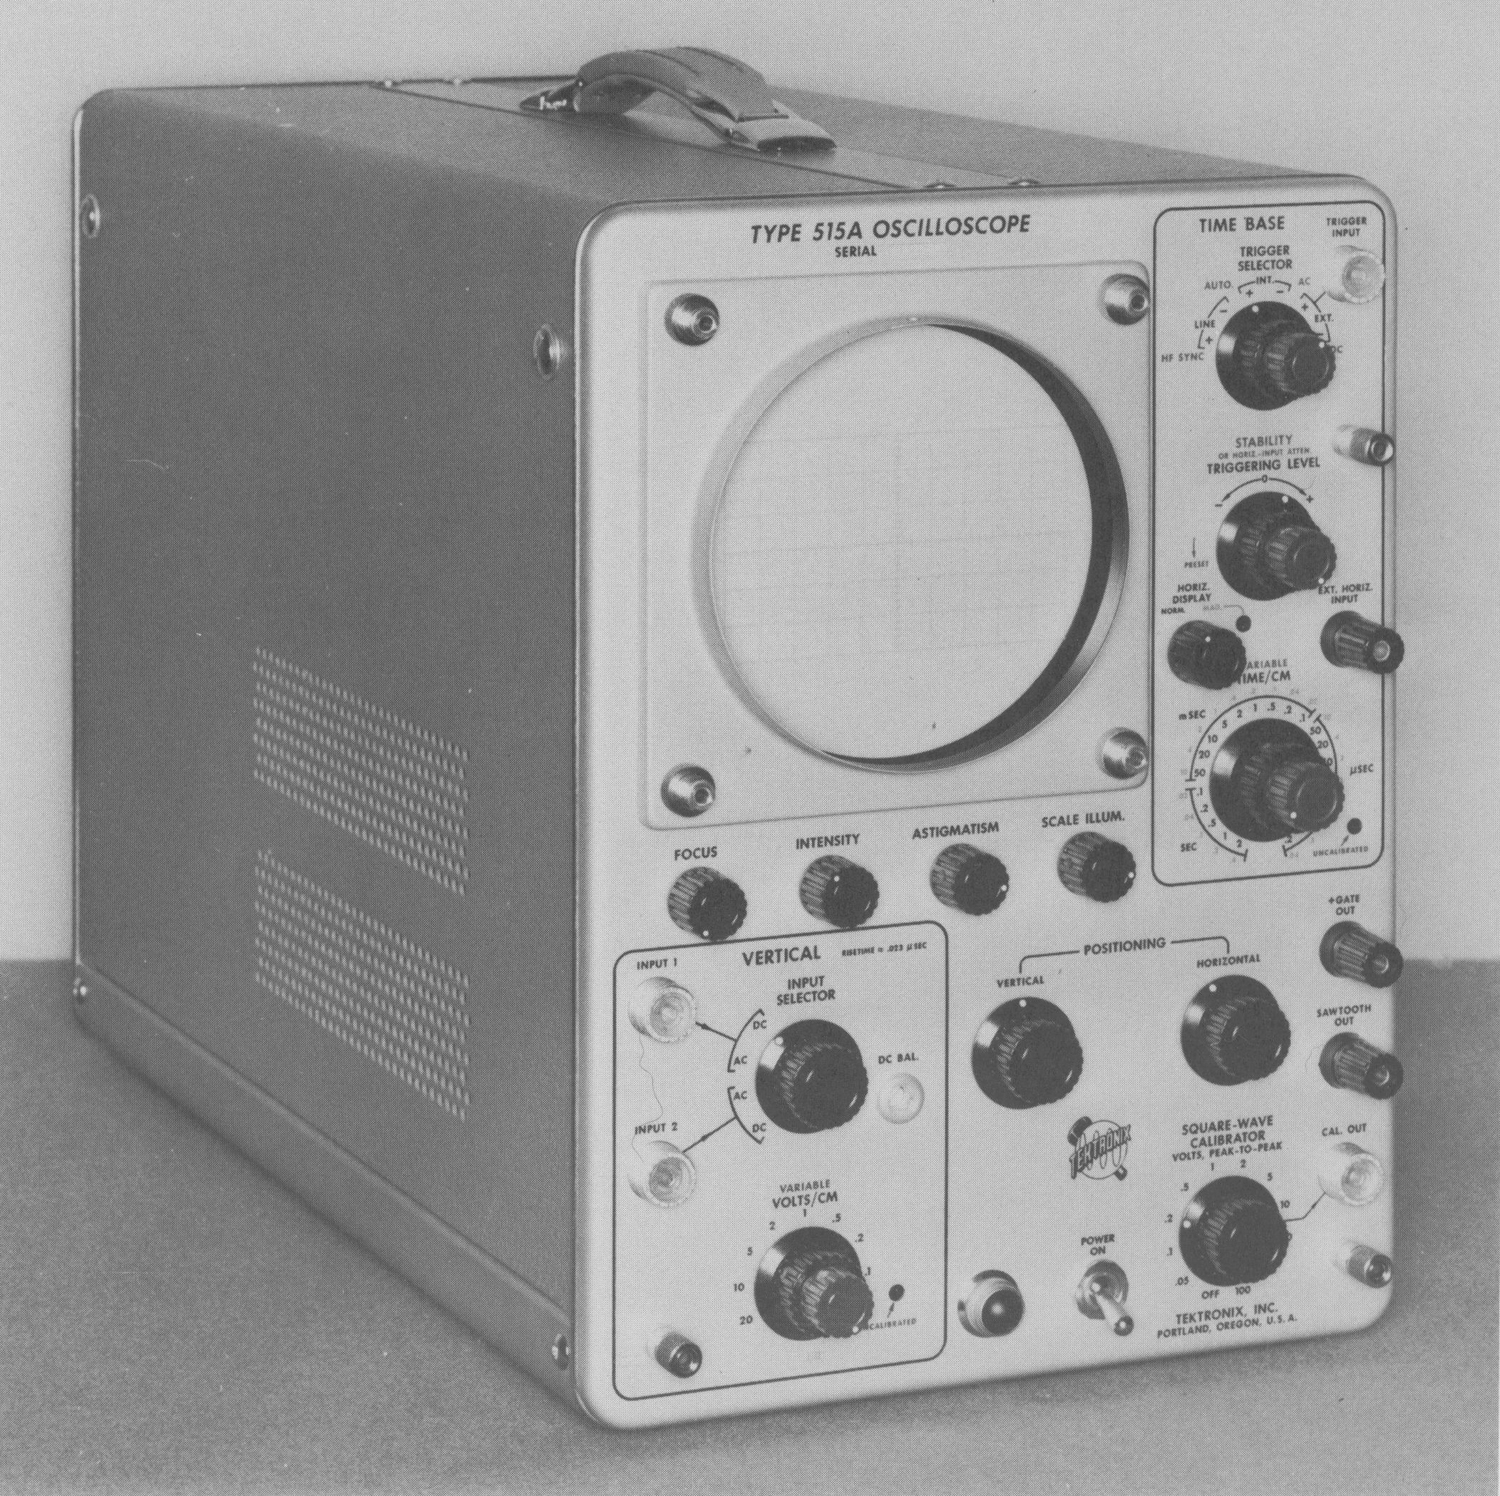
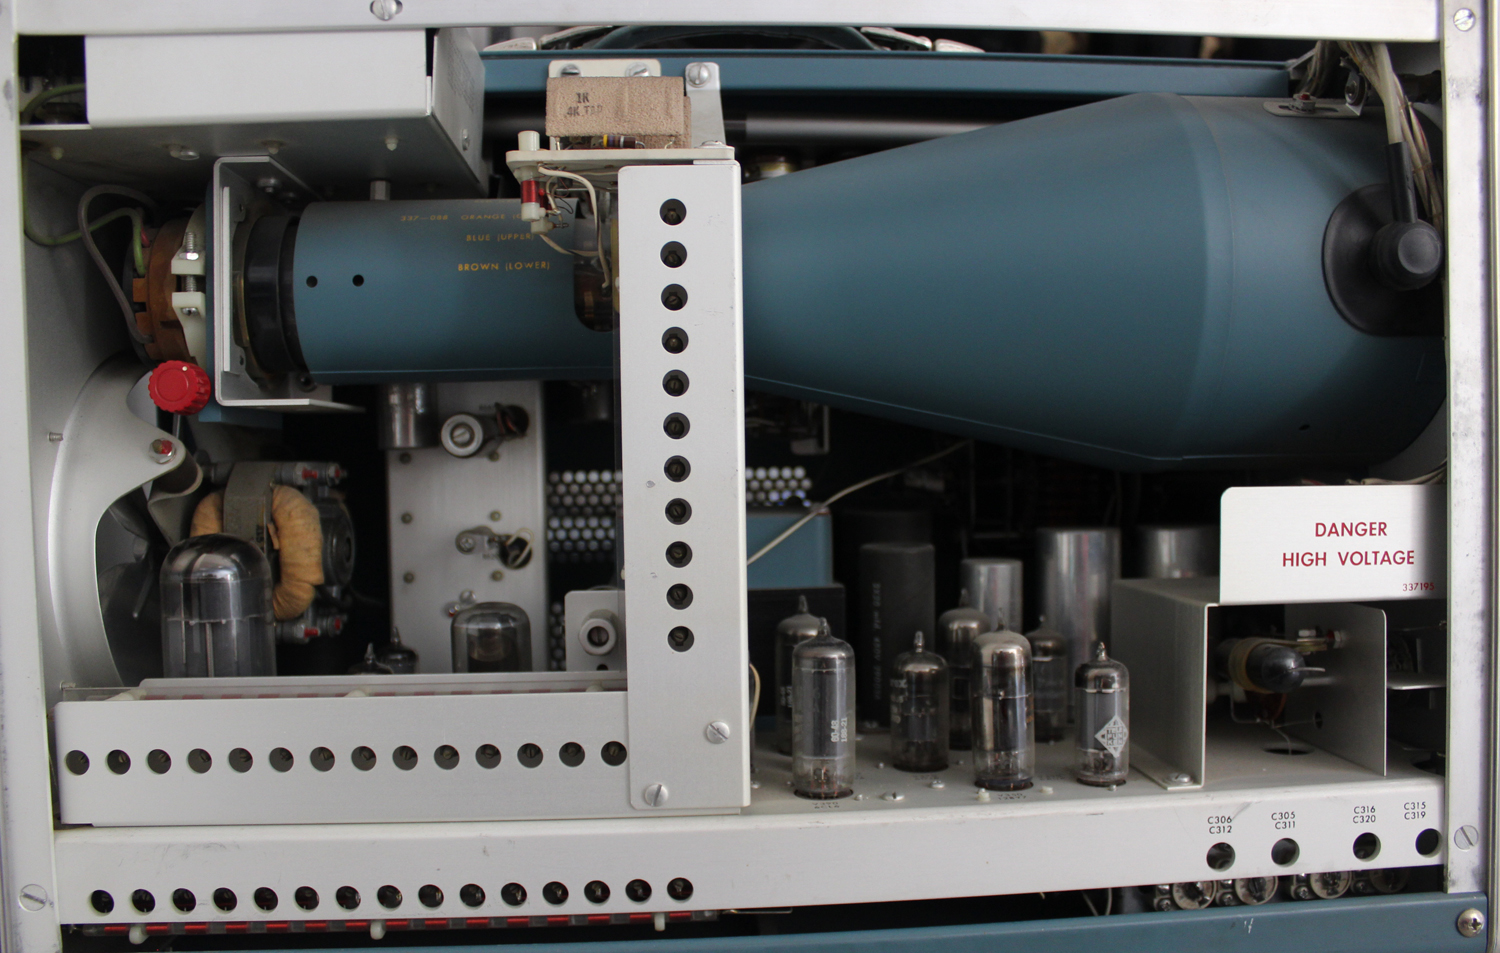
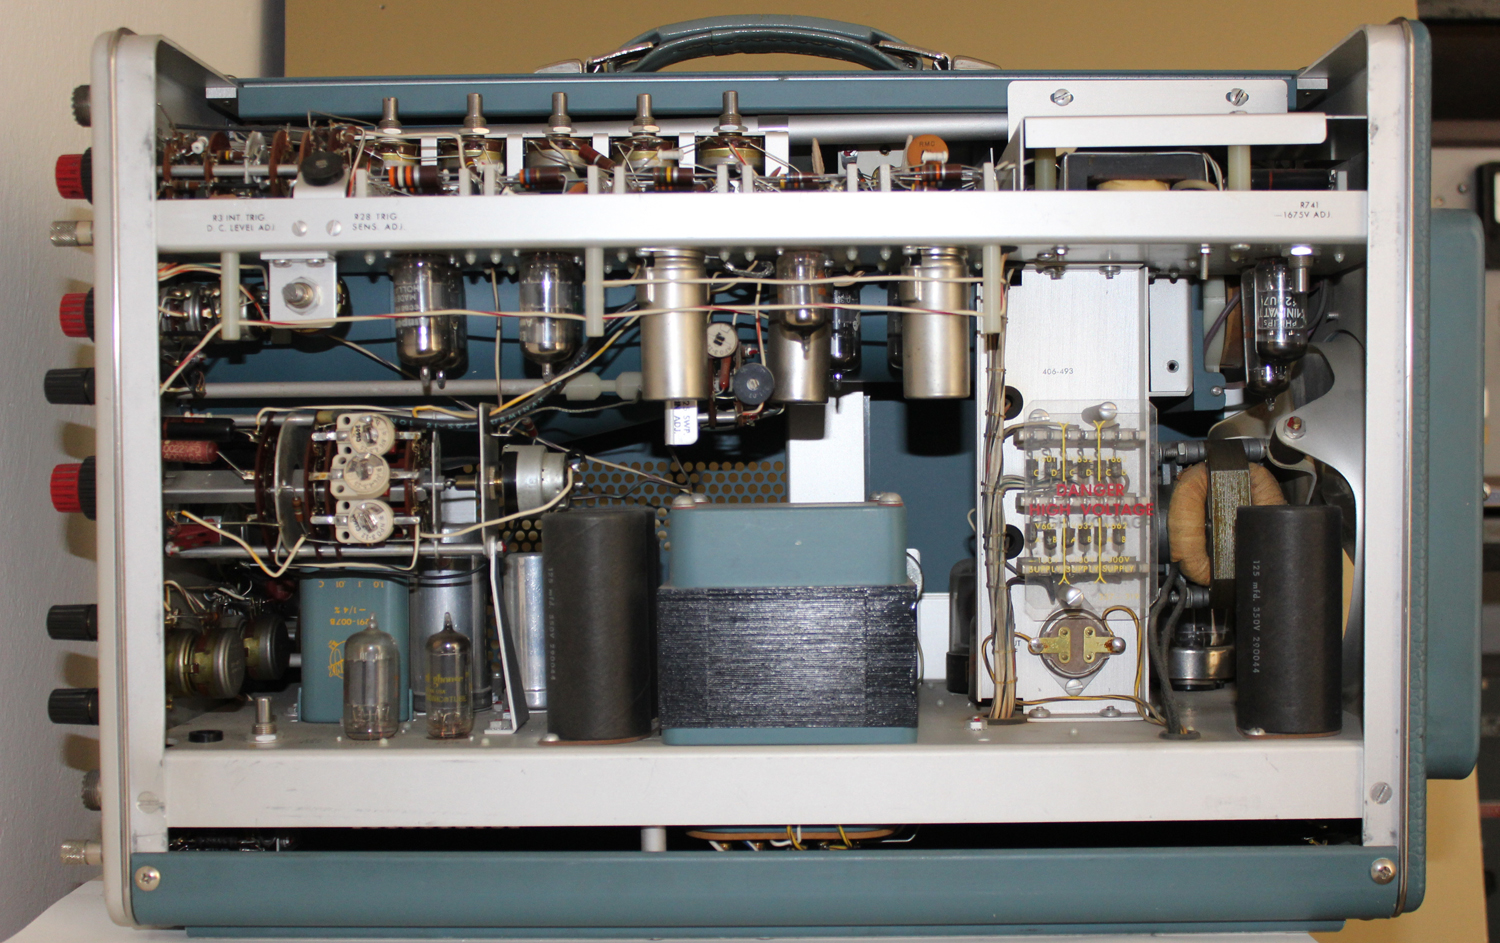
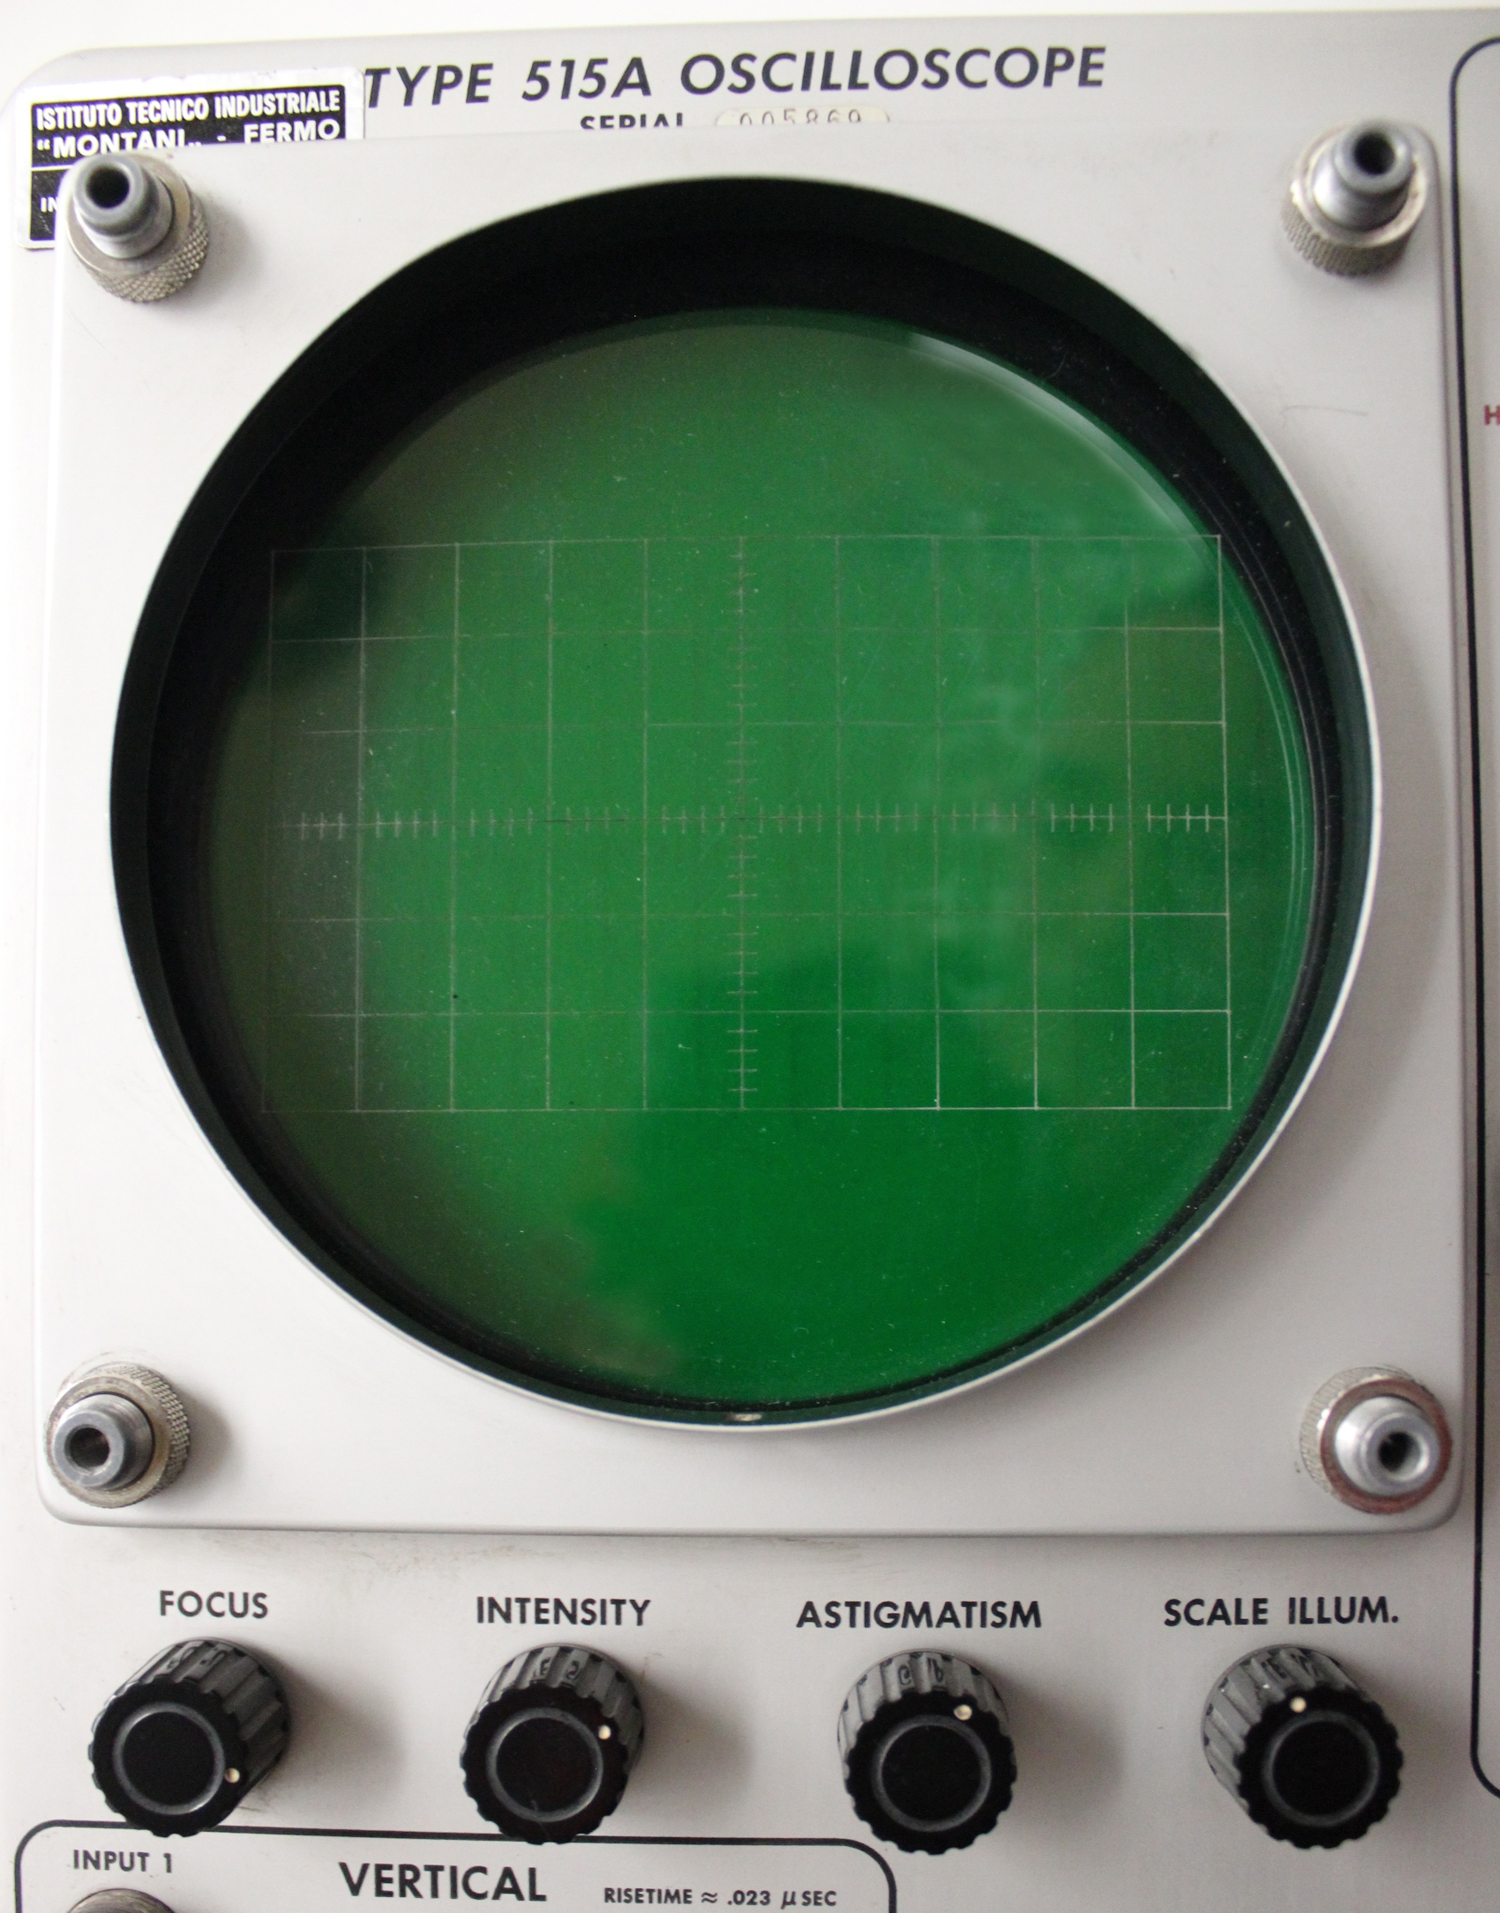
Oscilloscopio a tubo catodico Tektronix Type 515A serial 005869. Prima parte.
Della Tektronix, Inc. Portland, Oregon, Usa.  Nell’inventario D del 1956, in data aprile 1961, al n° 1899 si legge: “Imp. Silvestar-Milano – Oscilloscopio Tektronix tipo 515A. Destinazione Elettronica. ₤ 840.000”.
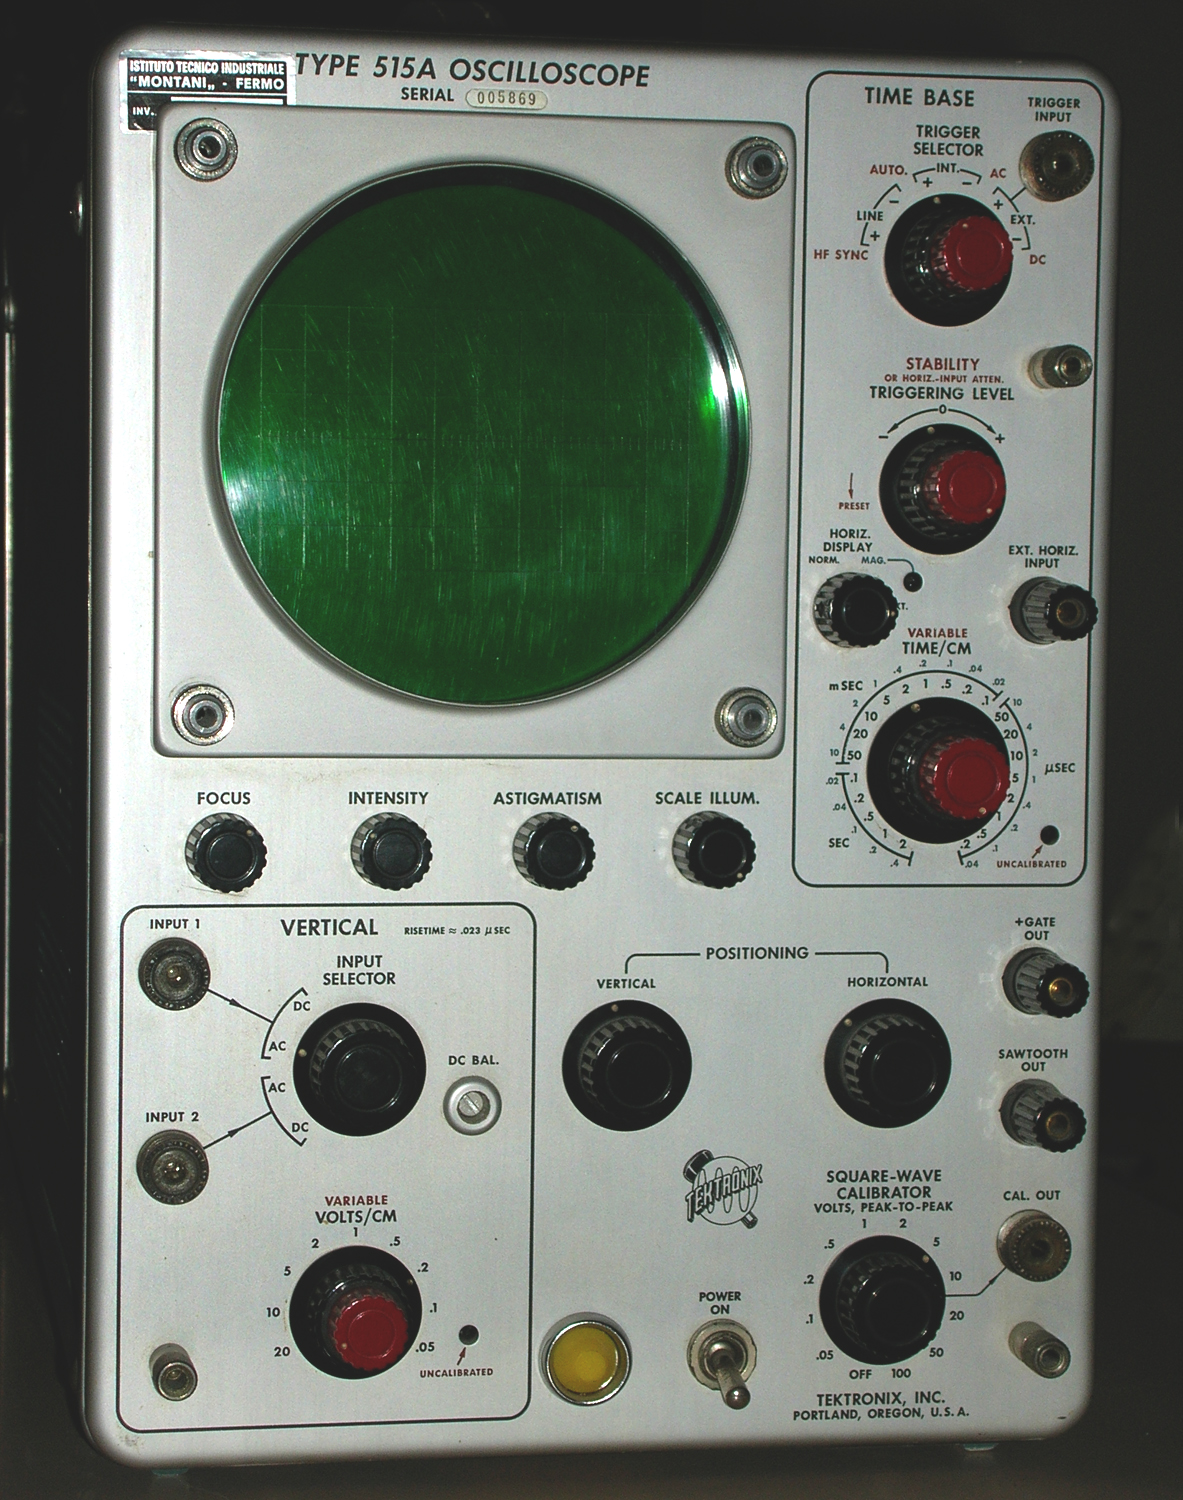
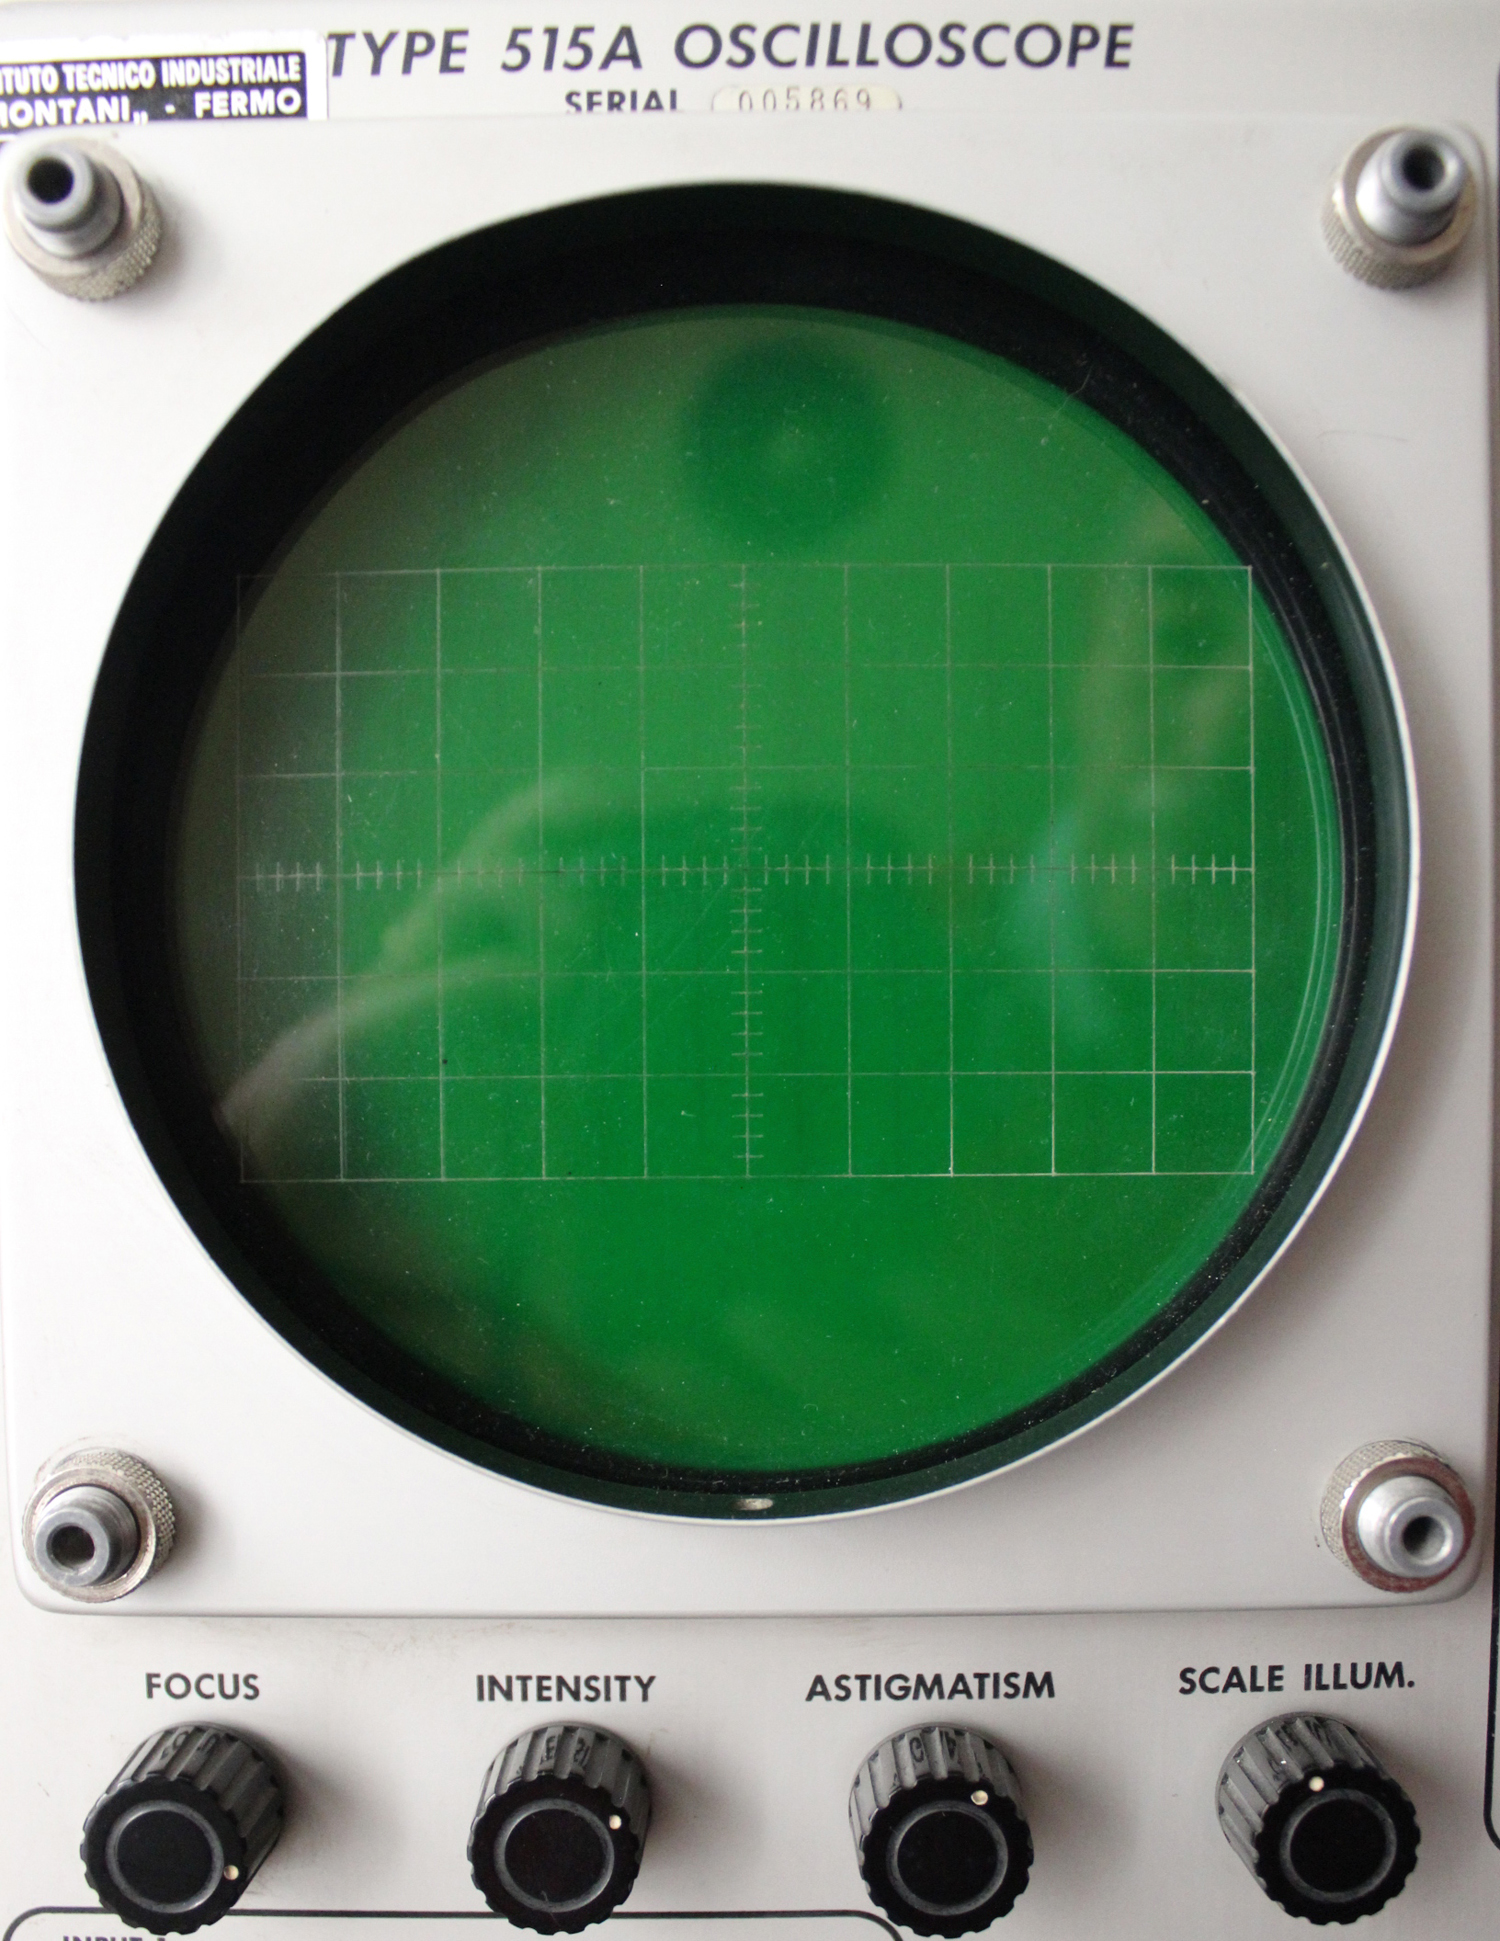
Era molto adatto didatticamente per un primo approccio all’uso degli oscilloscopi per la sua essenziale semplicità di funzioni.
Chi scrive lo ha usato nei primi anni sessanta al primo anno della Specializzazione Elettronica.
Nel 2007 è stato rimesso in funzione dall’ing. Claudio Profumieri in occasione di una mostra di strumenti antichi tenutasi presso la Facoltà di Ingegneria Informatica a Fermo.
Prima di metterlo in funzione, essendo stato per anni in disuso, bisogna assicurarsi che la ventola di raffreddamento non sia bloccata, e in questo caso molto frequente si provveda ad avviarla a mano, oliarla e, se è necessario, smontarla, pulirla ecc. .  Inoltre è consigliabile alimentare l’oscilloscopio con un variac partendo da una minima tensione per poi lentamente e gradualmente aumentarla; questa precauzione è necessaria, ma  a volte non sufficiente, soprattutto per i condensatori elettrolitici, specialmente quelli per alte tensioni. Infatti per rigenerarli occorrerebbe una procedura particolare.
L’oscilloscopio elettronico è uno strumento sia per uso didattico sia per la ricerca.
Con esso si possono misurare, con molta precisione, alcuni parametri di un segnale elettrico; inoltre si può visualizzare la forma d’onda sia di segnali periodici, sia di quelli soggetti a transitori.
Il cuore dello strumento è un particolare tubo a vuoto di vetro detto catodico, poiché il catodo caldo emette elettroni per effetto termico.
Un cannone elettronico provvede a focalizzare e ad accelerare gli elettroni, come avviene nei vecchi televisori CRT.
La differenza tra questi e l’oscilloscopio consiste nel meccanismo di deflessione che, non essendo magnetico ma elettrostatico, richiede una maggiore lunghezza del tubo e risulta in tale versione molto più preciso.
Gli elettroni usciti dal cannone elettronico passano attraverso due coppie successive di placchette metalliche, sottoposte ad opportune differenze di potenziale.
Le placchette sono parallele e affacciate; quelle verticali provvedono alla deflessione orizzontale che provoca sullo schermo fosforescente la “lettura” da parte degli elettroni lungo un segmento. Per rendere l’idea, somiglia al nostro modo di leggere questa stessa riga ripetutamente con la stessa rapidità. Un generatore di segnale, detto a “dente di sega”, vedi figura, provvede a rendere i tempi di lettura regolabili a nostro piacere e noti.
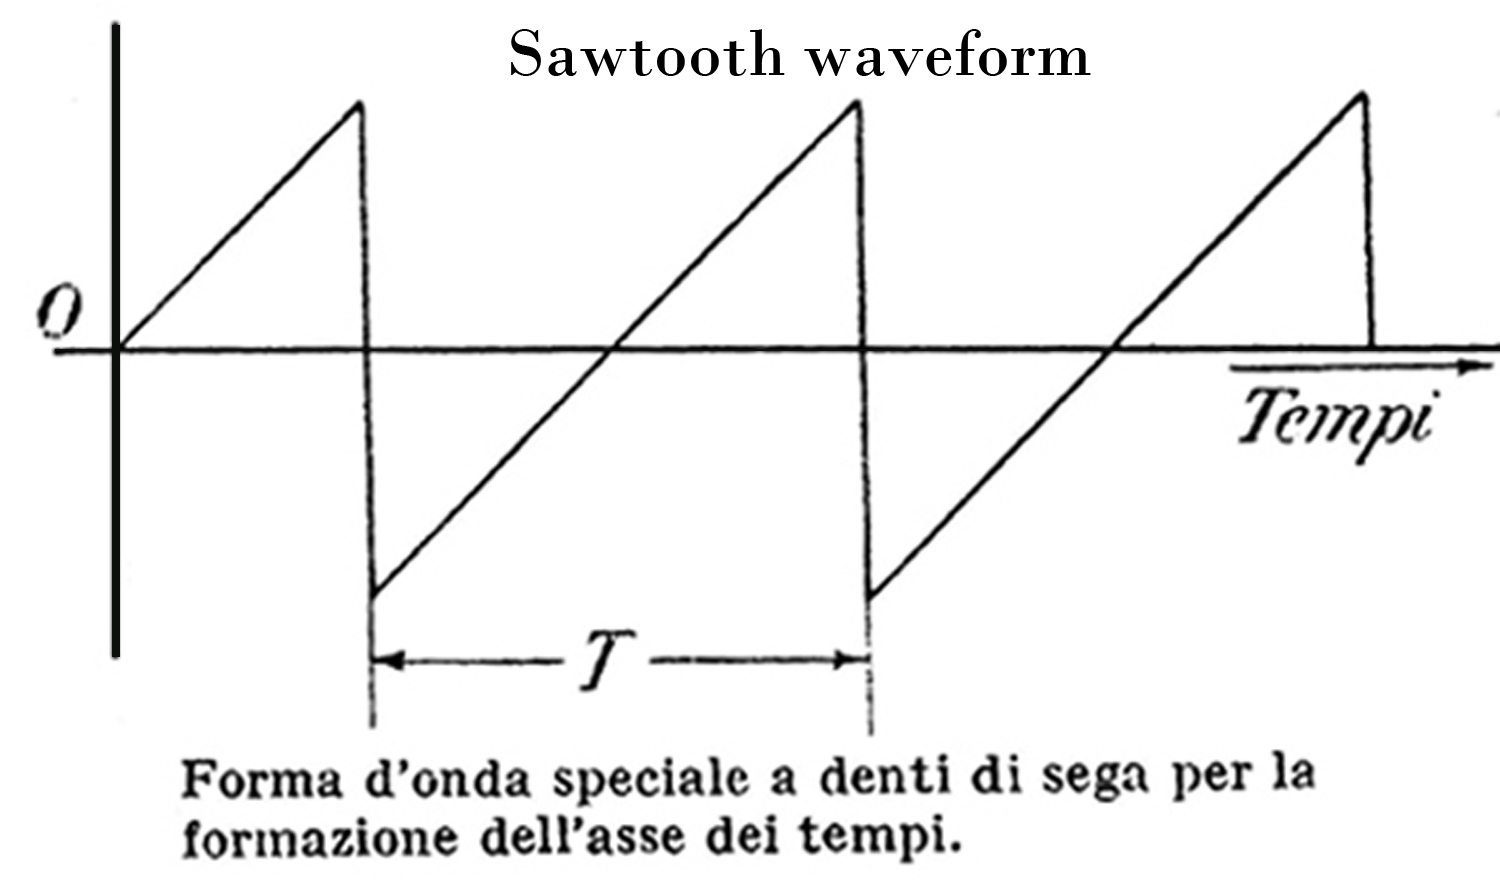
Altri dispositivi elettronici permettono di sincronizzare il segnale in esame con la frequenza di lettura in modo da congelare l’immagine sullo schermo.
Le placchette orizzontali producono la deflessione verticale e ad esse viene applicato il segnale da analizzare. La combinazione dei due effetti determina la visualizzazione della forma del segnale. Esistono numerosi tipi di oscilloscopi con dispositivi elettronici molto versatili e sofisticati che rendono questi strumenti preziosi per le misure. Gli oscilloscopi a doppia traccia visualizzano due segnali, permettendo di confrontarli. Quelli a memoria conservano l’immagine di un transitorio rapido per molto tempo permettendo anche di fotografarlo o di analizzarlo con comodità. Oscilloscopi campionatori possono visualizzare segnali di frequenze dell’ordine dei gigahertz, ecc..
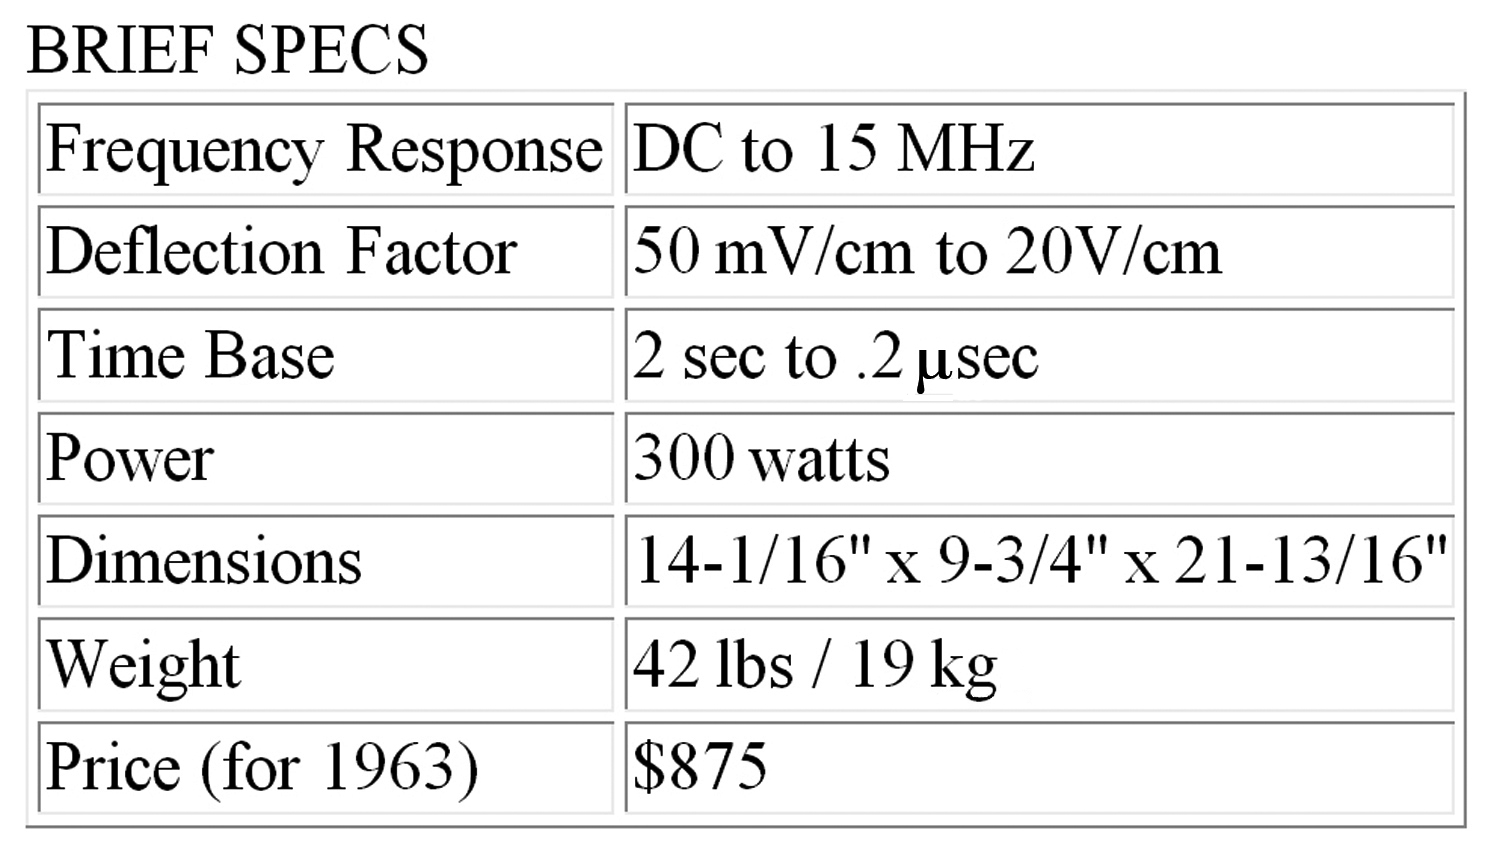
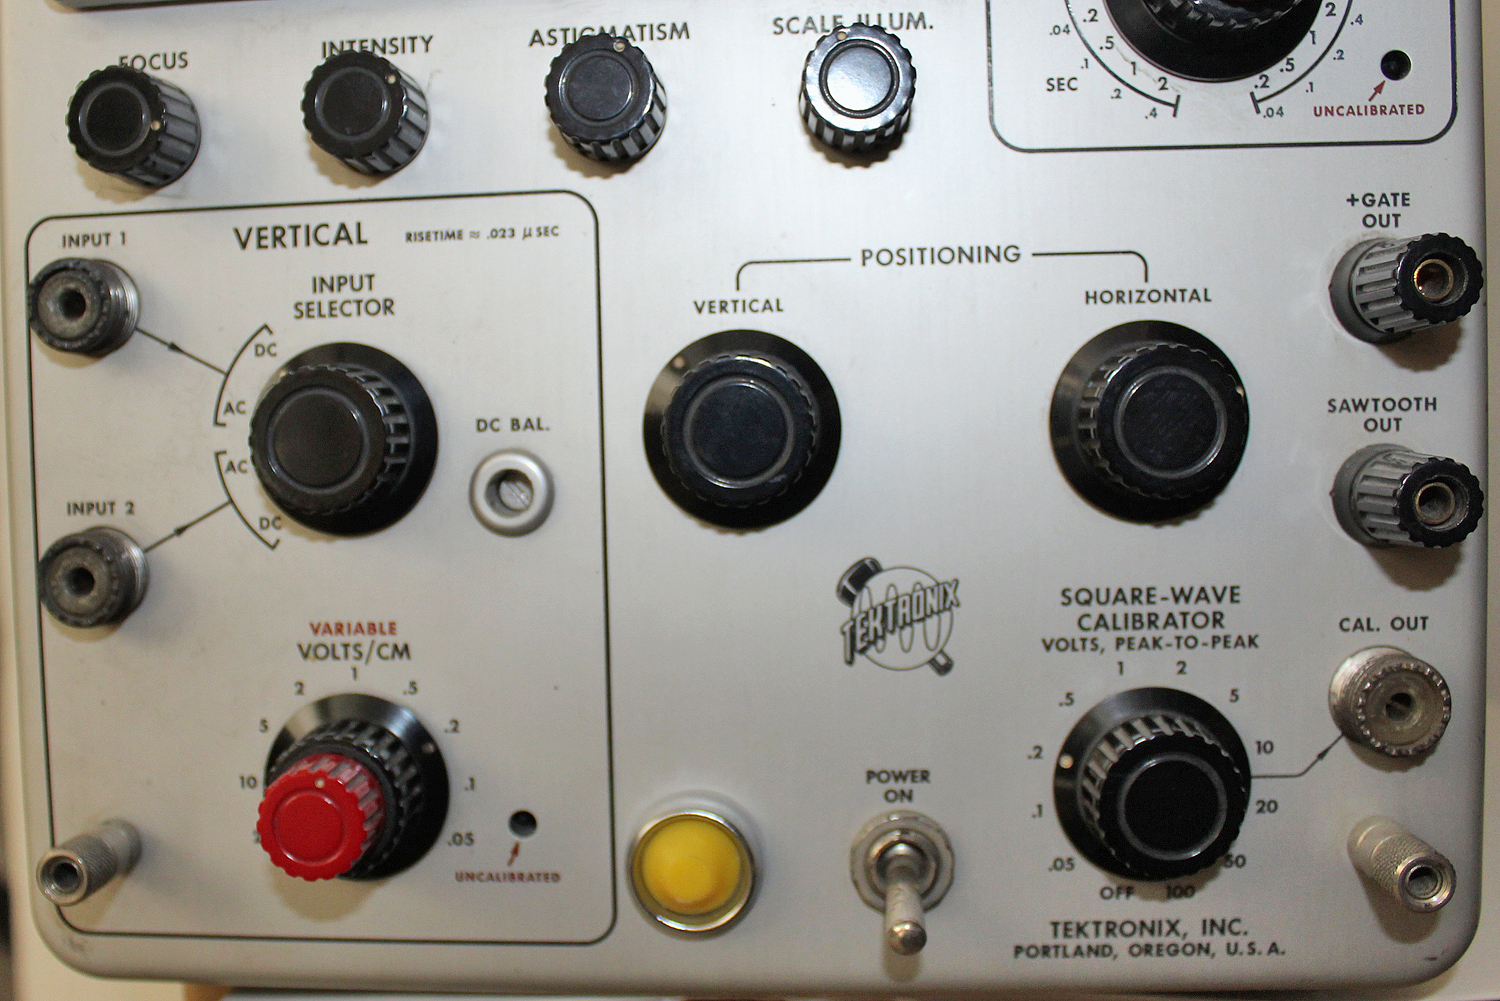
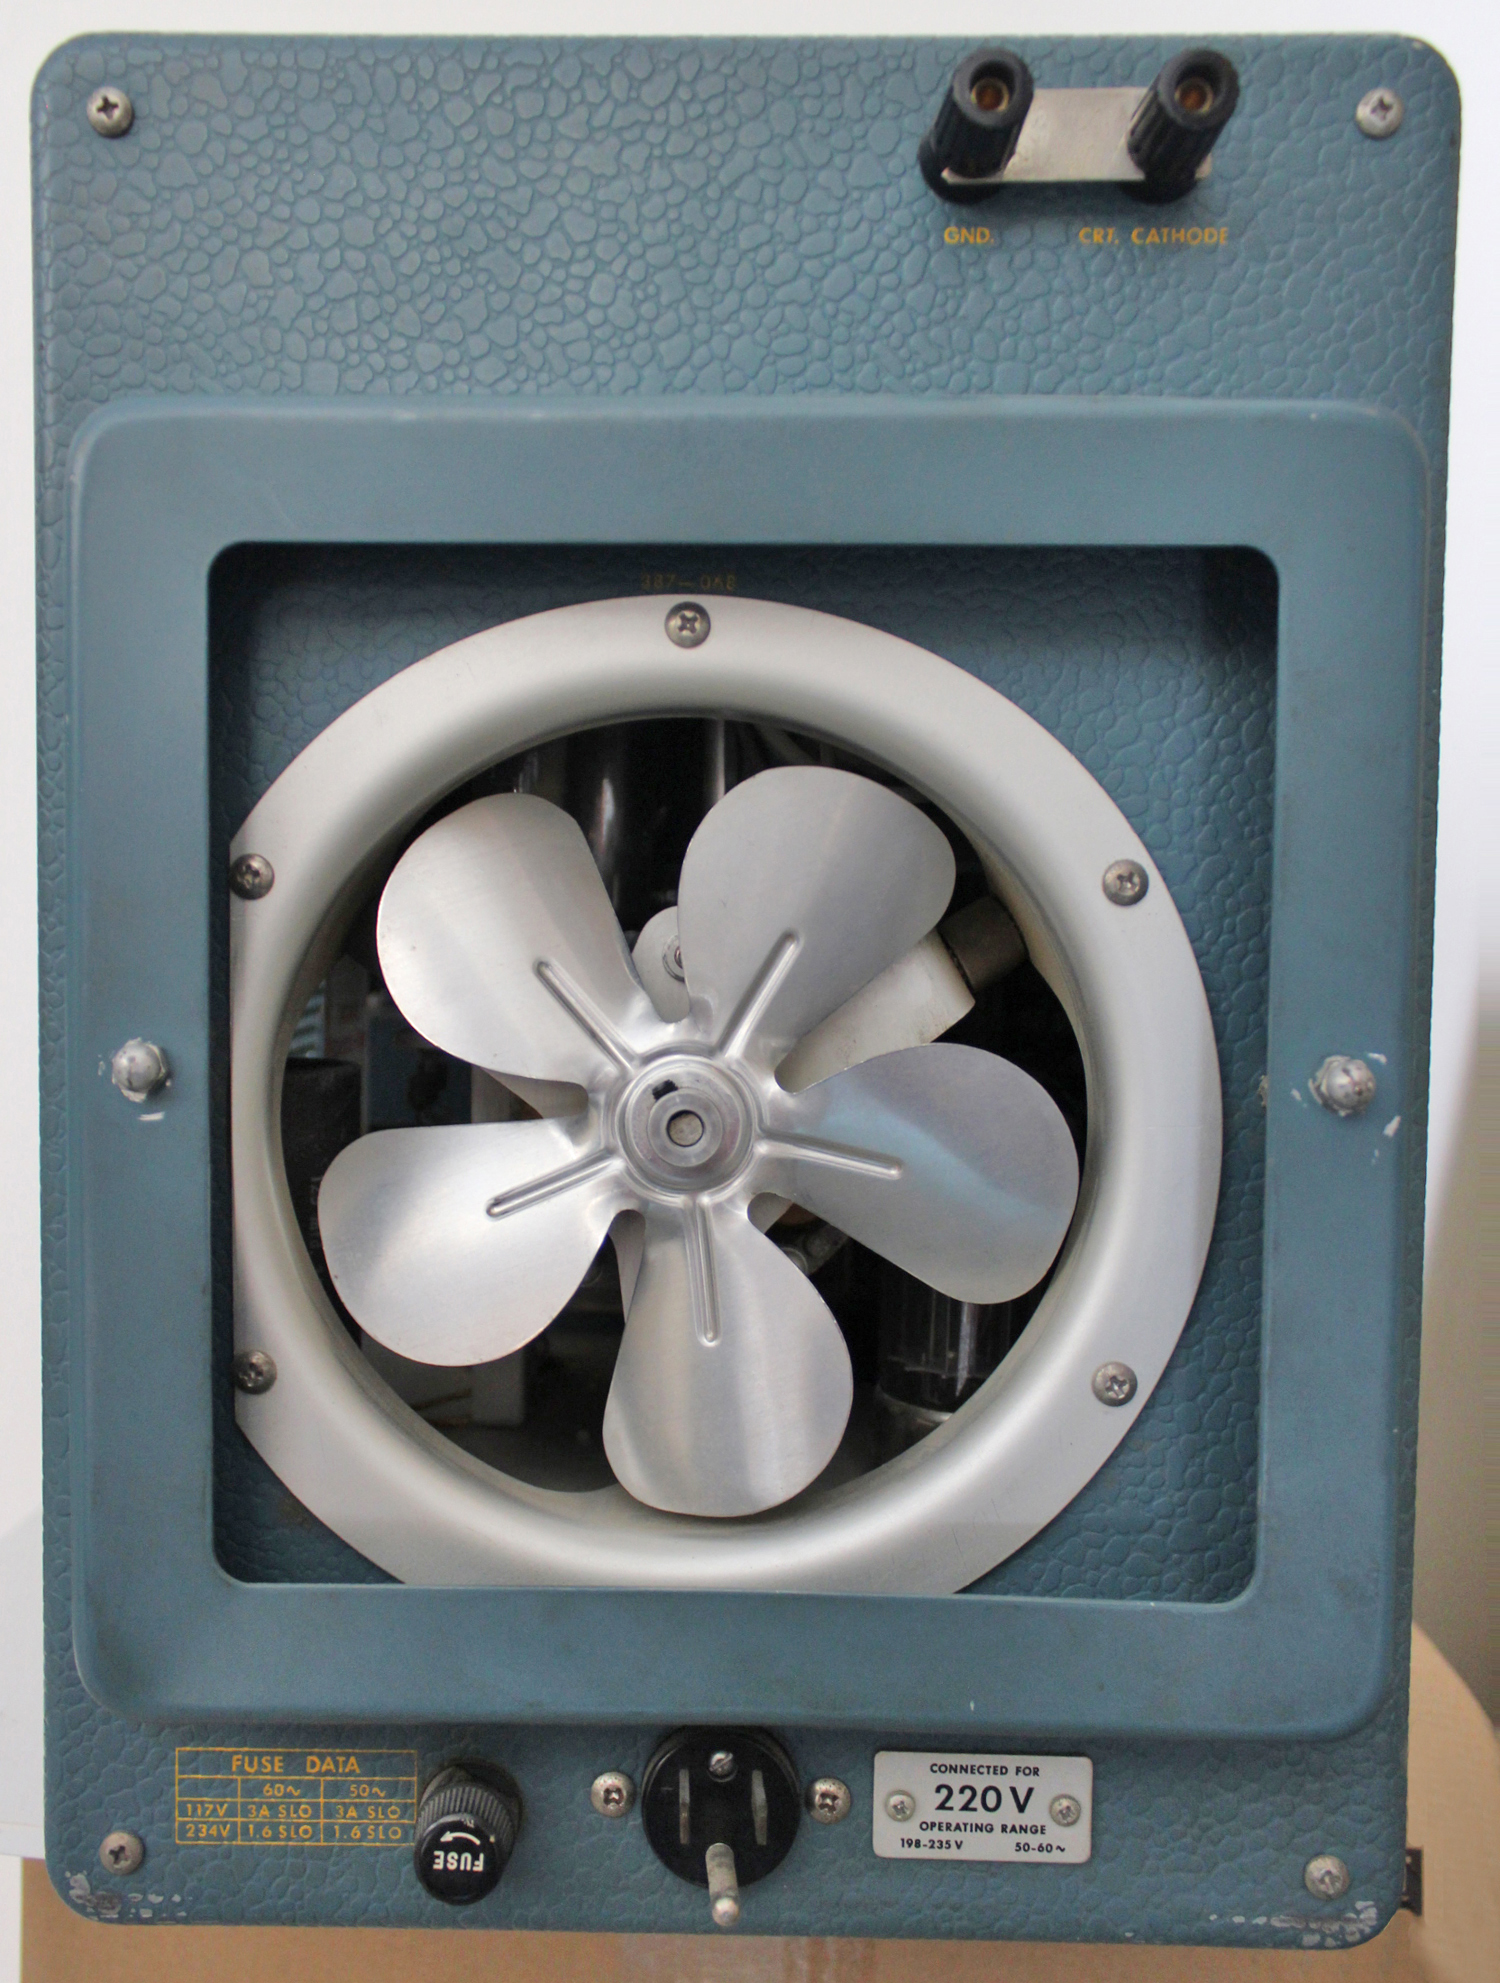

Dal manuale di istruzioni conservato presso la Sezione Elettronica, abbiamo tratto quanto segue fino alla quinta parte:
§§§
                                           «SECTION I
                                       SPECIFICATIONS

The Type 515/515A Oscilloscope is a compact, portable general purpose oscilloscope. The dc-coupled amplifier and wide range of sweep rates, combined with reduced size, make the Type 515/515A a versatile field or laboratory instrument.
  Vertical-Deflection Syste  Deflection Factor-.05 volt/cm ac or dc. (.1 volt/cm ac or dc S/N 101-1000) Frequency Response-dc to 15 mc, 2 cycles to 15 mc ac. (Down not more than 3clb at above limits.)
Rise Time-.023 microseconds.
Linear Deflection-6 cm.
Step Attenuator-Nine positions, calibrated, from .05 v/cm (.1 v/cm S/N 101-1000) to 20 v/cm, (50 v/cm S/N 101-1000) accurate within 3% when set on any one step.
Maximum Allowable Combined DC and Peak
AC Voltage Input-600 v.
Input Impedance-1 megohm, about 36 μμf; with P410 probe-10 megohm, 10.5 μμf. With P6000 probe, 10 megohm, 11.5 μμf.
   Horizontal-Deflection System
   Time Base Range
Twenty-two calibrated time bases from .2 psec/cm to 2 sec/cm.
Accuracy-3 per cent, except at 2 sec/cm it is 5 per cent. Continuously variable, uncalibrated between  ranges and to at least 6 sec/cm.
Magnifier
Expands sweep 5 times to right and left of screen center. Extends fastest sweep rate to .04 μsec/cm.
Accuracy-4 per cent, except at .04 μsec/cm it is 5 per cent.
Unblanking—DC coupled.
Trigger Requirements Internal – AC, DC: Minimum requirement is 2  mm of deflection up to 5 mc.

AUTO: Minimum requirement is 5  mm of deflection up to 2 mc. External-AC , DC: 0 .2 volt to 20 volts.
AUTO: 1 volt to 20 volts.
Frequency Range—dc to 15 mc.
Synchronization of the Sweep is possible to 15 mc with external signal amplitudes from 0.2 volts to 20 volts.
Horizontal Input
Deflection Factor-1.4 v/cm.
Frequency Response-DC to 500 kc, 3 db down.
 Other Characteristics
Cathode-Ray Tube Type T0550-31, T55P31 P1, P2, and P11 phosphors optional.
Accelerating Potential -4,000 volts.
Deflection Factor at Plates
Vertical -5 v/cm.
Horizontal -20 v/cm.
Voltage Calibrator Eleven fixed voltages from .05 volts to
100 volts, peak to peak.

Accuracy-3 per cent.
Waveform-square wave at about 1 kc.
Output Waveforms Available Positive gate of same duration as sweep, approx. 20 volts. Positive going sweep
sawtooth, approximately 150 volts.
Power Supply Electronic Regulation.
Power Requirements -105 to 125, or 210to 250 v, 50-60 cycles, 275 watts.
       Mechanical Specifications
Ventilation-Filtered, forced-air ventilation.
Finish – Photo-etched, anodized panel, blue
wrinkle, perforated cabinet.
Dimensions -9 ¾” wide, 13 ½” high, 21 ½”
deep.
Weight -40 pounds.
Accessories lncluded
1-P6006 probe, 010- 127
2-BNC to Binding Post Adapter, 103-033.
1-F510-5 green filter, 378-514.
2-Instruction manuals.
1-3 to 2-wire adapter, 103-013.
1-3-conductor power cord, 161-010.»
§§§

Il testo prosegue nella seconda parte.
Per consultare le altre parti dedicate a questo oscilloscopio scrivere: “515A” su Cerca.
Foto di Claudio Profumieri, elaborazioni, ricerche e testo a cura di Fabio Panfili.
Per ingrandire le immagini cliccare su di esse col tasto destro del mouse e scegliere tra le opzioni.


Distortion Analyzer Hewlett Packard 332A matr. N° 930 – 96620 4ª parte

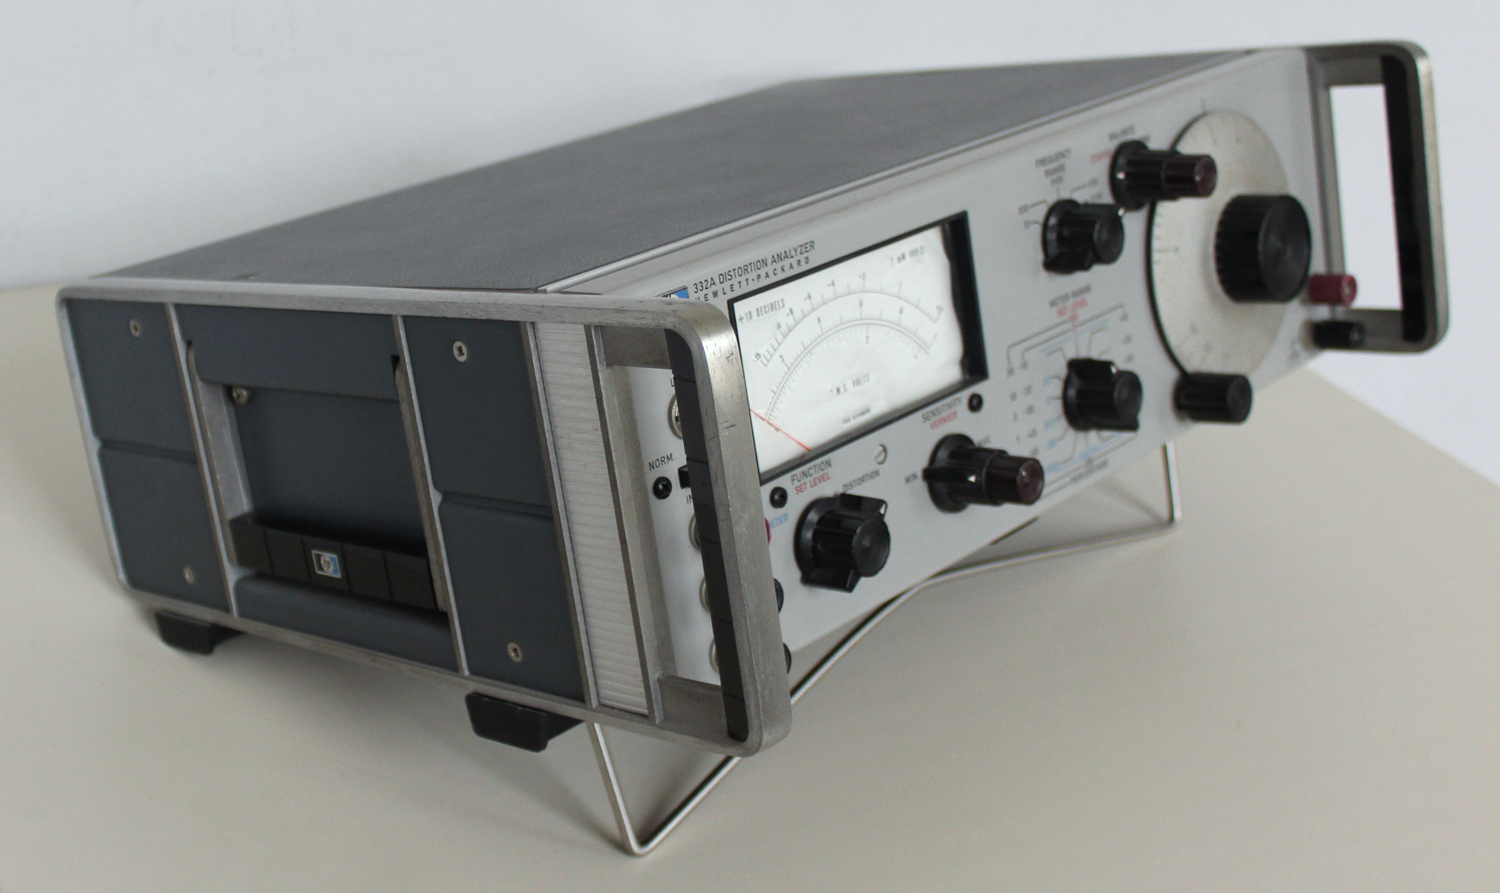
Distortion Analyzer Hewlett Packard 332A matr. N° 930 – 96620. Quarta parte.
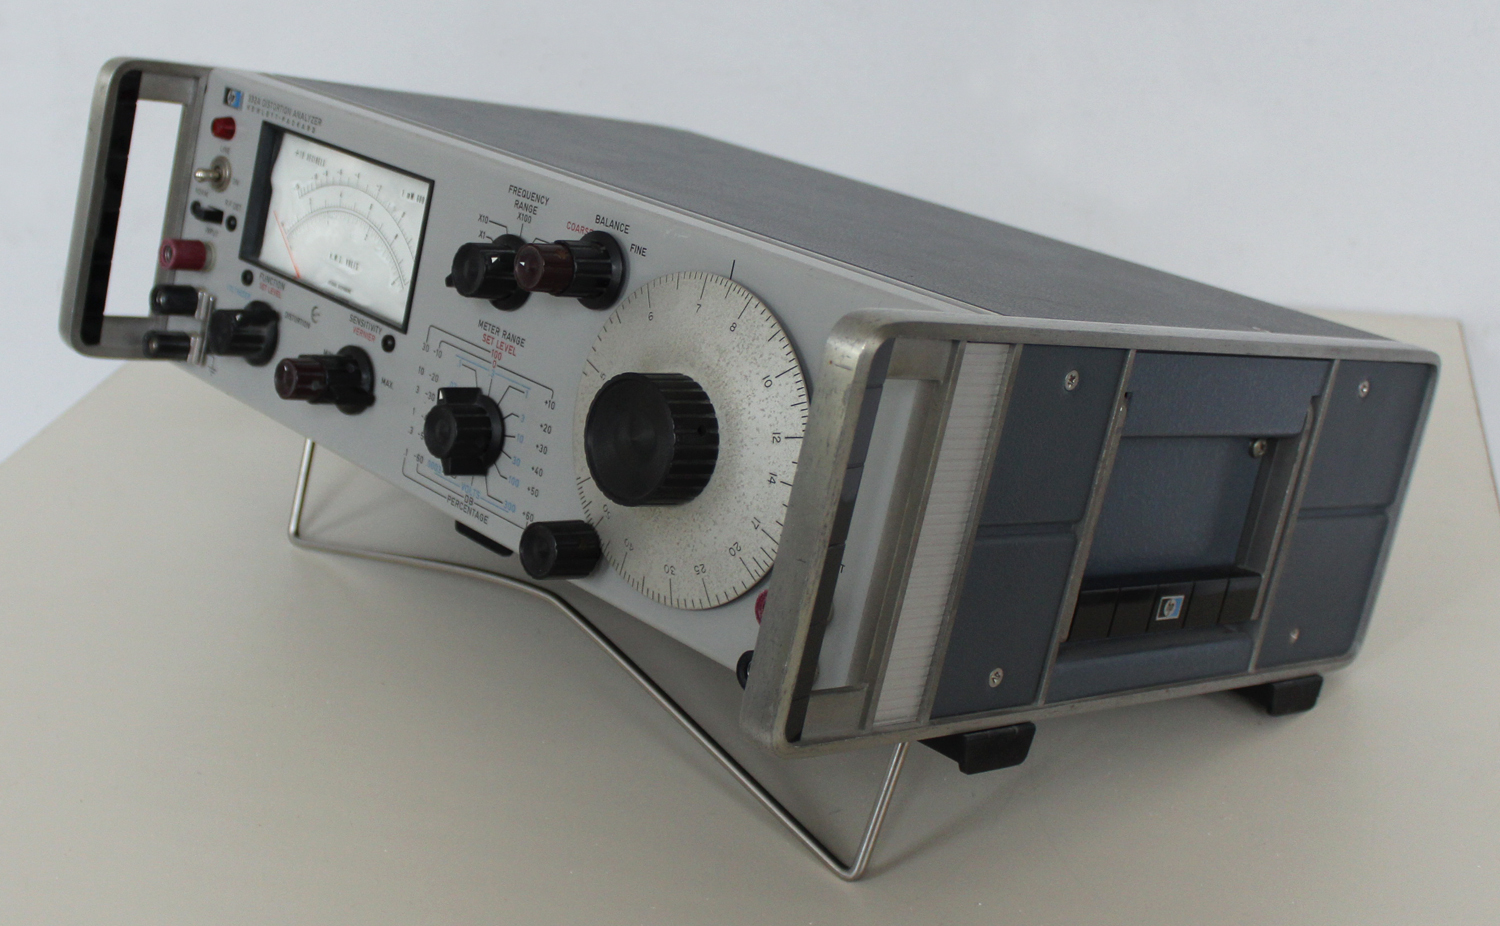
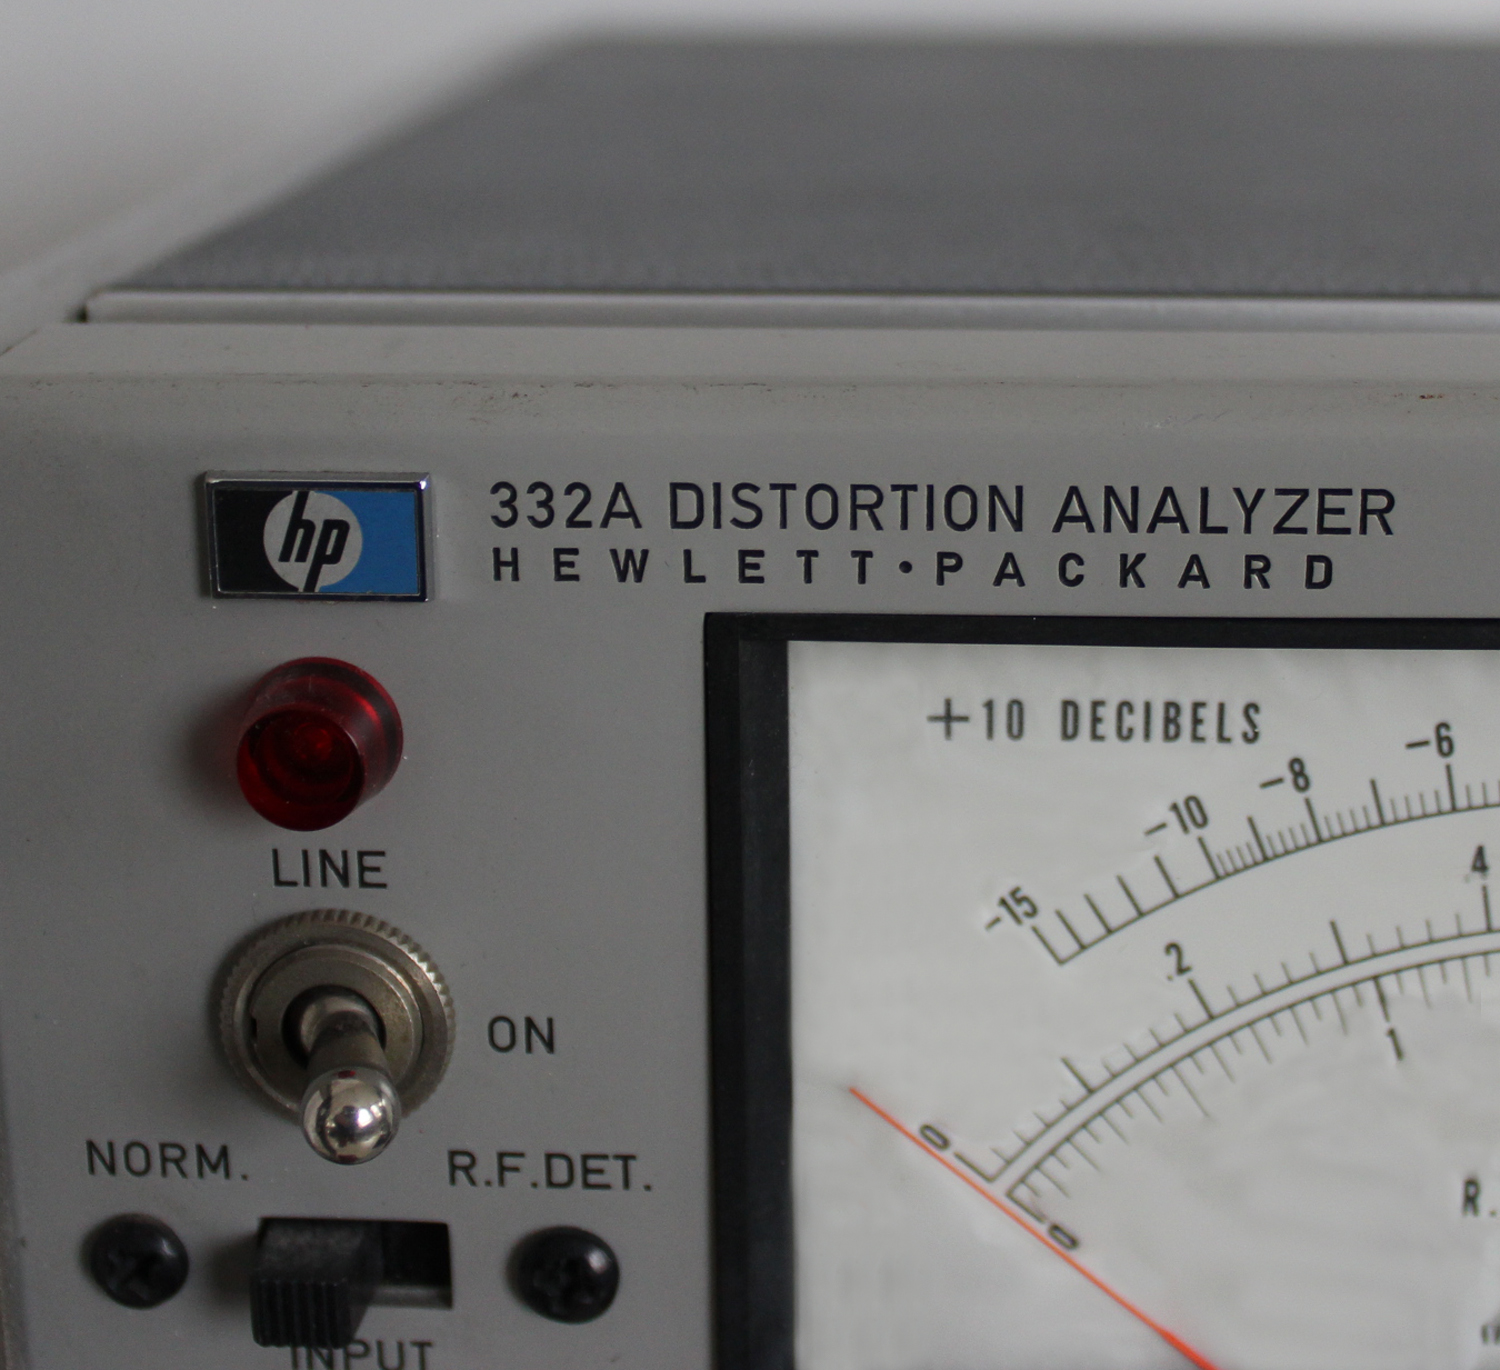
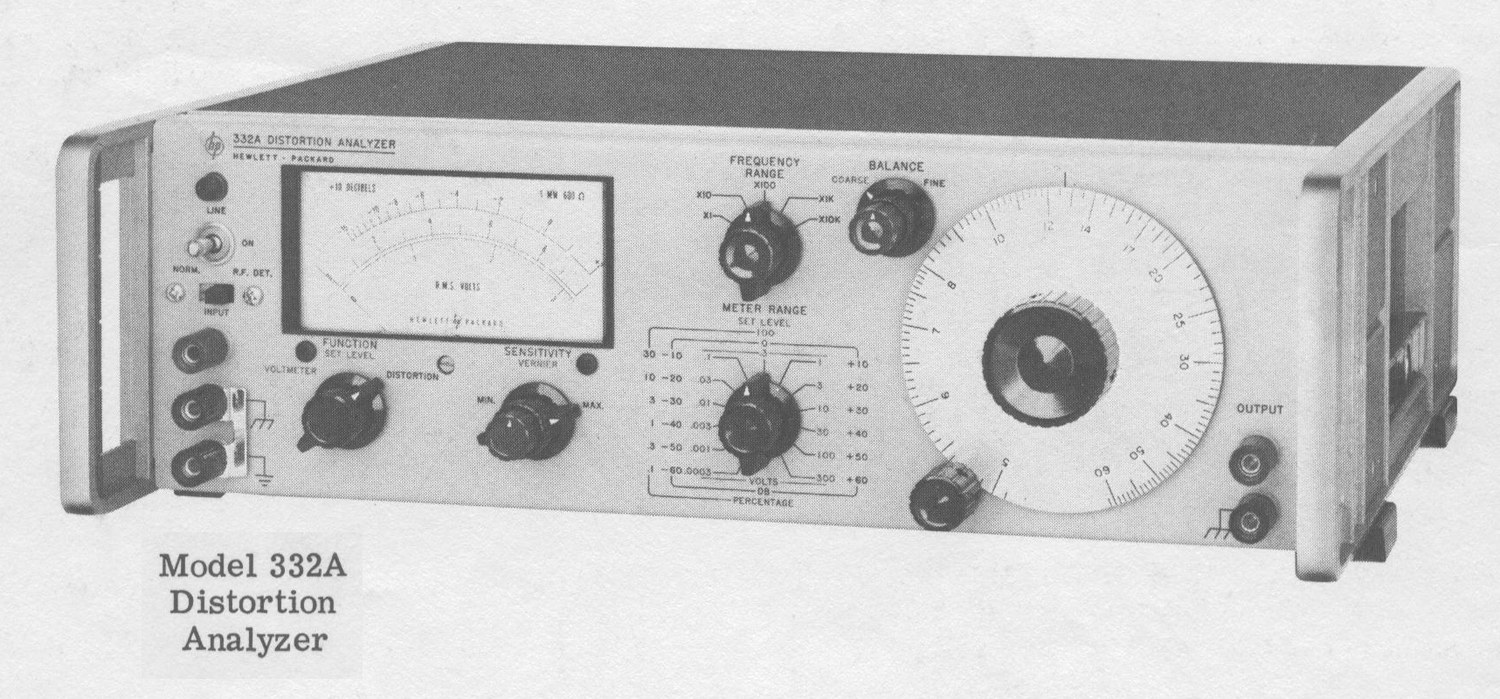
Nell’inventario particolare del Laboratorio di Elettronica  al n°  D 4826, in data  ottobre 1970, si legge:  “Distortion Analyzer  S/N 620 mod. 332A”.
Nell’HEWLETT·PACKARD Journal VOL. 17 NO. 8 APRIL 1966 vi è addirittura la presentazione del modello 334A che, nell’amplificatore di eliminazione della tensione a frequenza fondamentale (rejection),  ha il ponte di Wien, come questo mod. 332A e come l’esemplare -hp- 330B che si può vedere in questo sito nella sezione Radiotecnica.
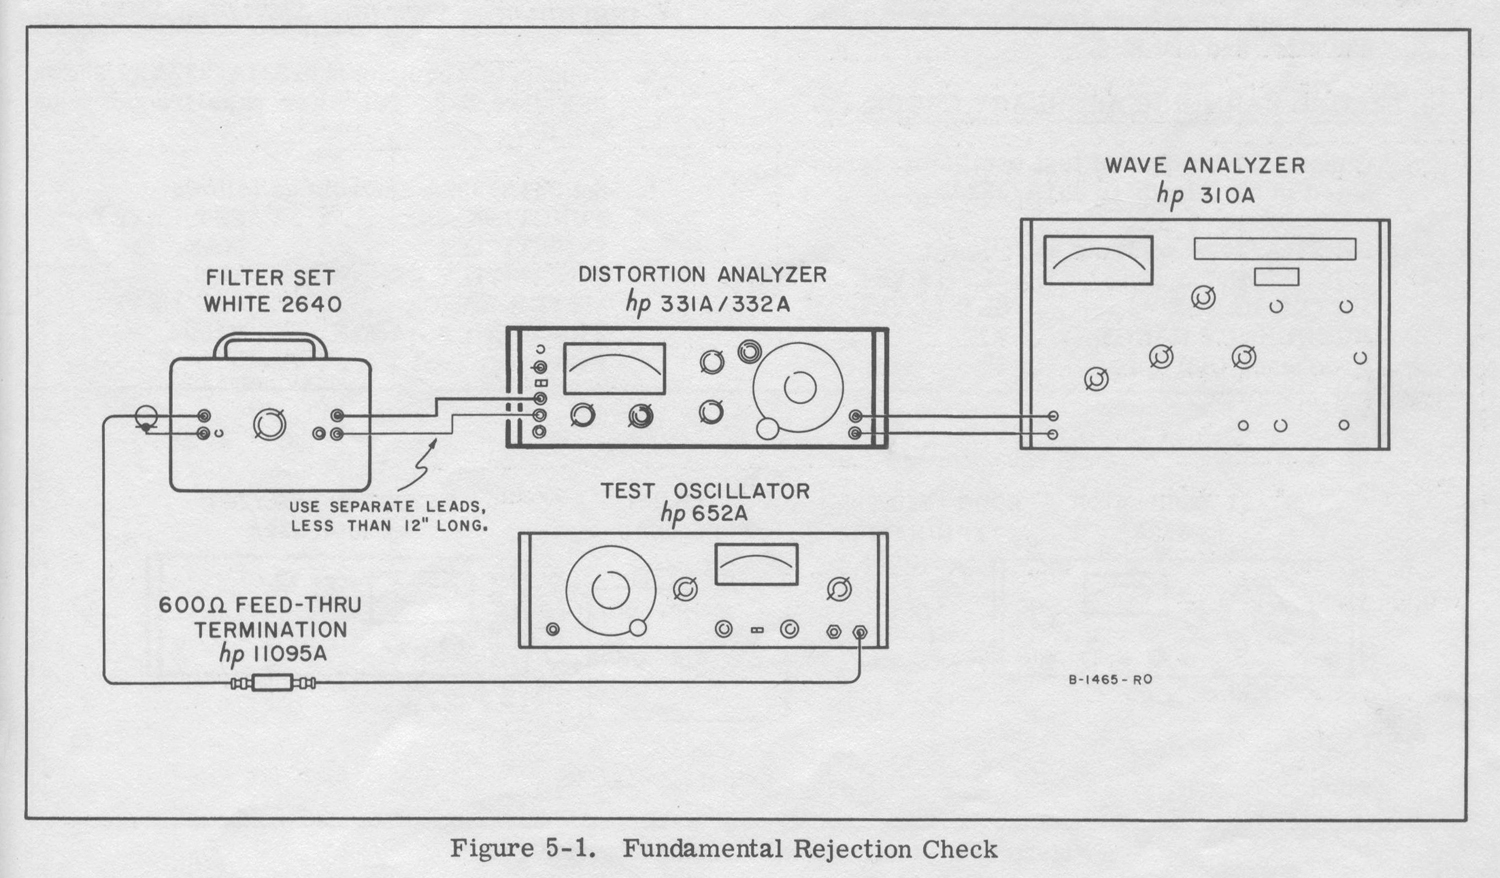
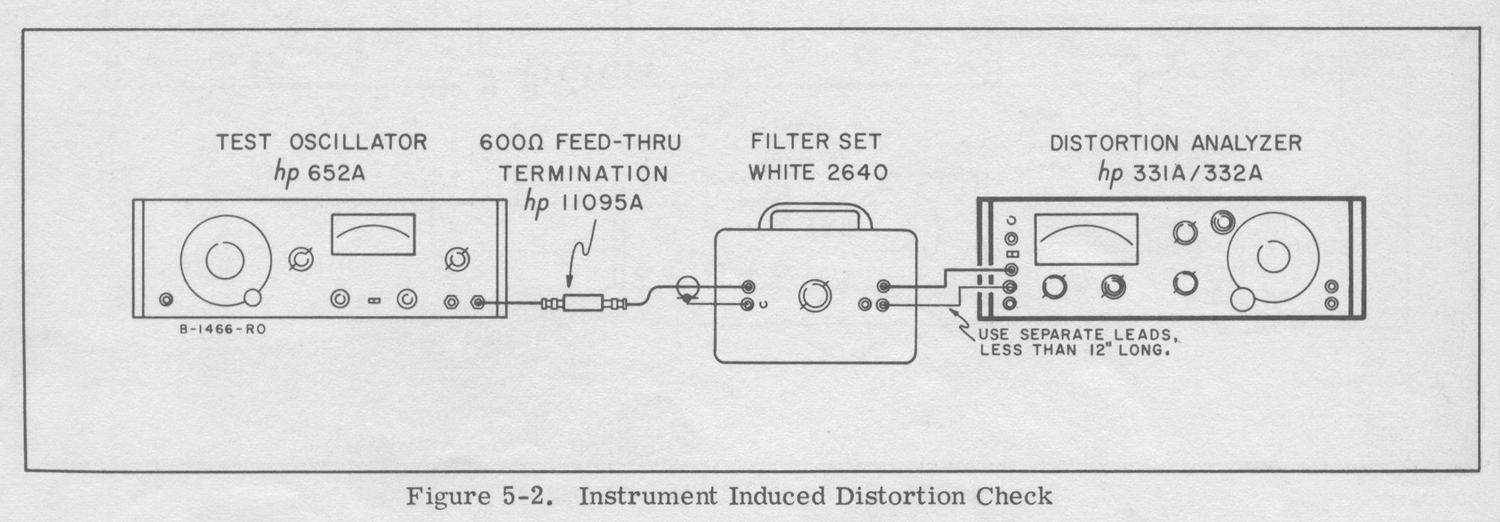
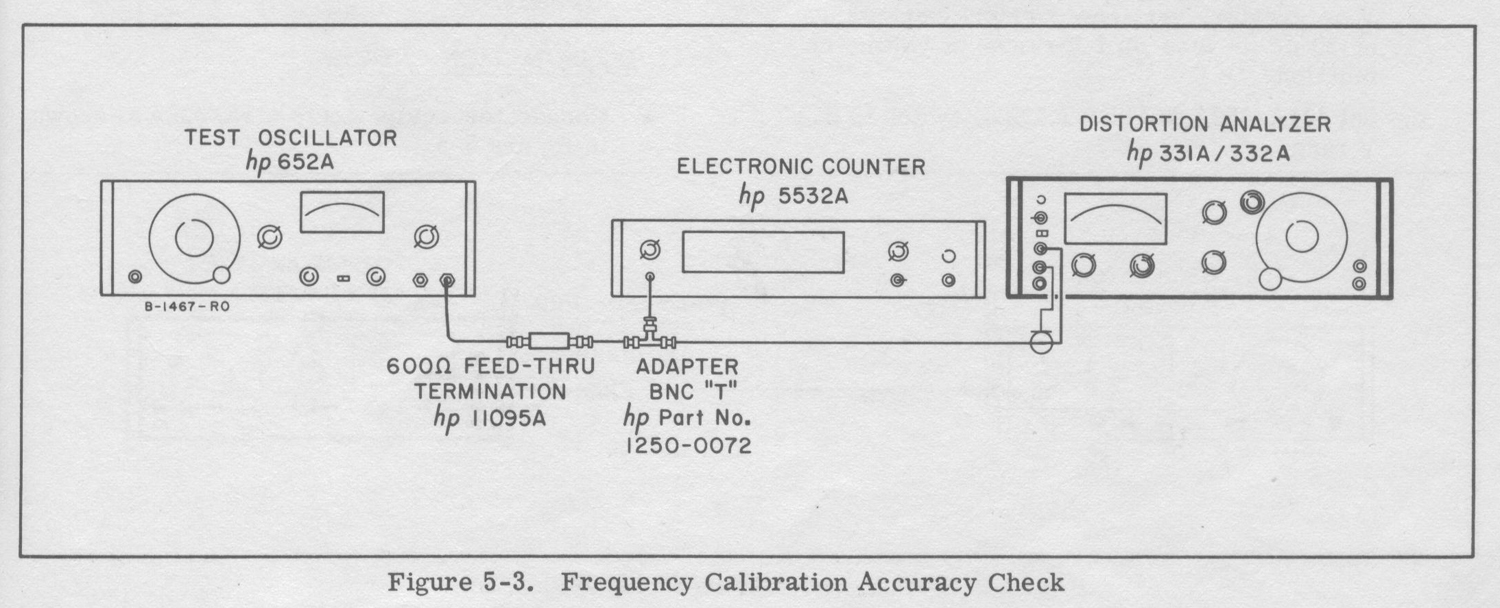
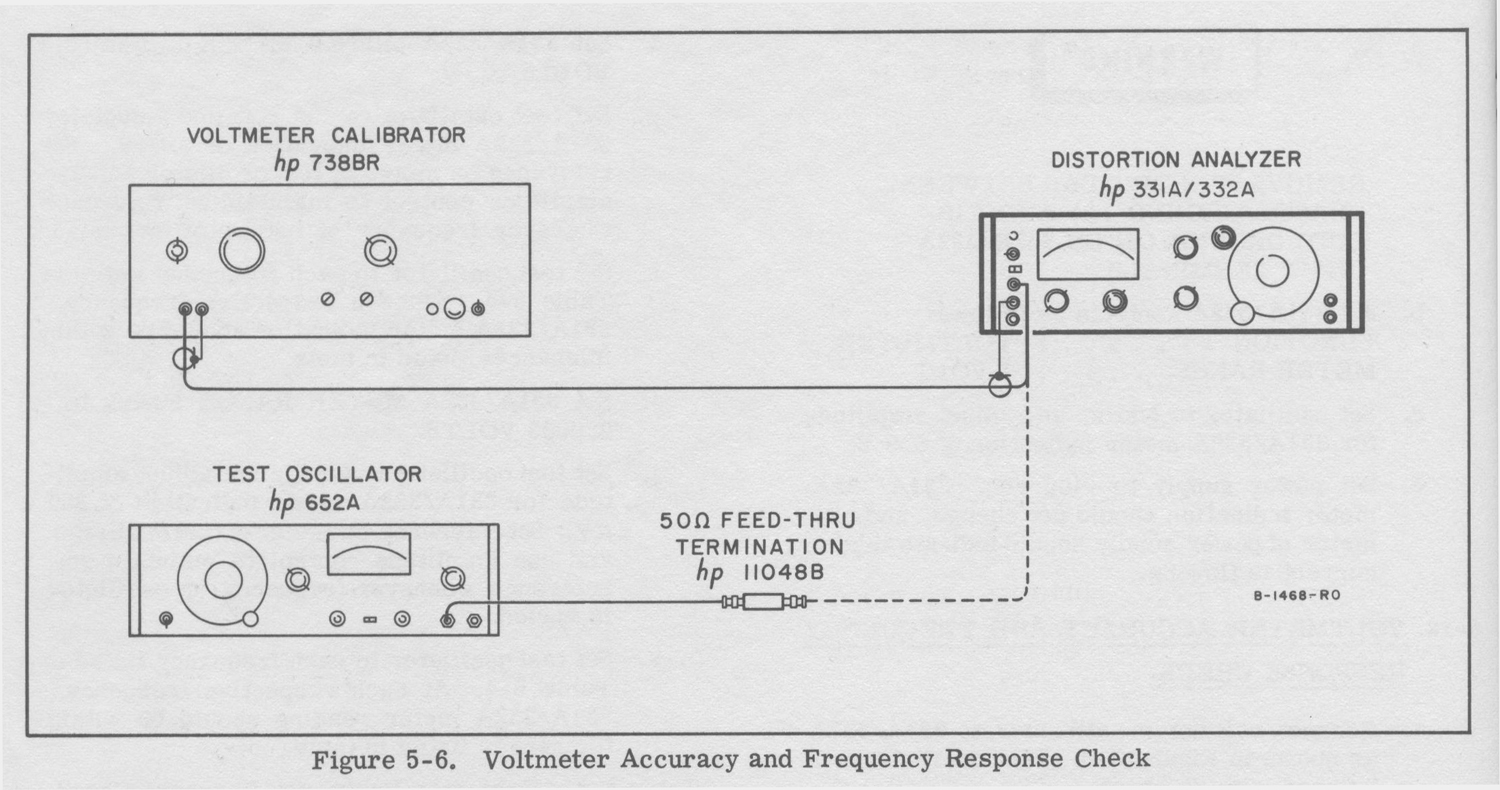
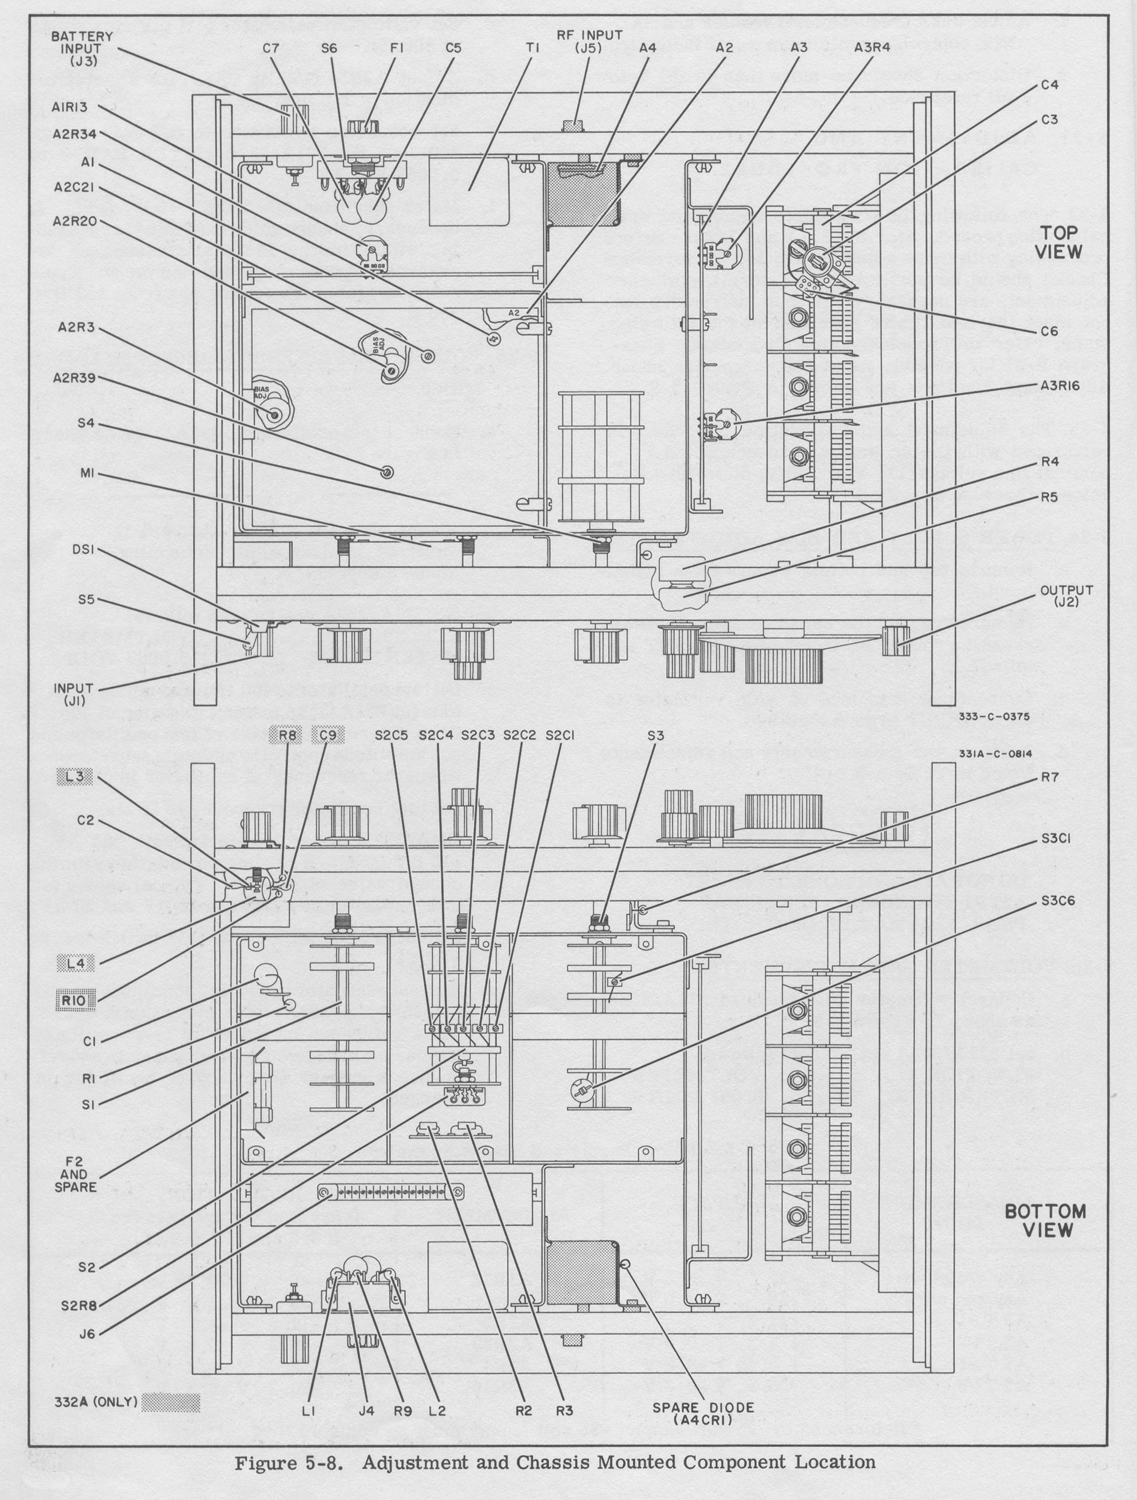
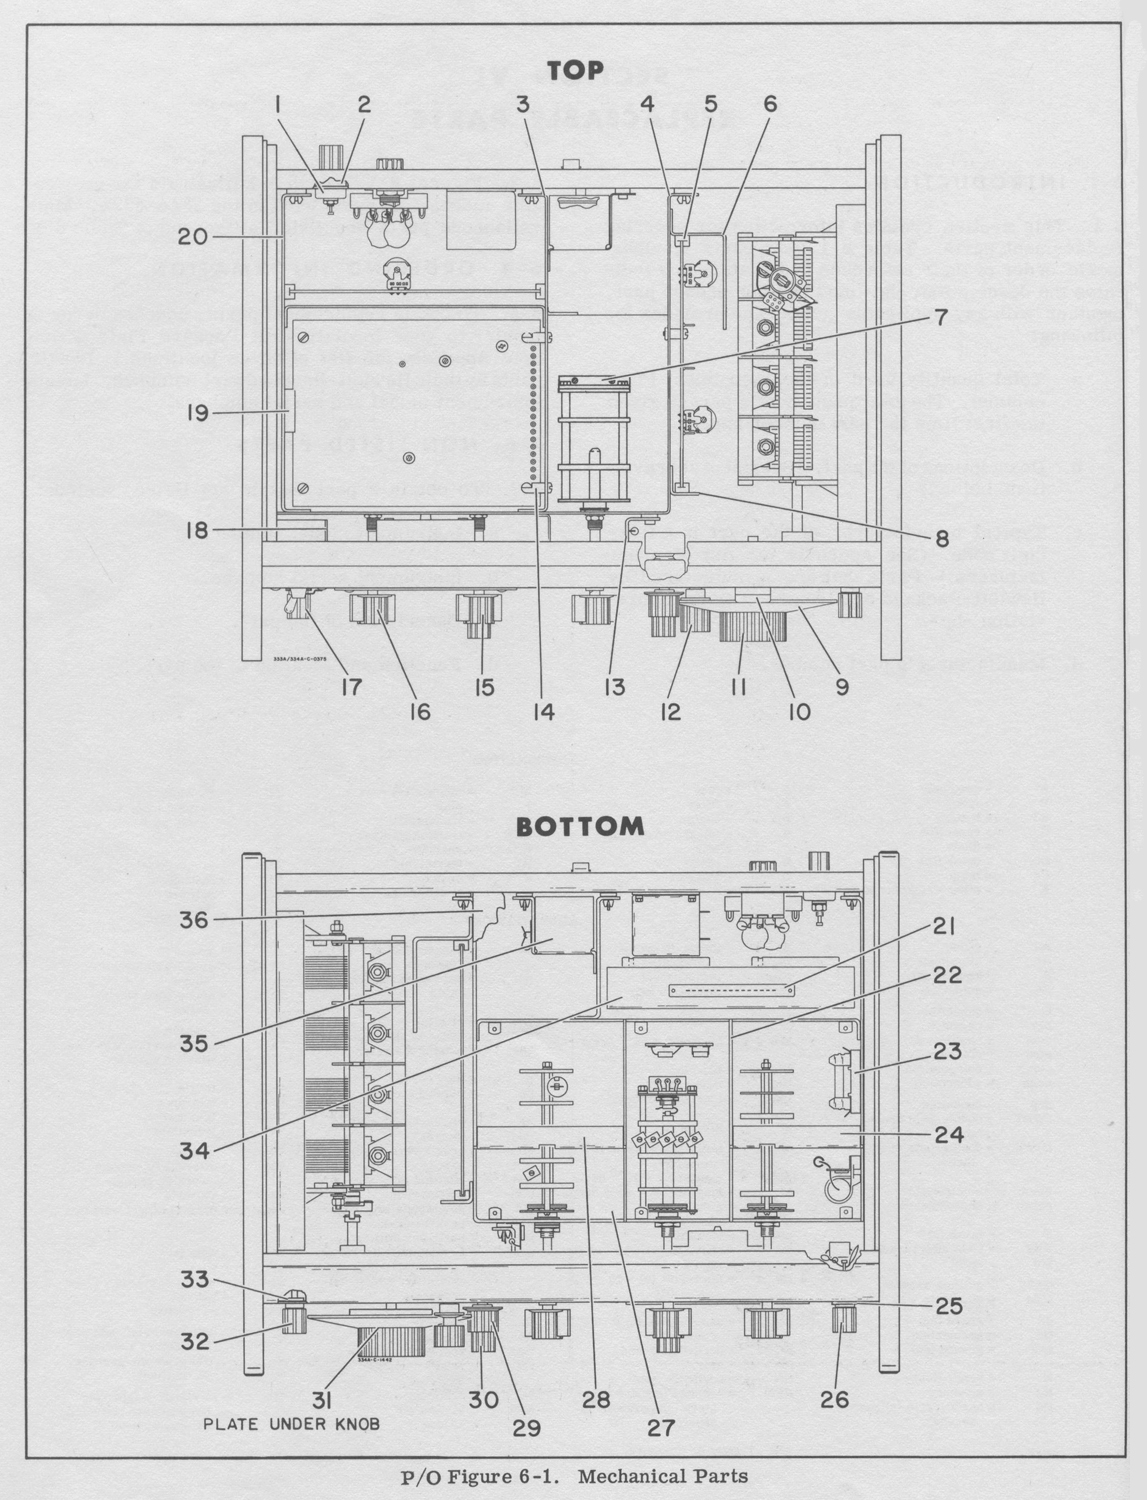
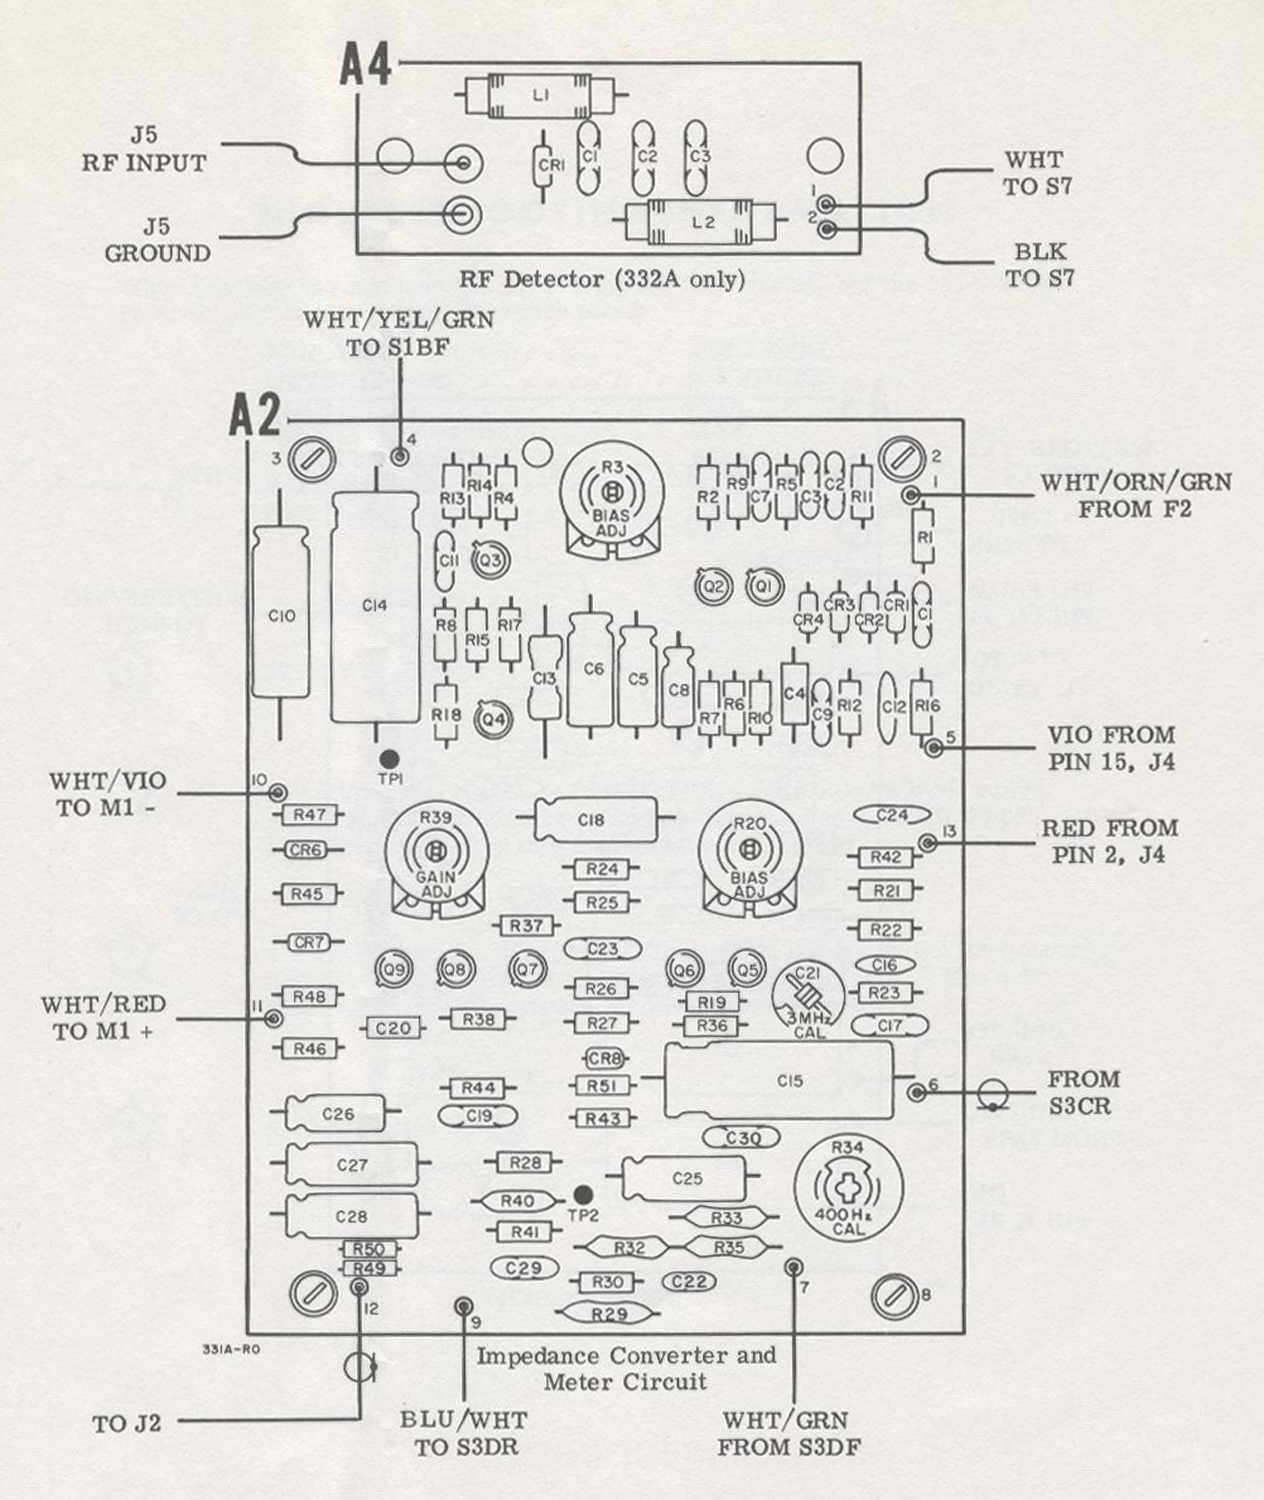
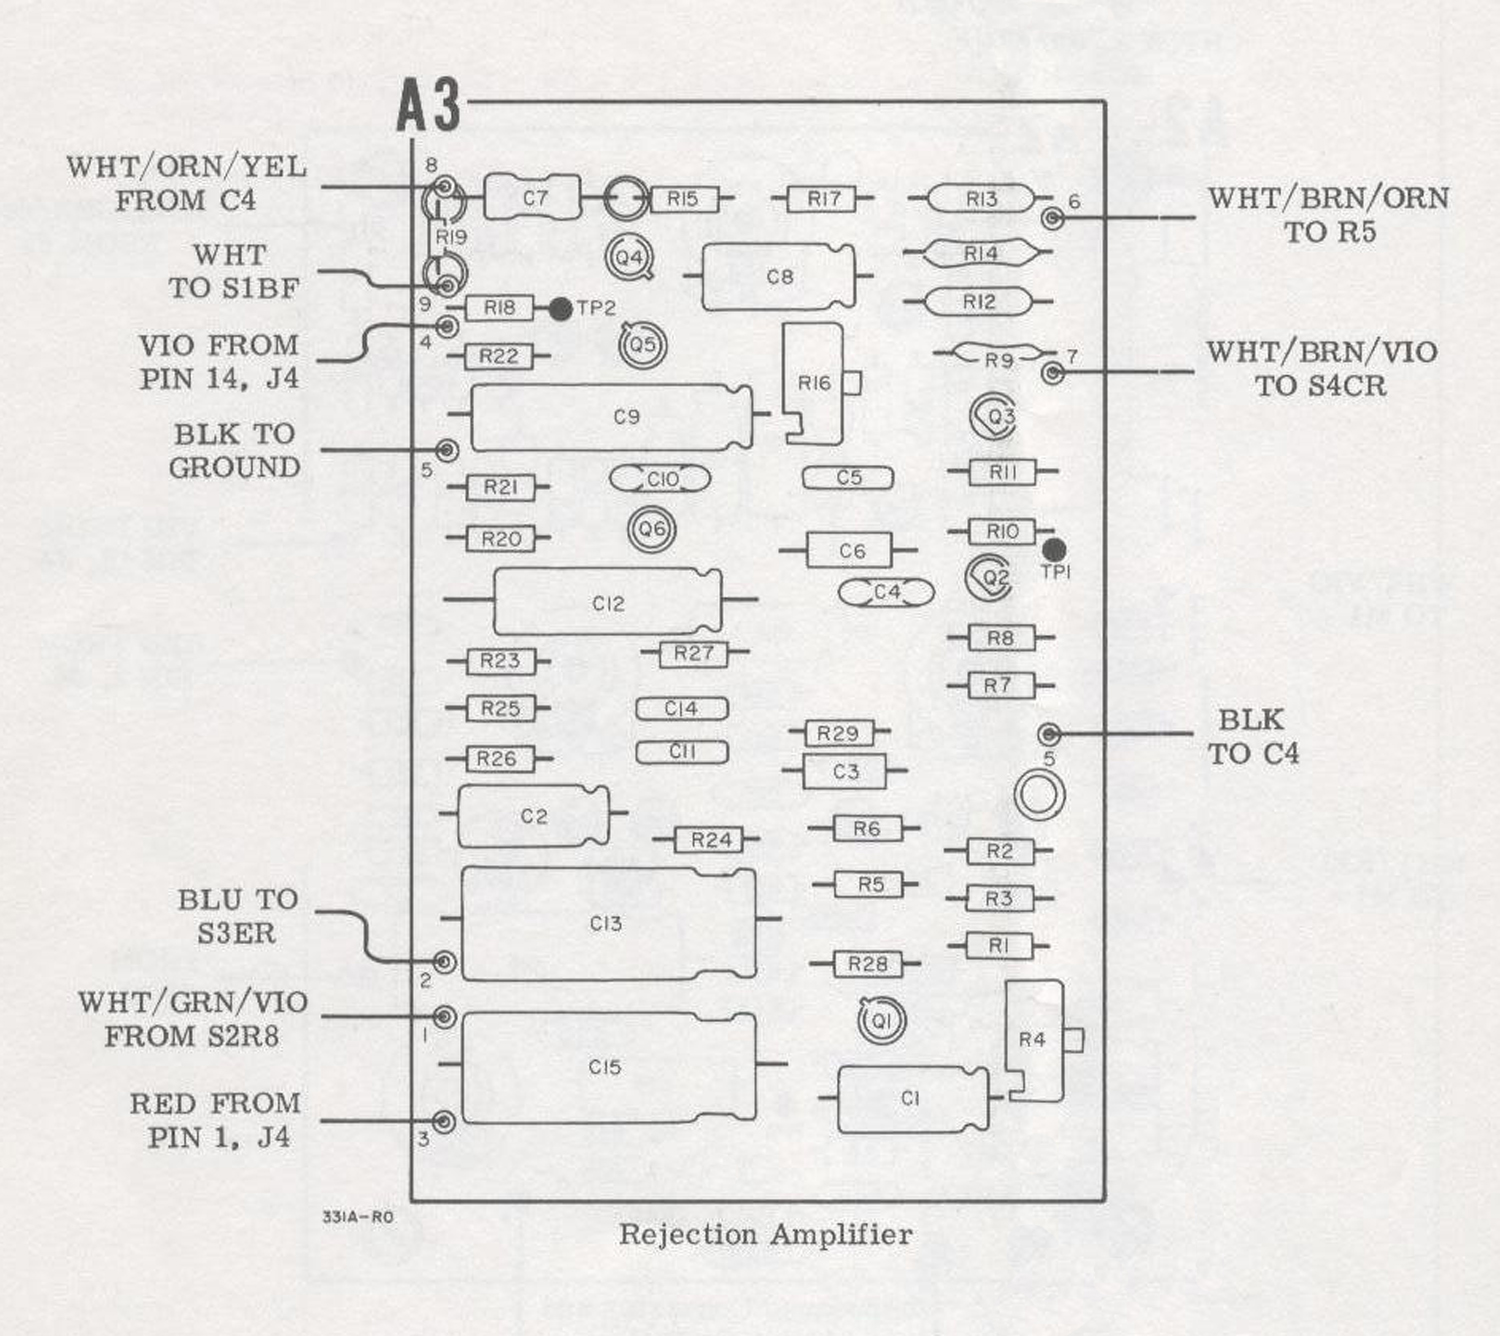
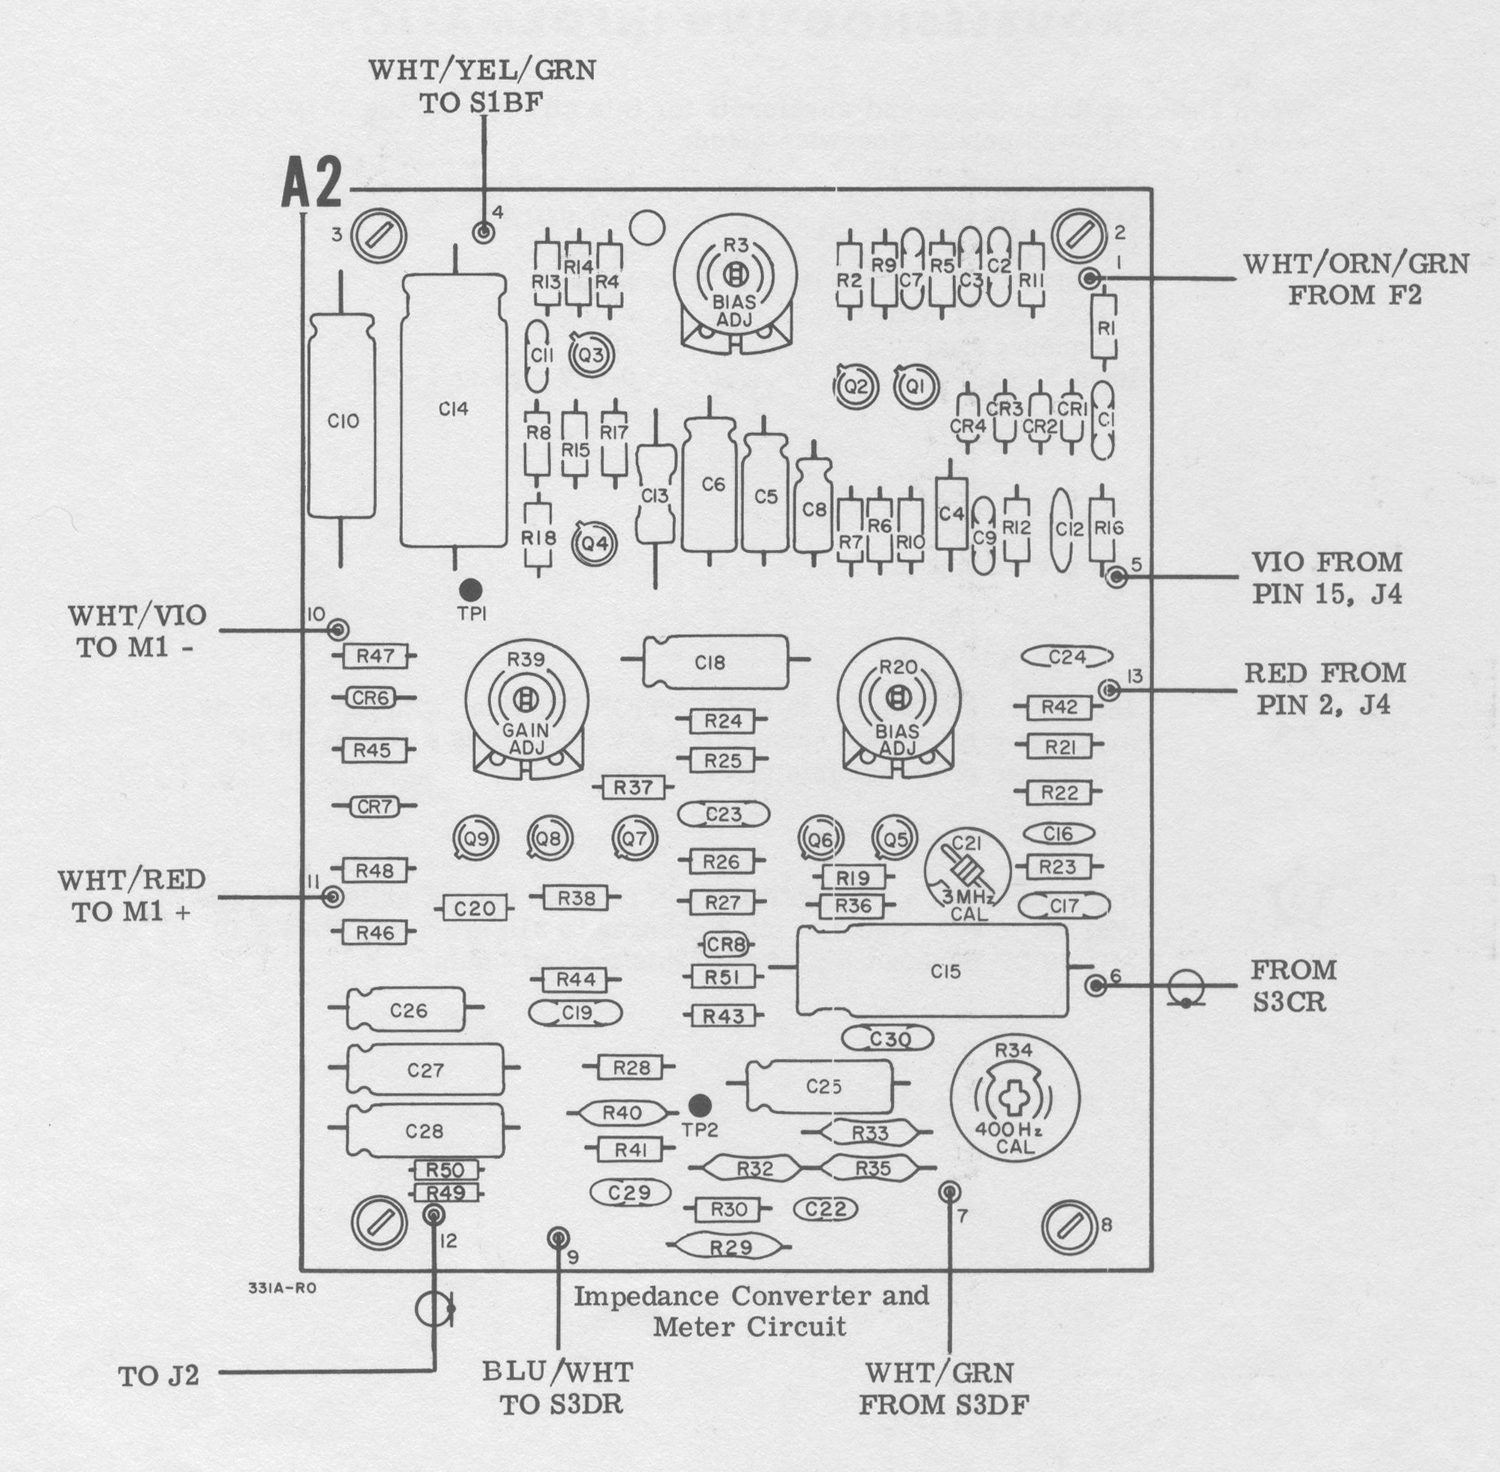
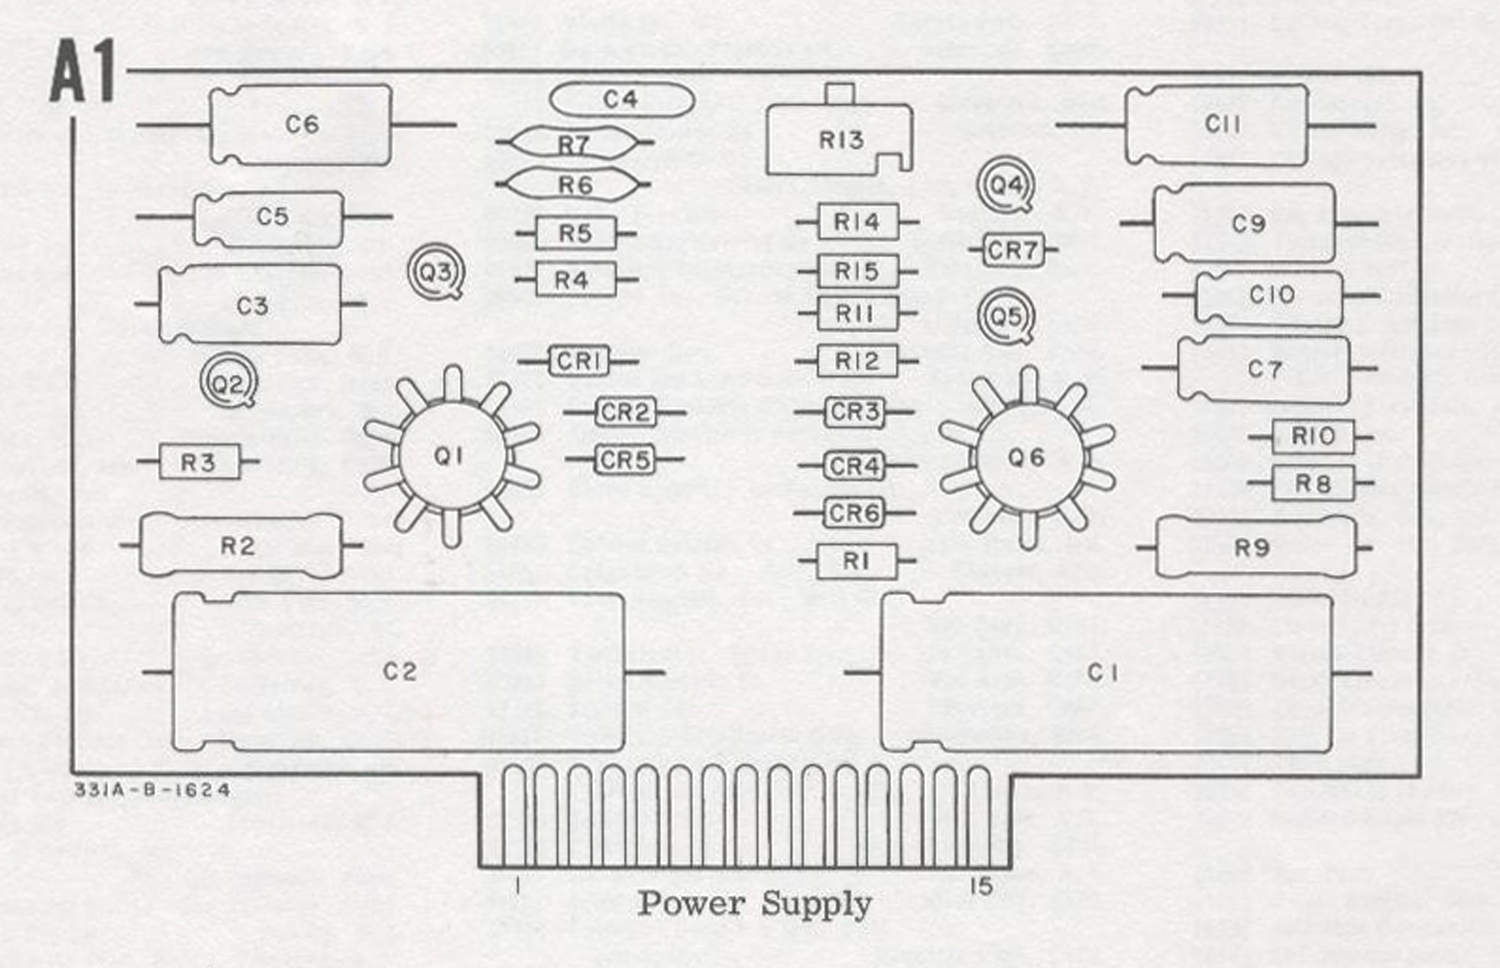
Nella Sezione Elettronica  è conservato il manuale di istruzioni: OPERATING AND SERVICE MANUAL DISTORTION ANALYZER 331A/332A HEWLETT hp PACKARD Printed JUNE, da cui sono tratte le seguenti figure. Questa scheda dunque è dedicata ai disegni che si trovano in alcune parti che abbiamo omesso, poiché riteniamo che possano comunque interessare alcuni visitatori.

Istruzioni  quasi identiche si possono trovare ad esempio all’indirizzo: https://www.artisantg.com/info/ATGx6v9r.pdf
Per consultare le altre tre parti scrivere “332A” su Cerca.
Foto di Claudio Profumieri, elaborazioni e ricerche di Fabio Panfili.
Per ingrandire le immagini cliccare su di esse col tasto destro del mouse e scegliere tra le opzioni.


Distortion Analyzer Hewlett Packard 332A matr. N° 930 – 96620 3ª parte

 Distortion Analyzer Hewlett Packard 332A matr. N° 930 – 96620. Terza parte.
 Nell’inventario particolare del Laboratorio di Elettronica  al n°  D 4826, in data  ottobre 1970, si legge:  “Distortion Analyzer  S/N 620 mod. 332A”.
Nell’HEWLETT·PACKARD Journal VOL. 17 NO. 8 APRIL 1966 vi è addirittura la presentazione del modello 334A che nell’amplificatore di eliminazione della tensione a frequenza fondamentale (rejection)  ha il ponte di Wien, come questo mod. 332A e come l’esemplare -hp- 330B che si può vedere in questo sito nella sezione Radiotecnica.
 Il testo è stato tratto dal manuale di istruzioni OPERATING AND SERVICE MANUAL DISTORTION ANALYZER 331A/332A HEWLETT hp PACKARD Printed JUNE 1969, conservato presso la Sezione Elettronica.
 Istruzioni  quasi identiche si possono trovare ad esempio all’indirizzo: https://www.artisantg.com/info/ATGx6v9r.pdF
Il testo prosegue dalla seconda parte.
§§§
« SECTION IV
THEORY OF OPERATION
4-I. OVERALL DESCRIPTION.
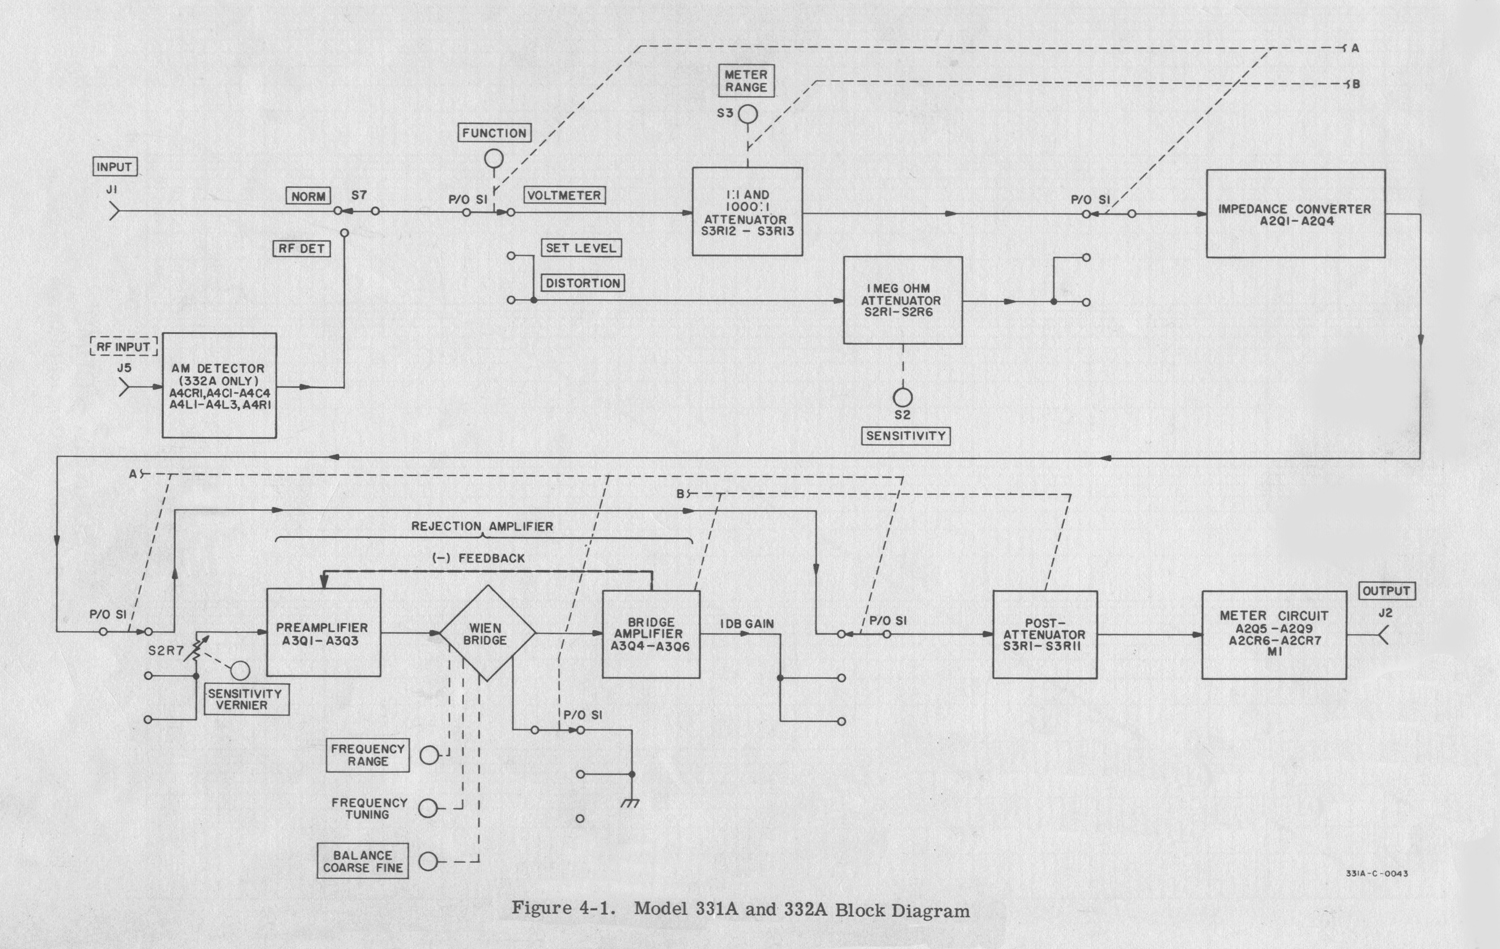
4-2. Models 331A and 332A Distortion Analyzers include an impedance converter circuit, a rejection  amplifier, a metering circuit, and a power supply circuit. In addition to these four circuits, the Model 332A contains an AM detector circuit. A block diagram of the instrument is shown in Figure 4-1.The impedance converter provides a low noise input circuit  with a high source impedance independent of  signal impedance placed at the input terminals. The rejection  amplifier rejects the fundamental frequency of an input signal and passes the remaining frequency components on to the metering circuit for measuring distortion. The metering circuit provides visual  indications of distortion and voltage levels on the front panel meter M1. The AM detector circuit (Model 332A only) detects the modulating signal from the RF carrier and filters any RF components from the modulating signal before it is applied to the impedance converter circuit.
4-3. BLOCK DIAGRAM DESCRIPTION.
(Refer to Figure 4-1.)
4-4. DISTORTION MEASURING OPERATION.
4-5. In the distortion measuring mode of operation, the input signal is applied to the impedance converter circuit (Assembly A2) through the FUNCTION selector, S1, and the one megohm attenuator. The attenuator is a voltage divider network which provides 50 dB attenuation  in 10 dB steps. The desired level of attenuation is selected by the SENSITIVITY selector , S2. The impedance  converter circuit provides an impedance conversion  and unity gain between the instrument input terminals and the input of the rejection amplifier.
4-6. The rejection amplifier consists of a preamplifier,  a Wien bridge, and a bridge amplifier circuit. The SENSITIVITY VERNIER control, at the input of the preamplifier circuit, provides a set level signal to obtain full scale readings on meter M1 for any input voltage level. With the FUNCTION selector in the SET LEVEL position , a ground is applied to the Wien bridge circuit to allow a signal reference level to be set up on the meter M1 in the metering circuit.
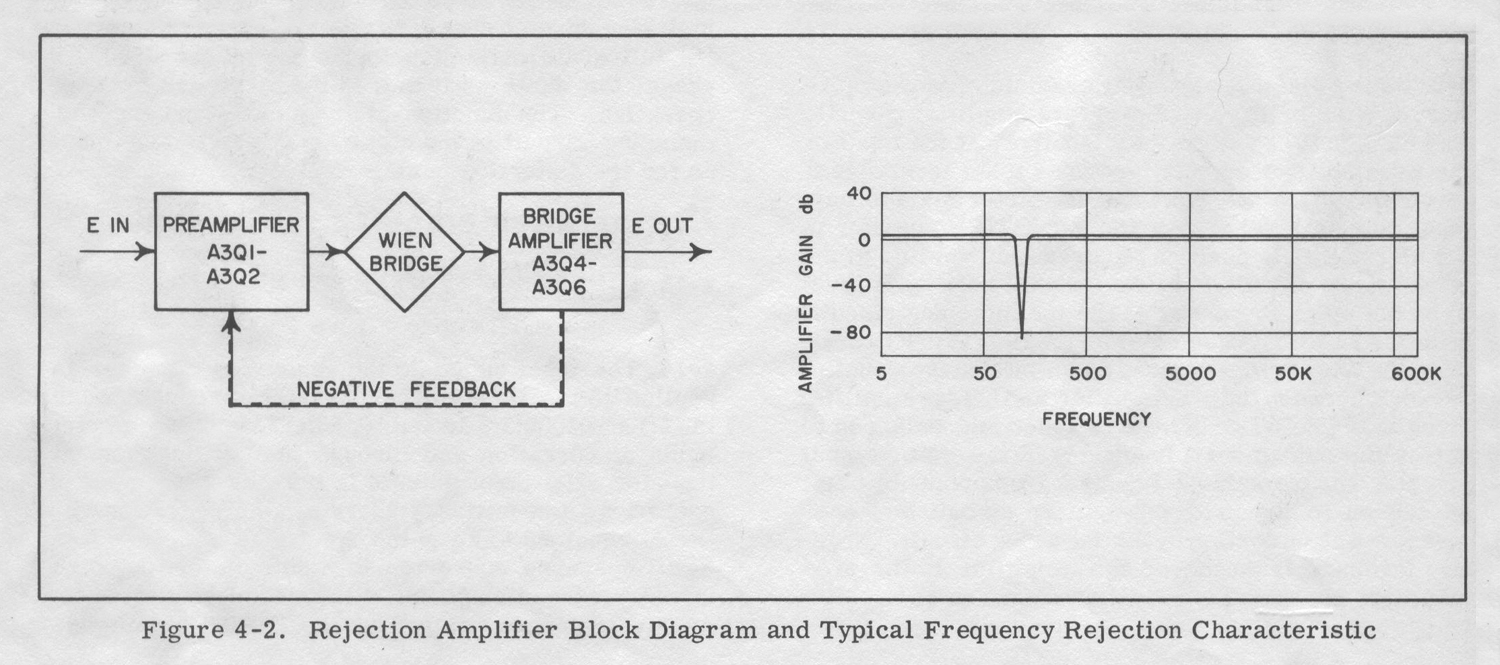
With the FUNCTION selector in the DISTORTION  position, the Wien bridge is used as an interstage coupling network between the preamplifier and bridge amplifier circuits. The Wien bridge is tuned and balanced to reject the fundamental frequency of the applied input signal. The remaining frequency components are passed on to the bridge amplifier circuit and are measured as distortion by the metering circuit. Negative  feedback from the bridge amplifier to the preamplifier narrows the rejection response of the Wien bridge circuit.
4-7. The output of the rejection amplifier (1 dB gain) is applied to the metering circuit through the post-attenuator. The post-attenuator is used to limit the input signal level applied to the metering circuit to 1 mV for full scale deflection. The metering circuit sensitivity is increased to 300  μV for full scale deflection on the 0.0003 V range. The metering circuit provides a visual indication of the distortion level in the input signal. In addition to the visual indication provided by the meter M1, the OUTPUT terminals provide a means of monitoring the distortion with an oscilloscope , a true rms voltmeter, or a wave analyzer.
4 -8 . DISTORTION MEASUREMENT IN AM CARRIERS
4-9. The Model 332A Distortion Analyzer contains an AM detector circuit for measuring envelope distortion in AM carriers. The input signal is applied to the input of the AM detector circuit where the modulating signal is recovered from the RF carrier. The signal is then applied to the impedance converter circuit through the one megohm attenuator. The signal then goes through the same circuits previously described in the distortion measuring operation.
4-10. VOLTMETER OPERATION.
4-11. In the voltmeter mode of operation, the input signal is applied to the impedance converter circuit through the 1:1 and 1000:1 attenuator. The 1:1 attenuation ratio is used in the 0.0003 to 0. 3 VOLTS positions of the METER RANGE switch S3, and the 1000:1 attenuation ratio is used in the 1 to 300 VOLTS positions. With the FUNCTION selector in the VOLTMETER  position, the output of the impedance converter bypasses the rejection amplifier and is applied to the metering circuit through the post-attenuator and METER RANGE selector. In the voltmeter mode, metering circuit sensitivity is increased from 1 mV for full scale deflection to 300 μV on the 0.0003 V range, the same as it was in the distortion mode of operation. The function of the post-attenuator and metering circuit is the same for the voltmeter mode as for the distortion mode.
4-12. DETAILED CIRCUIT DESCRIPTION.
4-13. IMPEDANCE CONVERTER CIRCUIT.
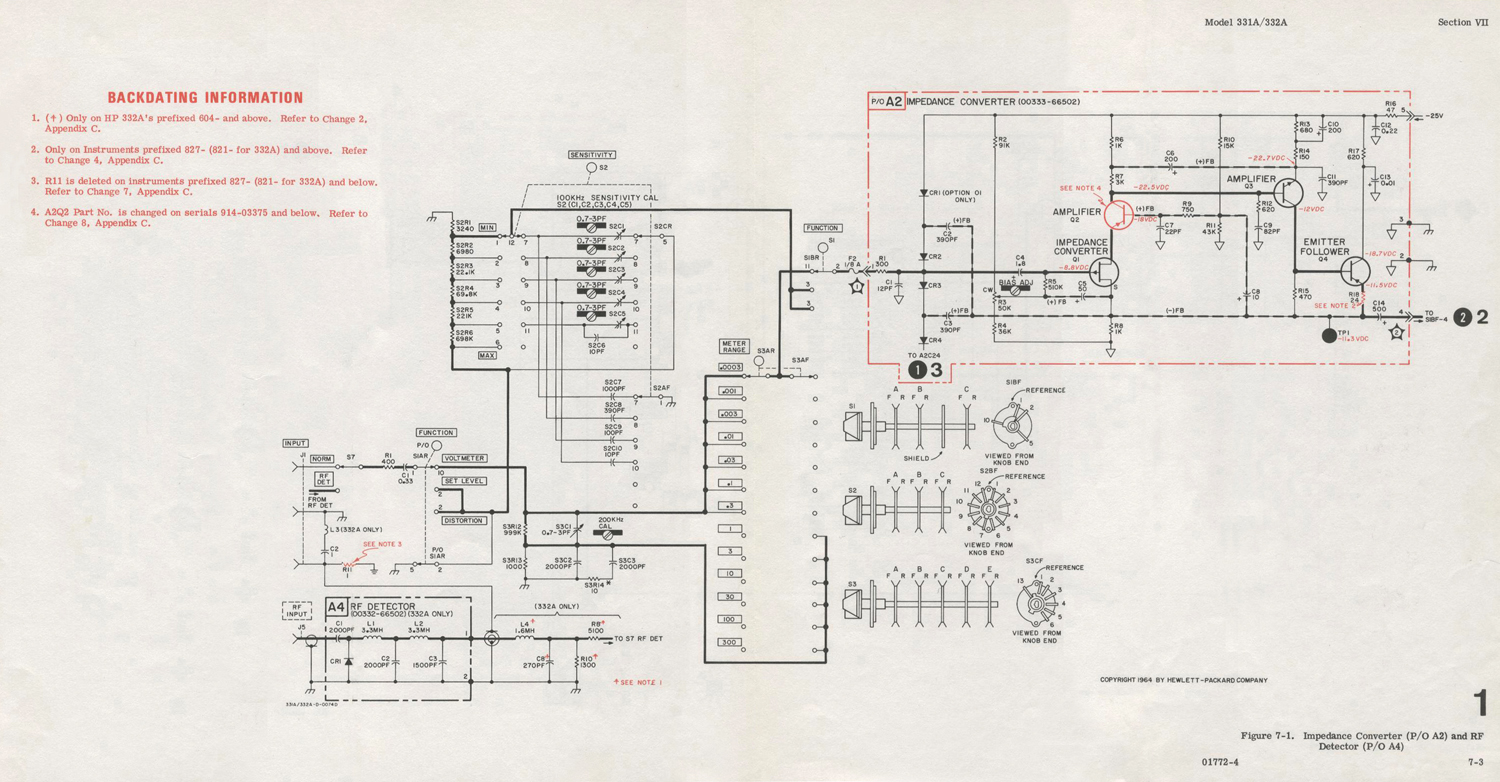
(Refer to Figure 7-1.)

4-14. The input signal to the distortion analyzer is applied to the impedance converter circuit through the 1:1 and 1000:1 attenuator, S3R12, in the voltmeter mode of operation and through the one megohm  attenuator S2R1 through S2R6 in the distortion mode of operation. Capacitive dividers act in conjunction with the attenuators to keep the frequency response flat.
The impedance converter is a low distortion, high input impedance amplifier with gain independent of the source impedance placed at the INPUT terminals.
4-15. Instrument induced distortion of the signal being measured is prevented by keeping the input impedance and the gain of the impedance converter linear. The input impedance is made linear by “boot strapping” the protection diodes A2CR2 and A2CR3 and the gate to drain capacitance of A2Q1 with local positive feedback.  By keeping the input impedance linear, signals having a high source impedance can be measured  accurately and the SENSITIVITY selector S2 can be used in the high impedance positions without distorting the input signal. In addition to having a high input  impedance, the impedance converter serves as a linear amplifier. The open loop gain of the circuit is  increased by “boot strapping” the collector load  impedances of A2Q2 and A2Q3 with local positive feedback. Overall negative feedback from the emitter circuit of A2Q4 to the source of A2Q1 results in unity
gain from the impedance converter circuit and keeps the distortion generated by the circuit well within the specifications listed in Table 1-1.
4 -16. The bias points of the transistors in the impedance converter circuit have been selected for optimum  distortion performance. The voltage at A2TP1 is set for optimum distortion performance for each individual instrument and should not be changed from the set value unless the field effect transistor A2Q1 is  replaced. The field effect transistor used in the  impedance converter provides extremely low noise  performance independent of the signal source impedance, and aids in producing the high impedance input to the impedance converter circuit.
4-17. REJECTION AMPLIFIER CIRCUIT.
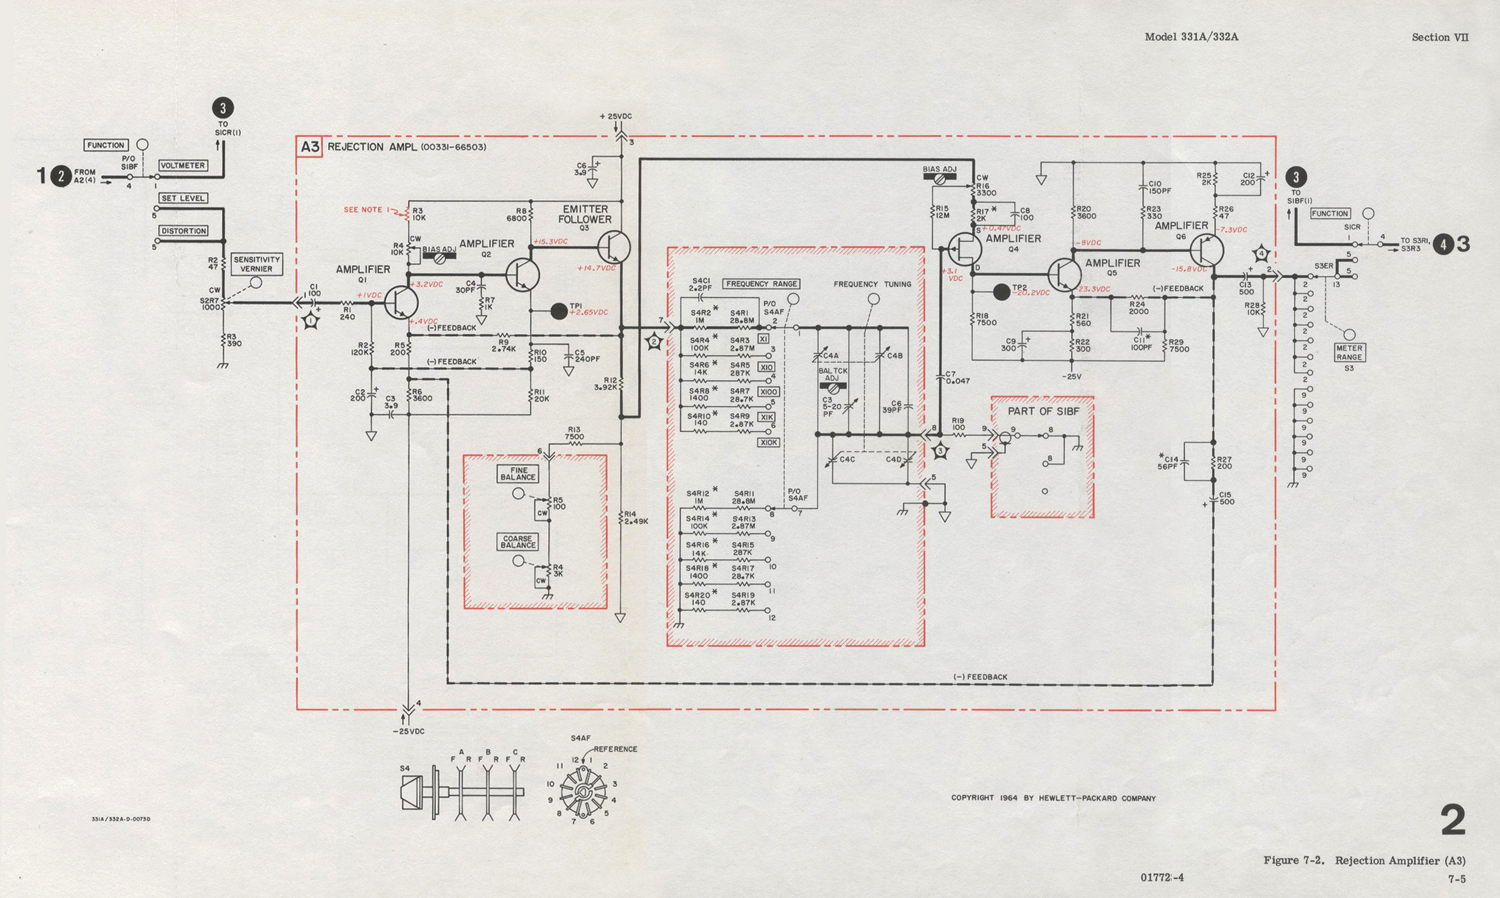
 (Refer to Figure 7-2.)4-18. The rejection amplifier circuit consists of the preamplifier, A3Q1 through A3Q3, the Wien bridge circuit, and the bridge amplifier, A3Q4 through A3Q6. A simplified block diagram of the rejection amplifier with the typical frequency rejection characteristic is shown in Figure 4-2.4-19. PREAMPLIFIER CIRCUIT.
4-20. The signal from the impedance converter circuit  is applied to the preamplifier circuit which is operational in the SET LEVEL and DISTORTION modes of operation. Negative feedback from the junction of A3R1O and A3R11 is applied to the junction of A3R2 and A3C2 to establish the operating point for A3Q1. Negative feedback from the emitter of A3Q3 is applied to the emitter of A3Q1 to stabilize the whole preamplifier circuit. The preamplifier circuit, like the  impedance converter circuit, is designed for high open loop gain to insure maximum distortion performance.
4-21. WIEN BRIDGE CIRCUIT.
4-22. The Wien bridge circuits used, in the distortion mode of operation, as a rejection filter for the  fundamental frequency of the input signal. With the FUNCTION selector S1 in the DISTORTION position, the Wien bridge is connected as an interstage coupling network between the preamplifier circuit and the bridge amplifier circuit.
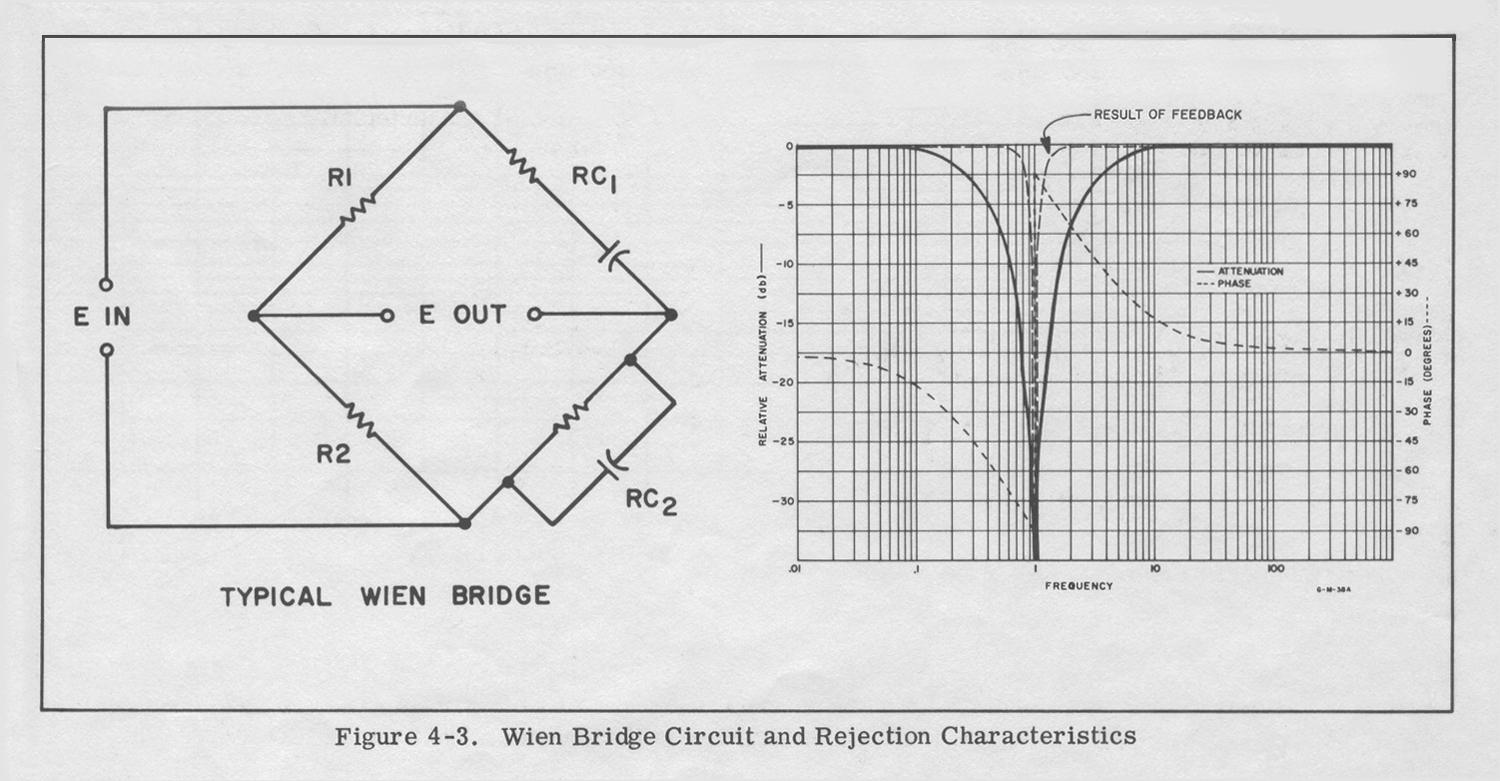
4-23. The bridge is tuned to the fundamental frequency of the input signal by varying the frequency tuning capacitors, C4A through C4D, after the FREQUENCY RANGE selector S4 is set for the applicable frequency range. The bridge circuit is brought into balance by adjusting the COARSE BALANCE control R4 and the FINE BALANCE control R5. When the bridge circuit is tuned and balanced, the voltage and phase of the fundamental, which appears at junction of the series reactive arm (S4R1-S4R1O and C4A/B) and the shunt reactive arm (S4R11-S4R2O and C4C/D) , is the same as at- the midpoint of the resistive branch (A3R12 and A3R14). When these two voltages are equal and are in phase, no output signal will appear at the drain of the field effect transistor A3Q4. For frequencies other than the fundamental, the reactive branch of the Wien bridge offers various degrees of attenuation and phase shift. The difference voltage between the  reactive branch and resistive branch is amplified by A3Q4. Figure 4-3 illustrates a typical Wien bridge circuit and the rejection characteristic for this circuit. The Wien bridge circuit is designed to cover a continuous frequency range of 12 to 1 to insure an overlap of the coarse tuning range. Coarse tuning ranges are selected by the FREQUENCY RANGE selector S4 which changes the bridge circuit constants in five decade steps.
4 -24. When the FUNCTION selector is set to the  VOLTMETER or SET LEVEL position, the junction of the series and shunt reactive arm of the Wien bridge is connected to circuit ground through SIBF, which  disables the frequency rejection characteristic of the bridge circuit. With the bridge circuit disabled, the rejection amplifier circuit provides one dB of gain for the fundamental frequency, the harmonics, and for the residuals to establish the set level reference in the SET LEVEL mode of operation.
4-25. BRIDGE AMPLIFIER CIRCUIT.
4-26. The bridge amplifier circuit consists of three stages of amplification, A3Q4 through A3Q6. The first stage of amplification, A3Q4, is a field effect transistor which amplifies the difference signal between the gate and the source. The field effect  transistor is selected for maximum noise performance with the high impedances of the Wien bridge circuit. The signal from the drain is applied to the two stage feedback amplifier A3Q5 and A3Q6. The bias potential  at A3TP2 is set for maximum distortion performance for each individual instrument and should not be changed from the set value unless the field effect transistor A3Q4 is replaced.
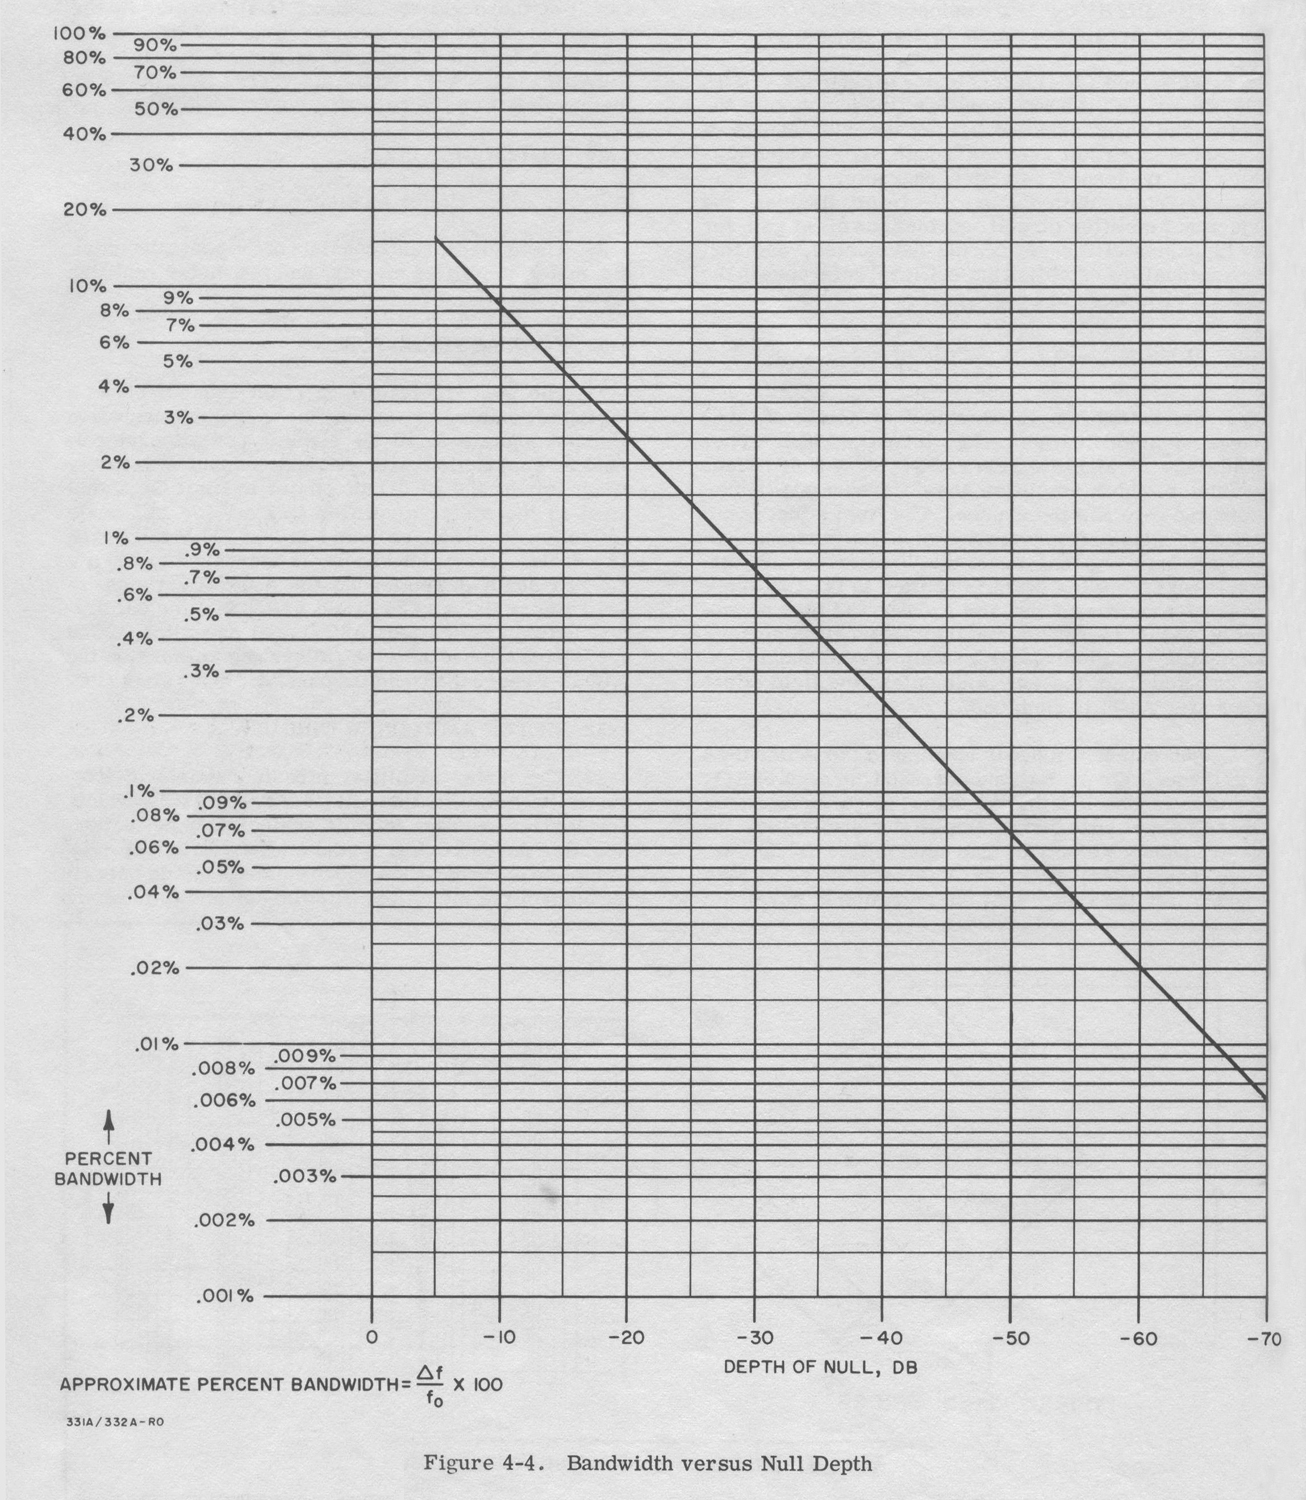
4-27. The output of A3Q6 is coupled to the meter  circuit through the post attenuator S3R1 through S3R11. Negative feedback from the output of the bridge amplifier is applied to the preamplifier circuit to narrow the frequency rejection characteristic. It can be noted from the rejection characteristic (refer to  Figure 4-3) for the bridge that the rejection of harmonic voltages is not constant. Typically the second  harmonic is attenuated several dB more than the third harmonic, and the third more than the fourth. The result of the negative feedback is illustrated by the, rejection characteristic shown in dashed lines on the amplitude and phase characteristic of Figure 4-3. Refer to Figure 4-4, Bandwidth versus Null Depth for further detail on the rejection characteristic.

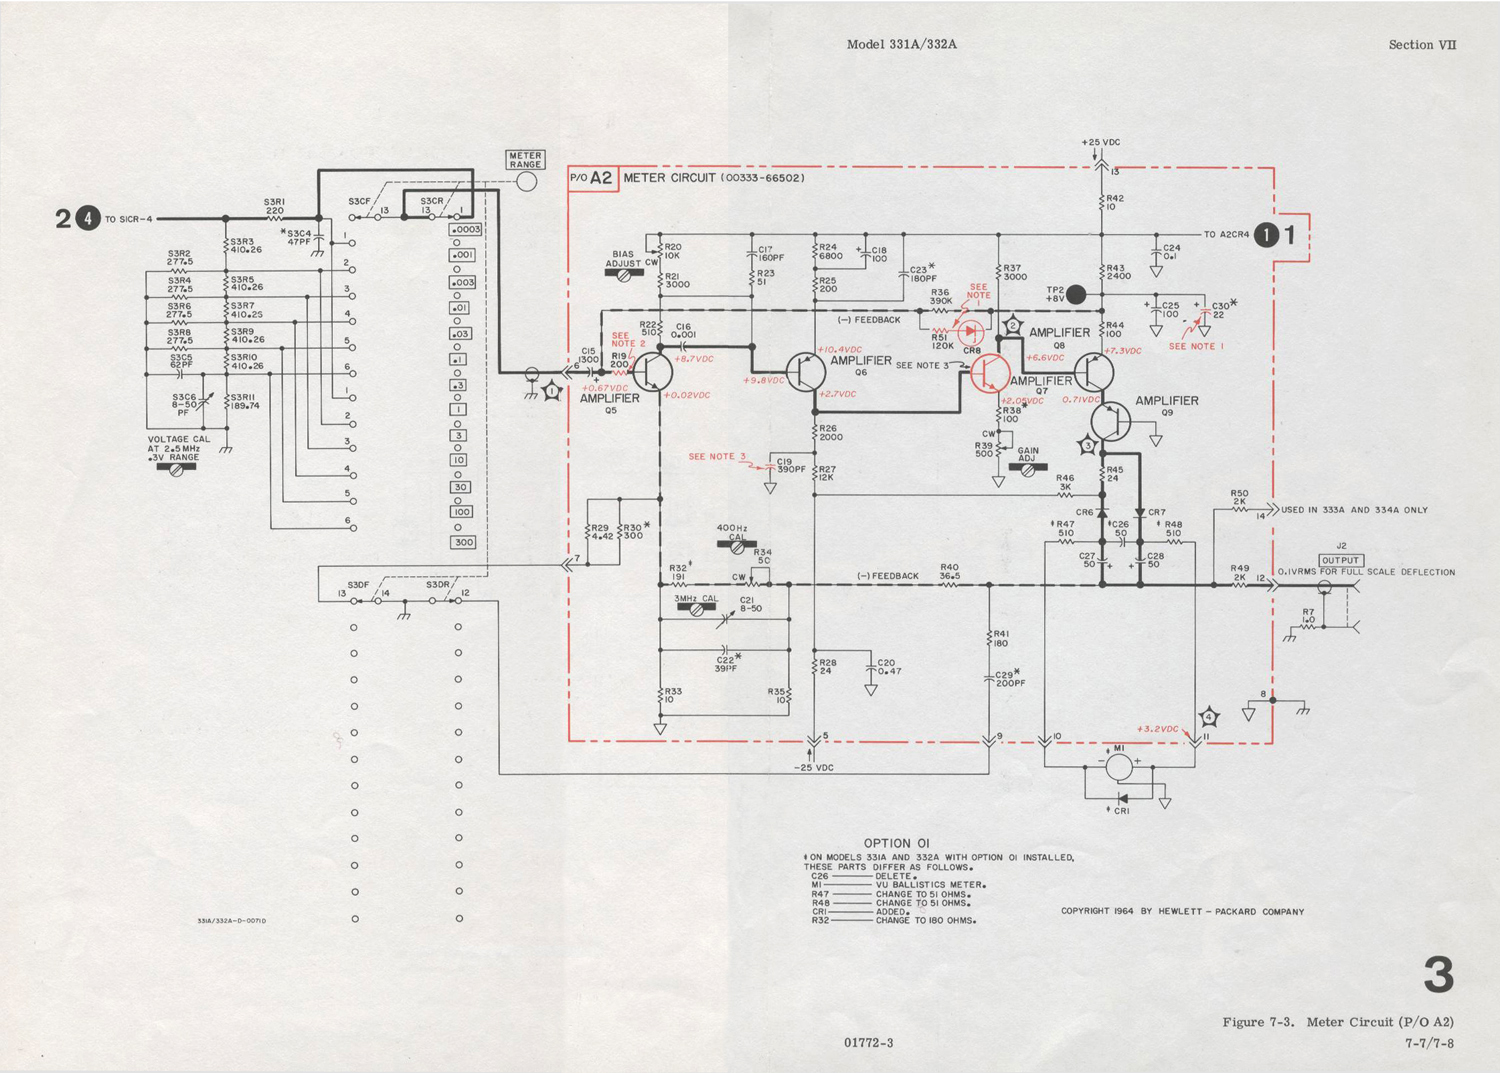
4-23. METER CIRCUIT.
(Refer to Figure 7-3.)

4-29 . The meter circuit consists of the post attenuator, the meter amplifier circuit, and the meter rectifier circuit.
4-30. POST ATTENUATOR.
4-31. The post attenuator, S3R1 through S3R11, is a series of resistor networks which provide attenuation of input signals in 10 dB steps. The attenuator is used in conjunction with either the input sensitivity attenuator or the 1000:1 attenuator to limit the signal level to the meter amplifier to 1 mV for full scale deflection on all ranges from 1 mV to 300 V full scale. The meter circuit sensitivity is increased to 300 μV for full scale deflection on the 0.0003 V range by switching resistors A2R29 and A2R30 into the calibration network. Resistor A2R41 and capacitor A2C29 are also switched into the calibration network on the 0.0003 V range to extend the passband of the amplifier.
4-32. METER AMPLIFIER CIRCUIT.
4-33. The meter amplifier circuit consists of five stages of amplification, A2Q5 through A2Q9, which develop the current for full scale meter deflection. Negative dc feedback from the emitter circuit of A2Q8 is applied to the base of A2Q5 to stabilize the dc operating  point of the meter amplifier circuit and to minimize the tendency for dc drift due to ambient temperature changes. Negative ac feedback is applied from the collector circuit of A2Q9 to the emitter circuit of A2Q5. This feedback is used to insure a flat frequency response, to improve linearity, and to reduce the effect of variation of transistor parameters with environmental changes. In this manner, the calibration  of the instrument is made dependent on high quality passive components.
4-34. METER RECTIFIER CIRCUIT.

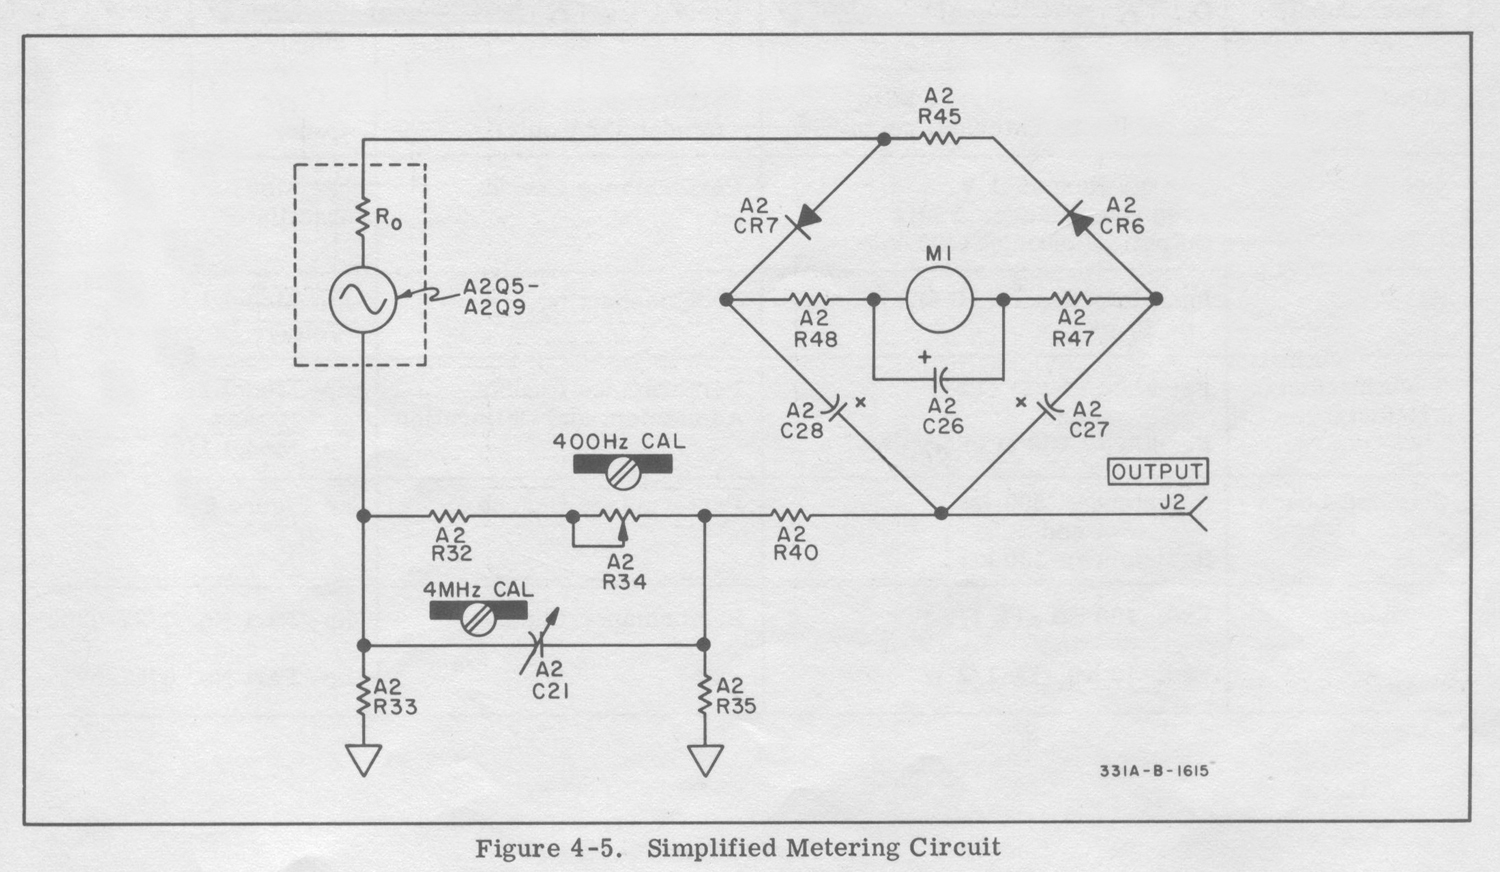
4-35. The meter rectifier is connected in abridge type of configuration with a diode in each upper arm and a dc milliammeter connected across the midpoints of the bridge. The simplified meter rectifier is  illustrated in Figure 4-5. The generator represented by A2Q5 through A2Q9 , with the internal impedance R0, provides the meter M1 with current for full scale deflection and develops a voltage across the calibration network which closes the ac feedback loop. Capacitors A2C27 and A2C28 are used as coupling capacitors for the ac feedback loop and the output signal to the OUTPUT connector. The mechanical inertia of the meter prevents the meter from responding to individual current pulses; therefore the meter pointer reading corresponds to the average value of the  current pulses rather than the peak value. The meter calibration is to the rms value of a sine wave.  Resistor A2R45 impresses a fixed bias across diodes A2CR6 and A2CR7 (biasing them close to the barrier voltage) to make the meter circuit response linear to large variations in signal amplitude. The linearity of this type of circuit is also increased by enclosing the meter circuit in the overall feedback loop.
4-36. POWER SUPPLY CIRCUIT.
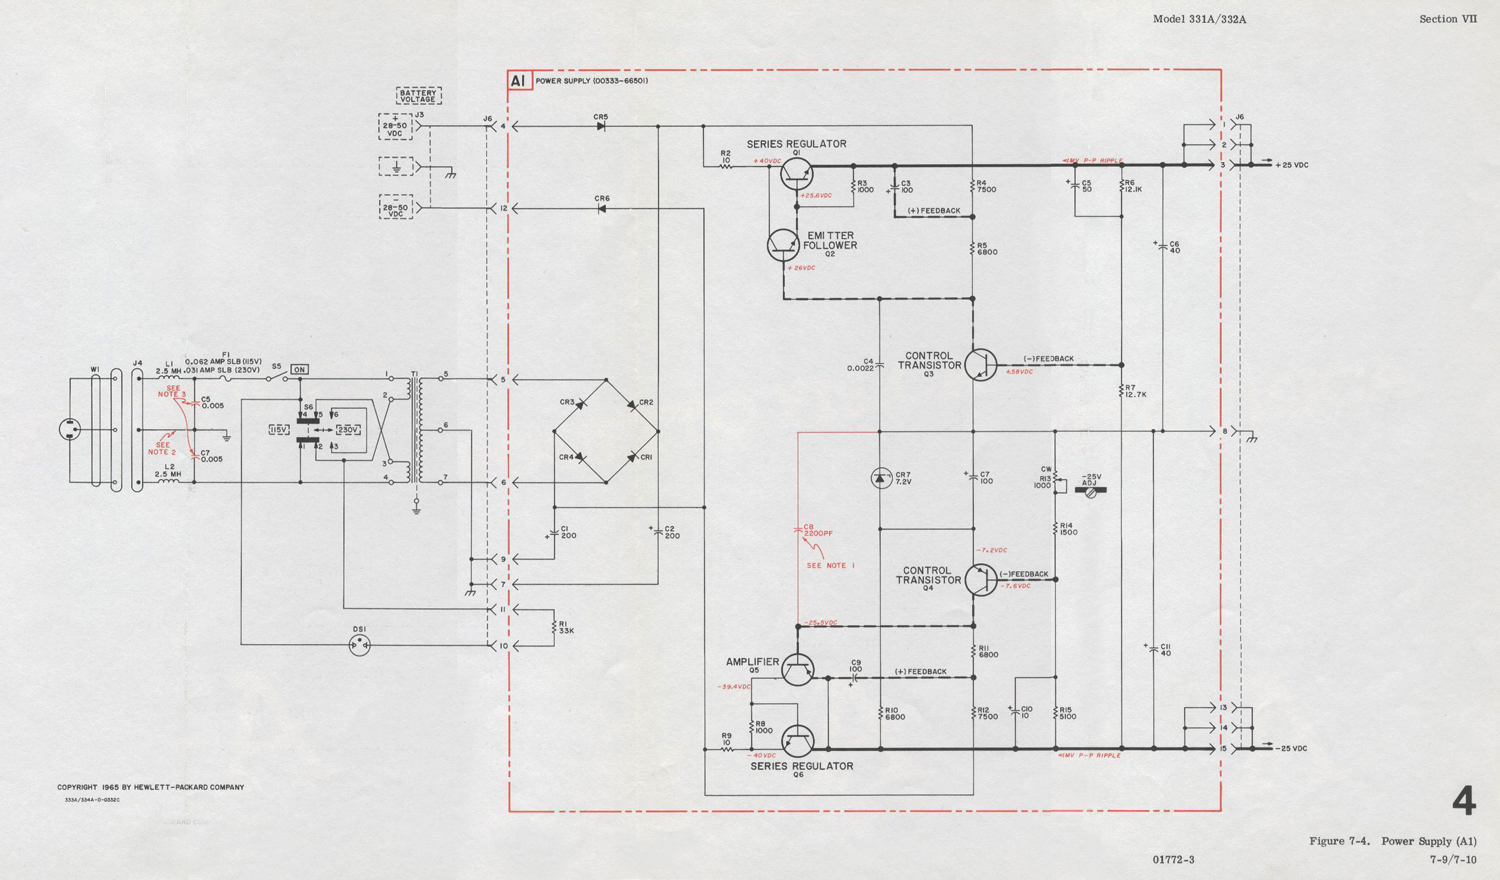
(Refer to Figure 7-4.)

4-37. The power supply circuit consists of a +25 volt series regulated supply and a -25 volt series regulated supply which is the reference supply for the +25 volt supply.
4-38. The -25 volt regulated supply is of the conventional  series regulator type. The amplifier A1Q5 is used to increase the loop gain of the circuit, thus improving voltage regulation. The positive feedback applied to the junction of A1R11 and A1R12 is used to further improve the line frequency suppression of the circuit.
4-39. The +25 volt regulated supply is of the conventional  series regulator type and operates the same as the -25 volt regulated supply.
4-40. Diodes A1CR5 and A1CR6 are coupling and  protection diodes for external battery supplies. The diodes protect the series regulator circuits from application of incorrect polarity at the battery input terminals. The diodes also protect external batteries from being charged in the wrong direction when the ac power is being used with batteries connected- to the battery terminals.
4-41. RF DETECTOR CIRCUIT (332A ONLY1.
(Refer to Figure 7-1.)
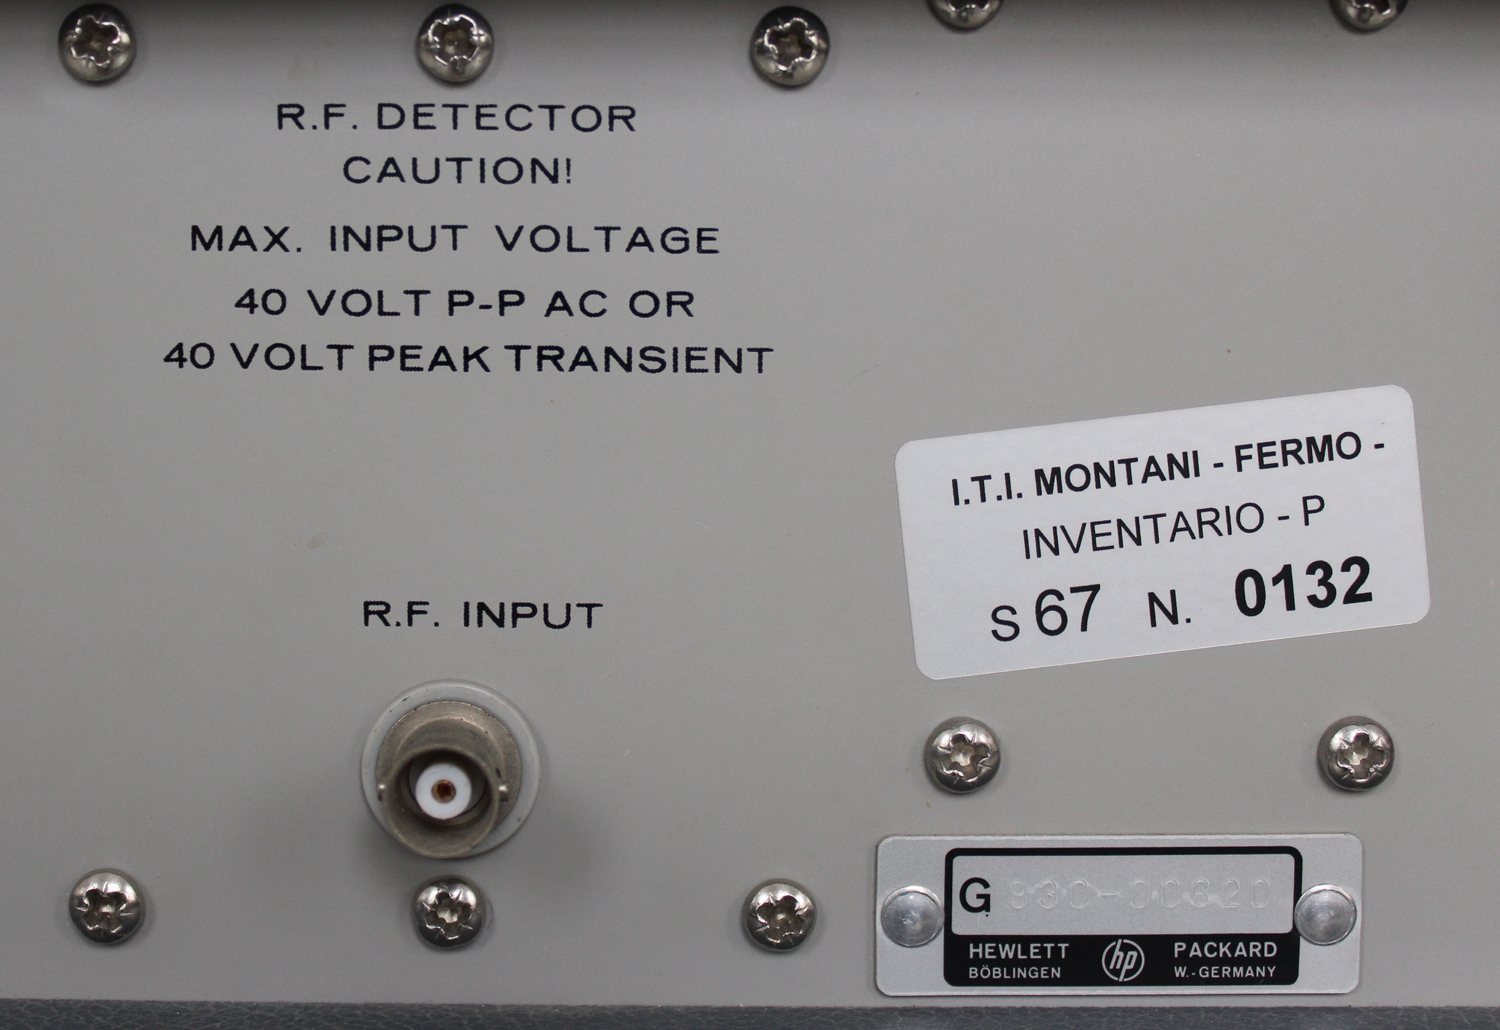
4-42. The RF detector circuit consists of a rectifier, A4CR1, and filter circuit. The RF signal is applied to the circuit through the RF INPUT connector on the rear panel. The rectifier diode A4CR1 recovers the modulating signal from the RF carrier and the filter circuit removes any RF components before the signal is applied to the impedance converter circuit through the NORM-RF DET switch S7».
§§§
Abbiamo omesso la sezione IV Maintenance.
Per consultare le altre tre parti scrivere “332A” su Cerca.
Foto di Claudio Profumieri, elaborazioni e ricerche di Fabio Panfili.
Per ingrandire le immagini cliccare su di esse col tasto destro del mouse e scegliere tra le opzioni.



Distortion Analyzer Hewlett Packard 332A matr. N° 930 – 96620 2ª parte

Distortion Analyzer Hewlett Packard 332A matr. N° 930 – 96620. Seconda parte. 
Nell’inventario particolare del Laboratorio di Elettronica  al n° D 4826, in data  ottobre 1970, si legge:  “Distortion Analyzer  S/N 620 mod. 332A”.
Nell’HEWLETT·PACKARD Journal VOL. 17 NO. 8 APRIL 1966 vi è addirittura la presentazione del modello 334A che nell’amplificatore di eliminazione della tensione a frequenza fondamentale (rejection)  ha il ponte di Wien, come questo mod. 332A e come l’esemplare -hp- 330B che si può vedere in questo sito nella sezione Radiotecnica.
Le figure che seguono sono state tratte dal manuale di istruzioni OPERATING AND SERVICE MANUAL DISTORTION ANALYZER 331A/332A HEWLETT hp PACKARD Printed JUNE 1969, conservato presso la Sezione Elettronica.  Per vedere le altre tre parti scrivere “332A” su Cerca.
 Istruzioni  quasi identiche si possono trovare ad esempio all’indirizzo: https://www.artisantg.com/info/ATGx6v9r.pdf
§§§
«SECTION III
OPERATING INSTRUCTIONS
3-1. INTRODUCTION.
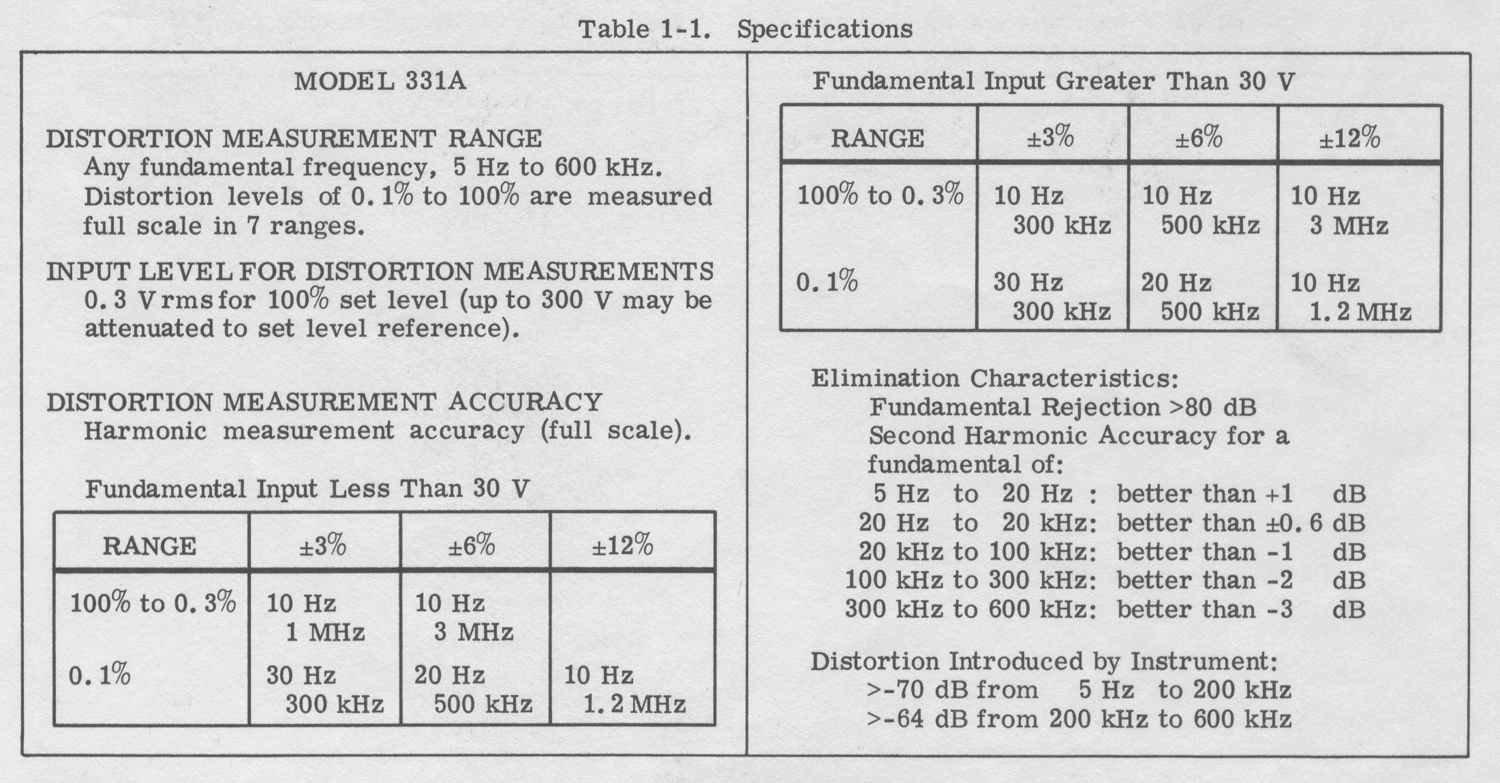
3-2. The Models 331A and 332A Distortion Analyzers measure total harmonic distortion of fundamental frequencies from 5 Hz to 600 kHz; harmonics up to 3 MHz are included. The sharp elimination characteristics (>80 dB), the low level of instrument induced distortion, and the meter accuracy of these instruments result in highly accurate measurement of low level harmonic distortion.
3-3. An rms calibrated voltmeter is inherent in the 331A and 332A. The voltmeter provides a full scale sensitivity of 300 μvolts rms (residual noise <25 μvolts). The voltmeter frequency range is from 5 Hz to 3 MHz except on the 0.0003 volt range, which is from 20 Hz to 500 kHz.
3-4. CONTROLS AND INDICATORS.
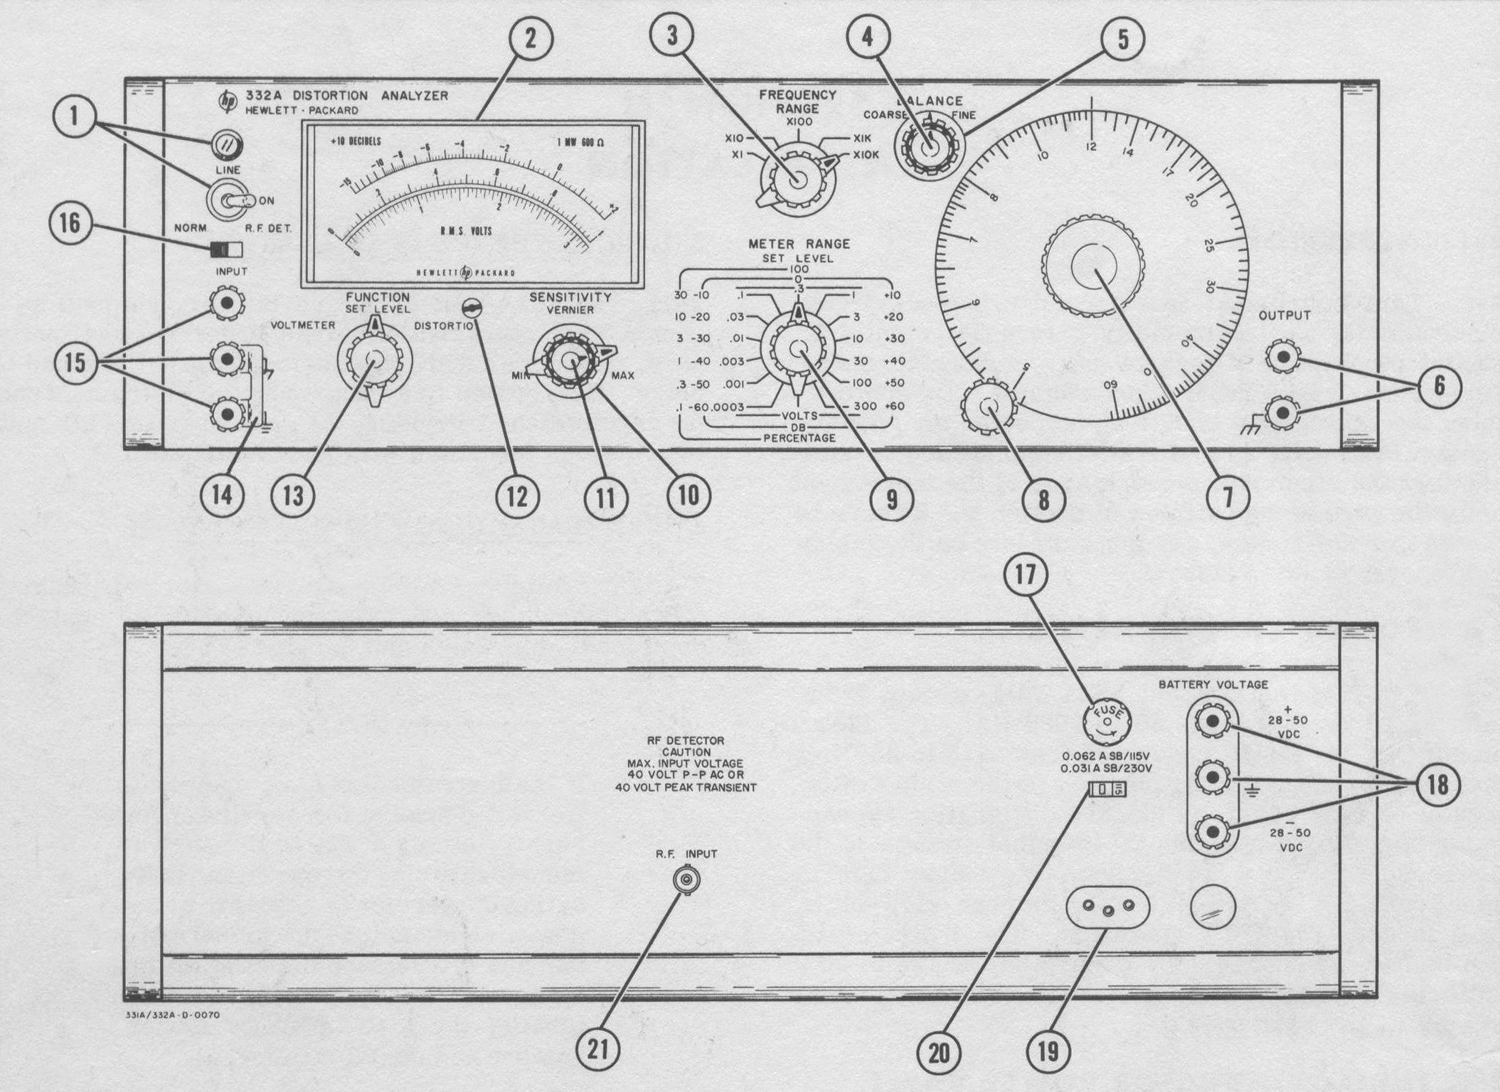
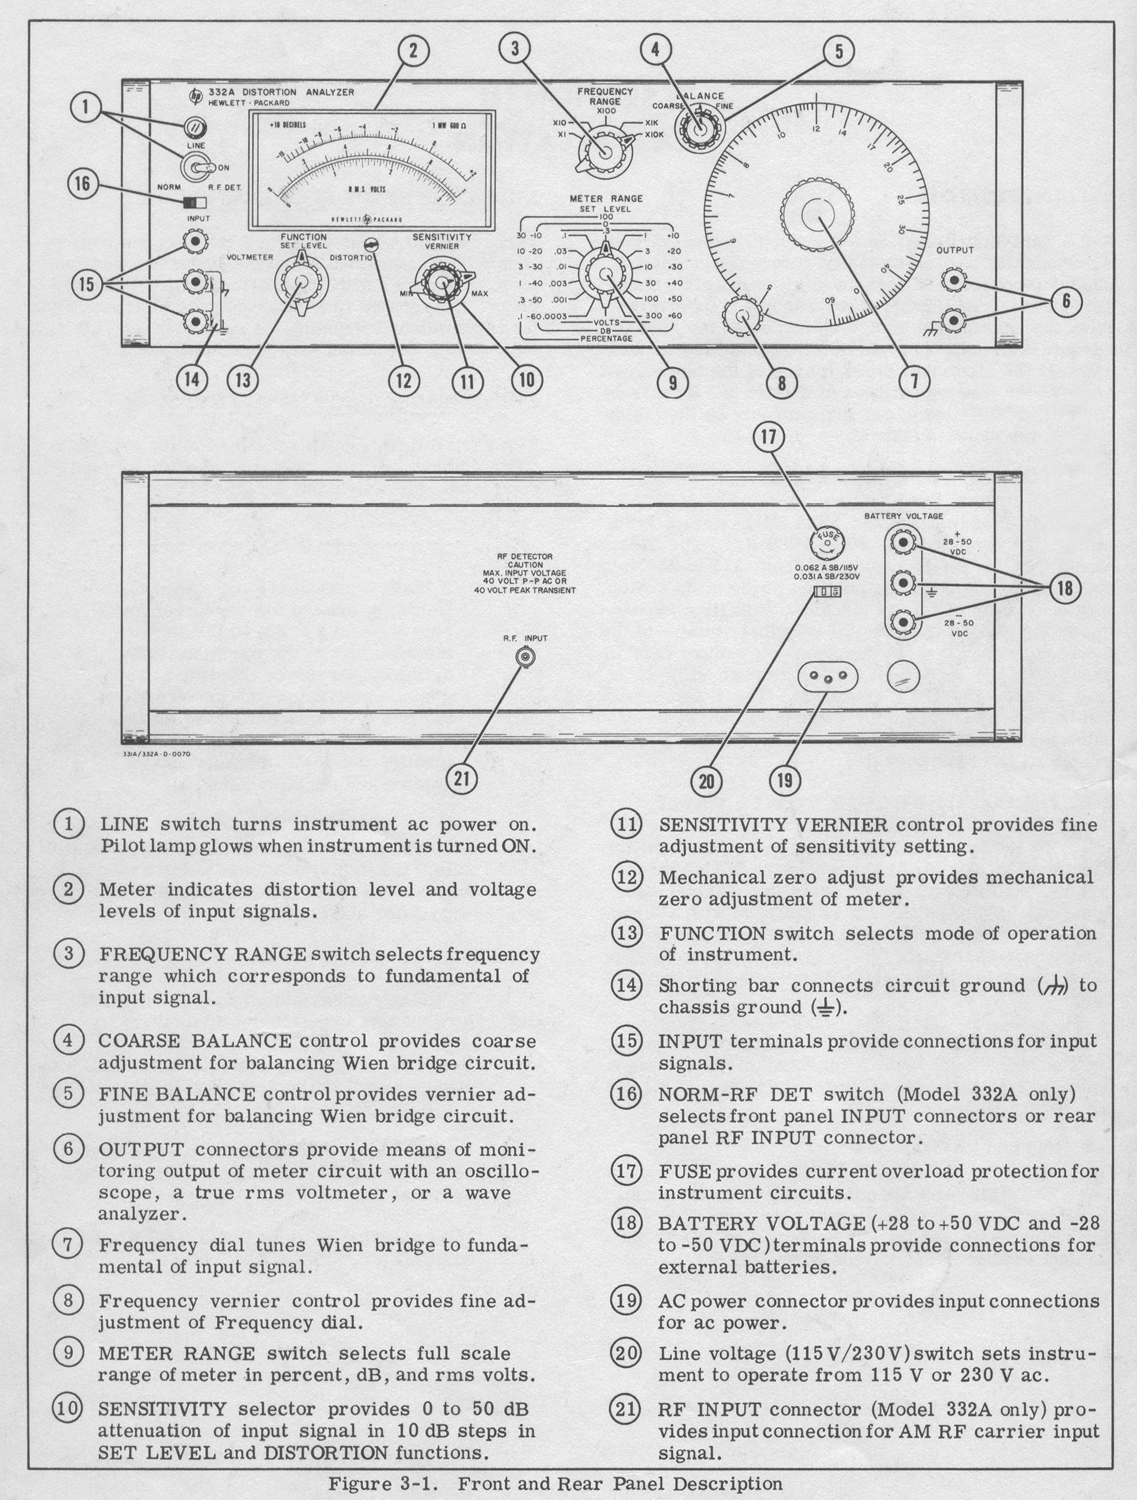
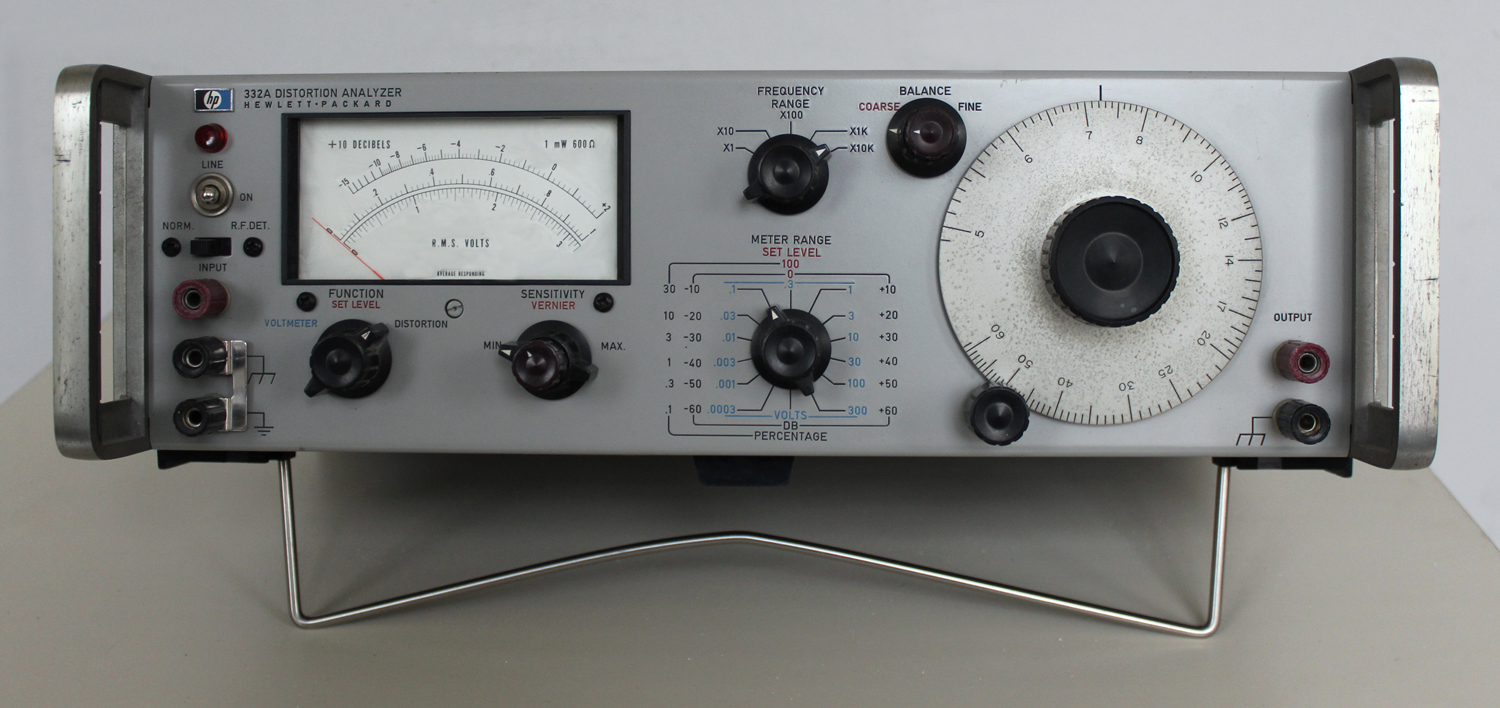
3-5. Figure 3-1 illustrates and describes the function of all front and rear panel controls, connectors, and indicators. The description of each component is keyed to the drawing included within the figure.
3-6. GENERAL OPERATING INFORMATION.
3-7. INPUT CONNECTIONS.
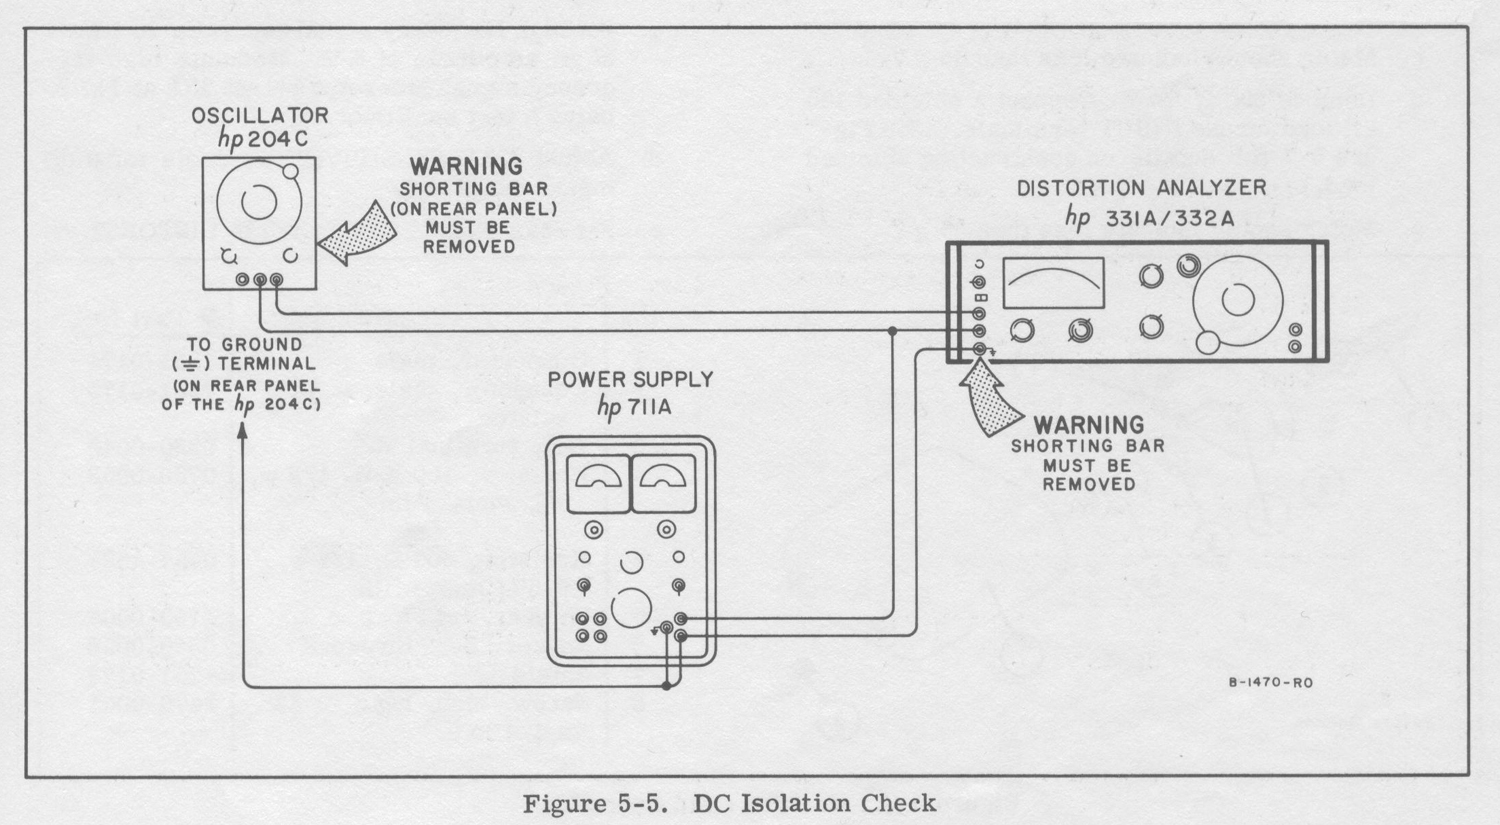
3-8. A signal source can be connected to the 331A and 332A through twisted pair leads or a shielded cable with banana plug connectors. Keep all test leads as short as possible to avoid extraneous pickup from stray ac fields. When measuring low-level signals, avoid ground loop currents by connecting only the 331A or 332A Distortion Analyzer directly to power-line ground through a NEMA (three-prong) connector. Connect all other instruments to the power source through a three-prong to two—prong adapter and leave the pigtail disconnected. Both the 331A and 332A have a dc isolation of ±400 Vdc from the external chassis.WARNING
WHEN THE INSTRUMENT IS OPERATED IN A FLOATING CONDITION, THE SET SCREWS IN THE CONTROL KNOBS  WILL BE AT THE FLOATED POTENTIAL. TO PROTECT OPERATING PERSONNEL, ENSURE THAT THE SET SCREW HOLES ARE- FILLED WITH AN INSULATING MATERIAL SUCH AS E. SILICON RUBBER , RTV-108. (-hp- PART NO. 0470-0304) .3-9. VOLTMETER CHARACTERISTICS.
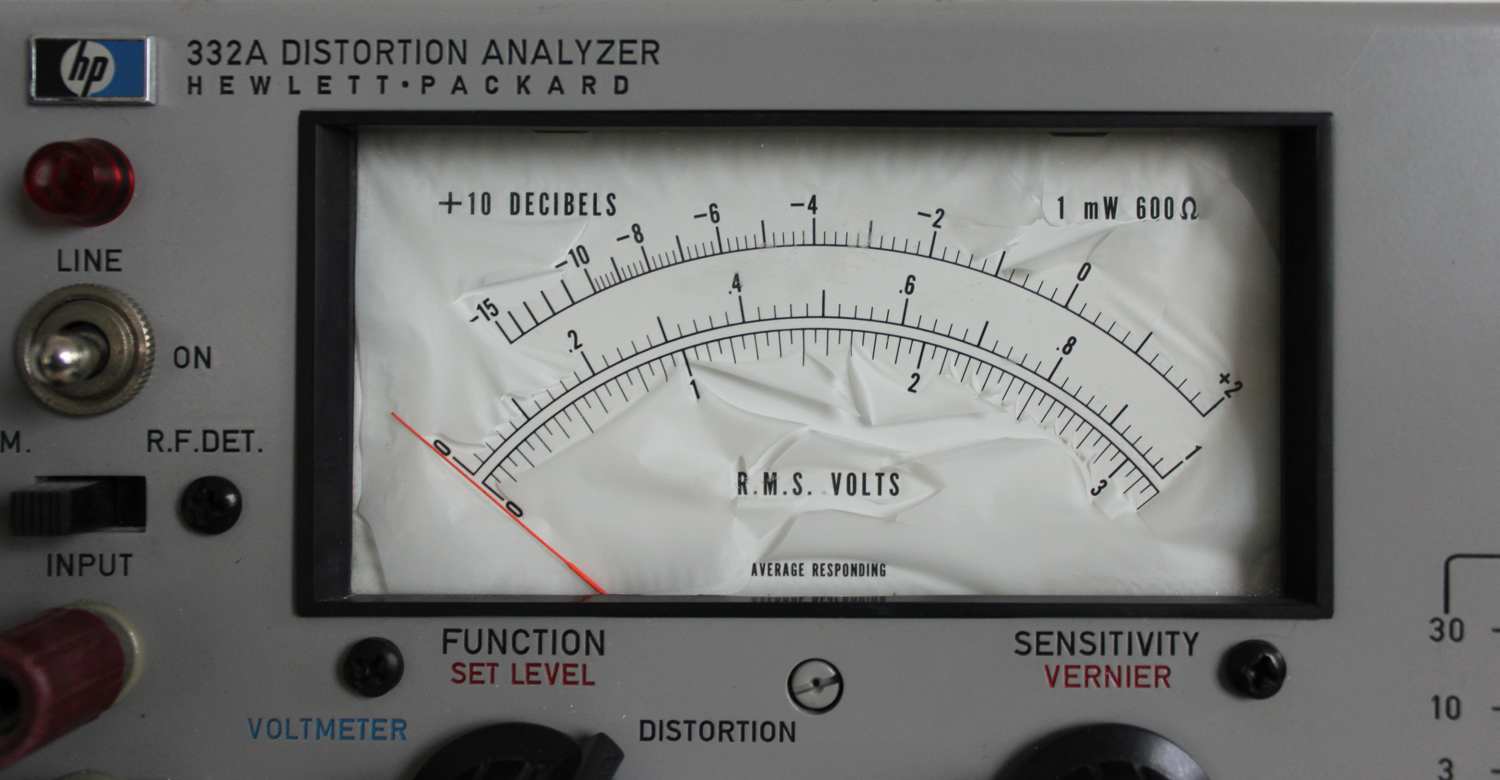
3-10. The RMS VOLTS markings on the meter face
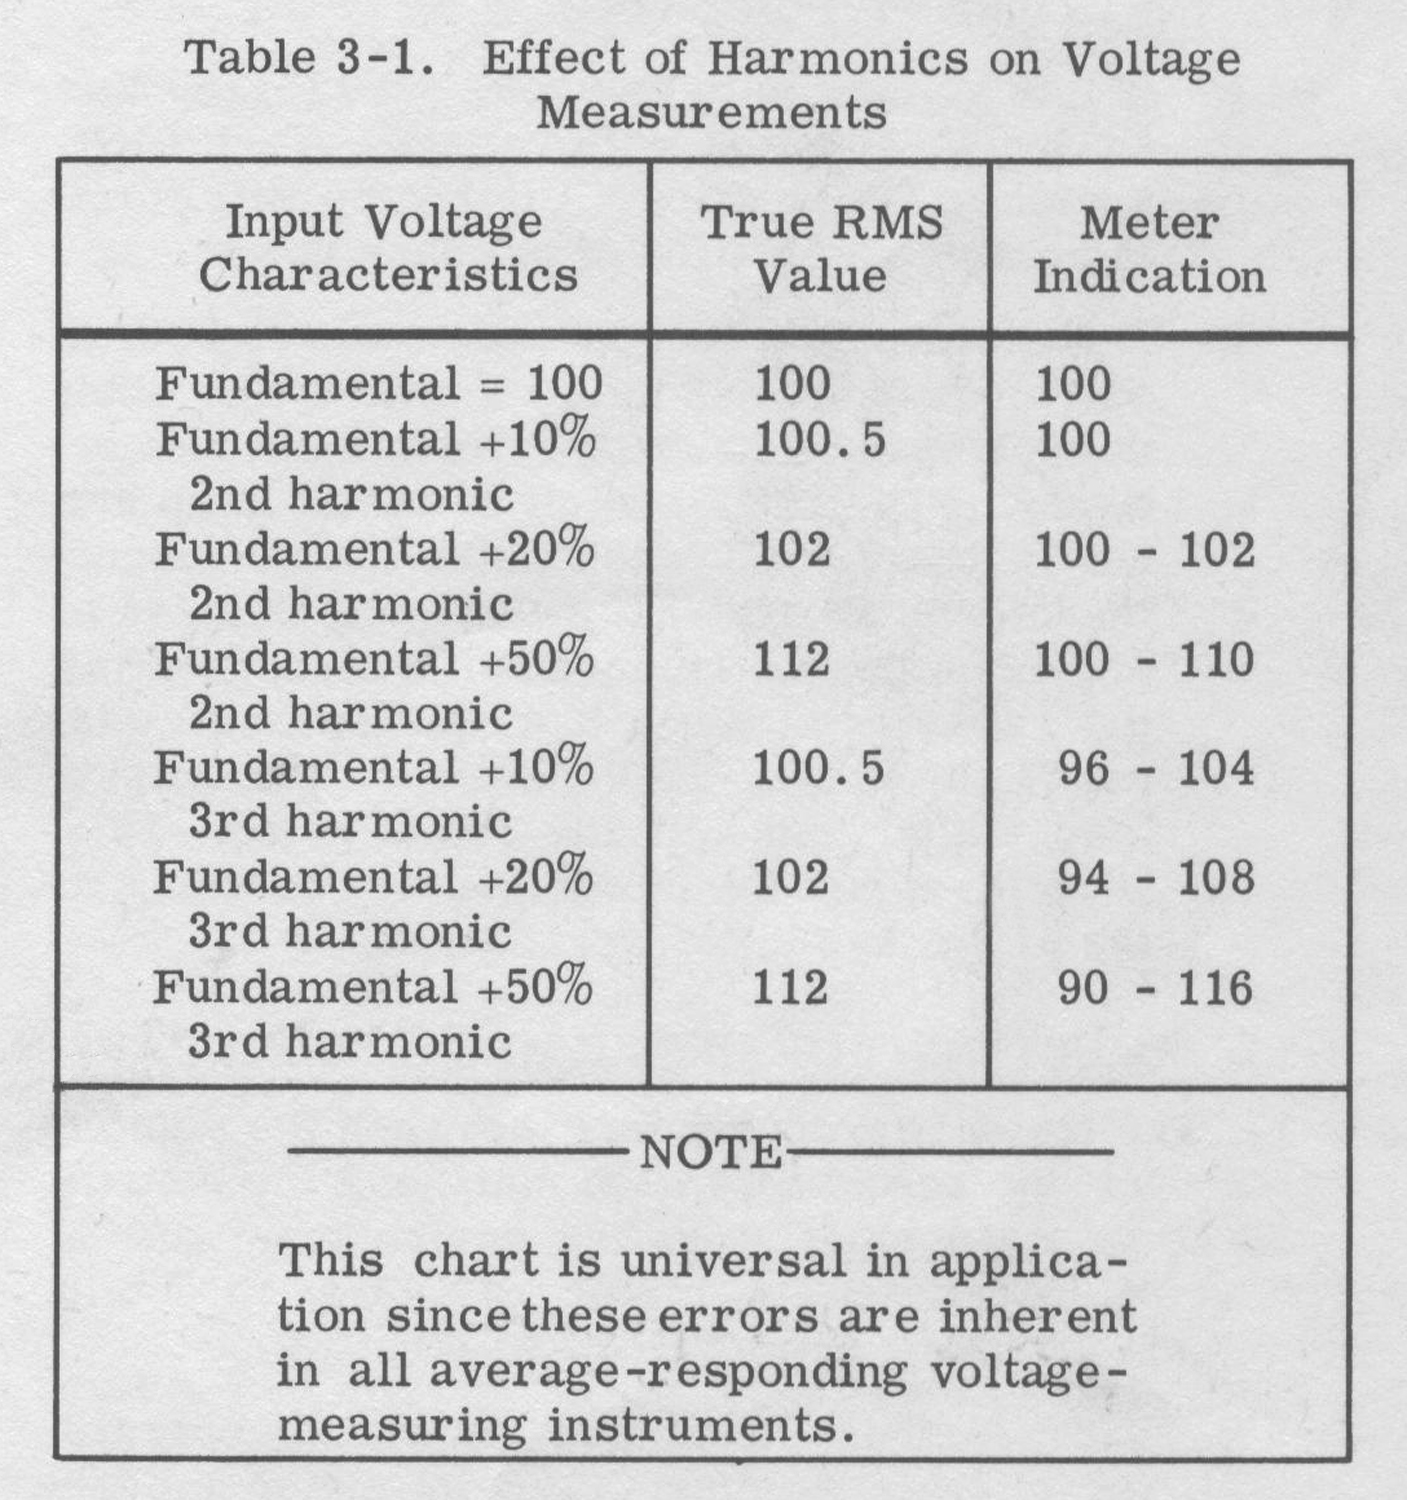
are based on-the ratio between the average and effective (rms) values of a pure sine wave. The ratio of average to effective values in a true sine wave is approximately 0.9 to 1. When the meter is used to measure complex waves, the voltage indicated may not be the rms value of the signal applied. This deviation of meter indication exists because the ratios of average to effective values are usually not the same in a complex wave as in a sine wave. The amount of deviation depends on the magnitude and phase relation between the harmonics and fundamental frequency of the signal applied. Table 3-1 shows the deviation of the meter indication of a sine wave partly distorted by harmonics. As indicated in the table, harmonic content of less than approximately 10% results in very small errors. 3-11. In distortion measurements where the fundamental frequency is suppressed and the remainder of the signal is measured, the reading obtained on an average-responding meter may deviate from the true total rms value. When the residual wave contains many in harmonically related sinusoids, the maximum error in the distortion reading is about 11% low for distortion levels below 10%.
This example represents the maximum possible error, and in most cases the error is less. In distortion measurements, the reading of an average-responding meter is sufficiently close to the rms value to be satisfactory for most applications.
3-12. OUTPUT CHARACTERISTICS.
3-13. The OUTPUT terminals provide a 0.1 V rms open circuit output for full scale meter deflection. These terminals can be used to monitor the output signal with an oscilloscope, a true rms voltmeter, or a wave analyzer. The combinations of the distortion meter and oscilloscope provides more significant information about the device under test than the expression of distortion magnitude alone. Information obtained from the oscilloscope pattern is specific and reveals the nature of the distortion that sometimes occurs at such low levels that it is difficult to detect in the presence of hum and noise. The impedance at the OUTPUT terminals is 2000 ohms; therefore, capacitive loads greater than 50 pF should be avoided to maintain the accuracy of meter readings.
3-14. OPERATING PROCEDURES.
3-15. INSTRUMENT TURN-ON.
1. If line voltage is Ito be used, set 115-230 Vac switch to coincide with voltage. Turn LINE switch  to ON position. Pilot lamp will glow, indicating application of primary power.
2. If batteries are to be used, connect both a +28 to +50 V and -28 to -50 V battery (or other dc source) to + and – battery terminals , respectively. (The LINE switch and pilot lamp are not in the circuit when batteries are used; therefore, an external switch may be used to provide a convenient means for disconnecting the batteries). When a dc power source is used, check the -25 V power supply output (any violet lead). If the output is not -25 V ±0. 5 V, adjust the power supply according to the procedure in Paragraph 5-24.
3-16. ADJUSTMENT OF METER MECHANICAL ZERO.3-17. The meter is properly zero-set when the pointer rests over the zero calibration mark and the instrument is in its normal operating environment and is turned off. Zero-set the meter as follows to obtain maximum accuracy and mechanical stability:
1. Turn instrument on and allow it to operate for at least 20 minutes, to let meter movement reach normal operating temperature.
2.Turn instrument off and allow 30 seconds for all capacitors to discharge.
3. Rotate zero adjustment screw clockwise until pointer is left of zero and moving upscale,
4. Continue rotating screw clockwise; stop when pointer is exactly at zero.
5. When pointer is exactly over zero, rotate adjustment screw slightly counterclockwise to relieve tension on pointer suspension. If pointer moves off zero, repeat steps c through e, but make counterclockwise rotation less.
3-18. DISTORTION MEASUREMENT.
CAUTION
DO NOT EXCEED THE INPUT VOLTAGES LISTED BELOW TO PREVENT BLOWING FUSE F2:
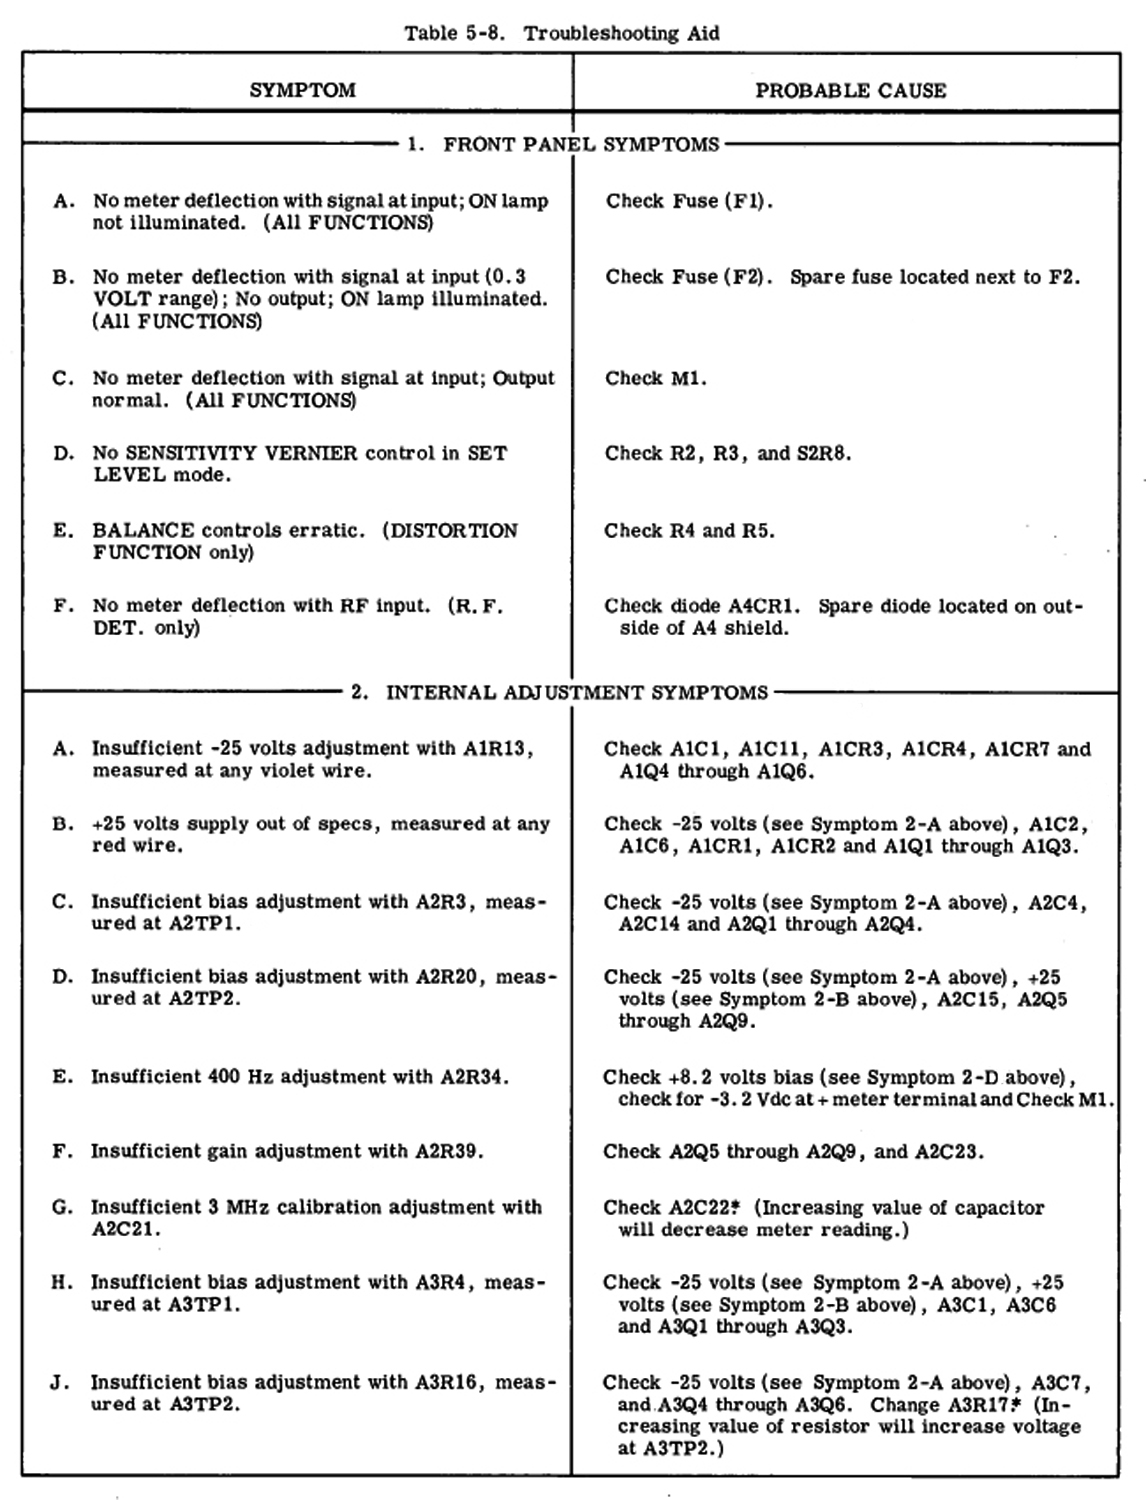
(See Table 5-8 for symptoms of blown-fuse.)VOLTMETER FUNCTION -1 V RANGE AND BELOW, AND DISTORTION ANALYZER FUNCTION-MAXIMUM SENSITIVITY.
1. 300 V ABOVE 100 Hz
2. 50 V ABOVE 1 KHZ IF LOW FREQUENCIES ARE NOT TO BE MEASURED, C1 MAY BE REPLACED WITH A SMALLER CAPACITOR, AND THE VOLTAGE LIMITS OF F2 MAY BE RAISED ACCORDINGLY.
a.Turn instrument on and mechanically zero meter according to procedure in Paragraphs 3-15 and 3-16.
b. Set NORM-R.F. DET. Switch to NORM.
c. Set FUNCTION switch to SET LEVEL.
d. Set SENSITIVITY selector to MIN. position, and rotate VERNIER control maximum counterclockwise.
NOTE
The bandwidth of the SENSITIVITY selector is reduced in the two extreme counterclockwise positions (positions used with an input signal greater than 30 V).
e. Set METER RANGE switch to SET LEVEL, and set BALANCE COARSE and FINE controls to center position.
f. Connect signal to be measured to 331A/332A INPUT terminals.
WARNING
REMOVE SHORTING STRAP BETWEEN CIRCUIT GROUND
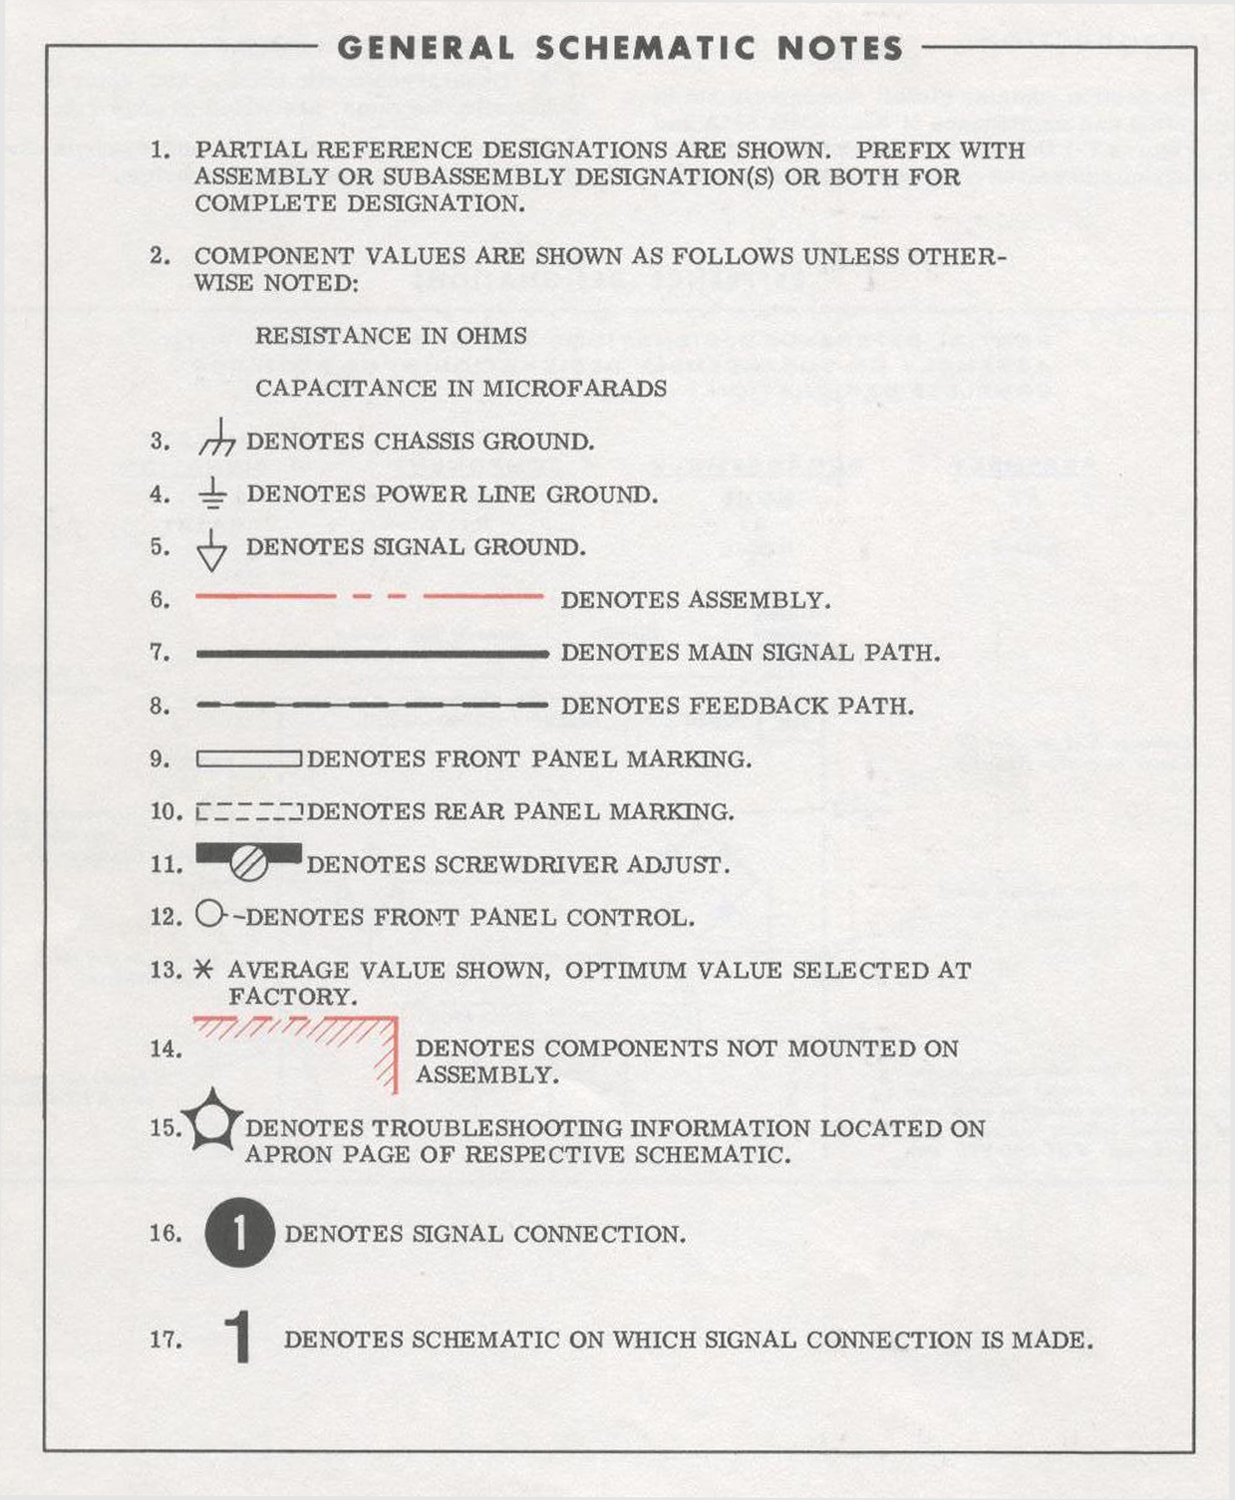
AND CHASSIS GROUND (See GENERAL SCHEMATIC NOTES)
TERMINALS ON FRONT PANEL INPUT TERMINAL WHEN MEASURING DISTORTION BETWEEN TWO POINTS WHICH ARE DC OFFSET FROM GROUND POTENTIAL.g. Set SENSITIVITY selector to obtain meter indication greater than 1/3 full scale.
h. Adjust SENSITIVITY VERNIER for full scale meter indication if making distortion measurement in percent; if making distortion measurement in dB, adjust SENSITIVITY VERNIER for 0 dB meter indication.
NOTE
If unable to adjust for full scale or 0 dB indication (which indicates input signal is below 0.3 volts), set METER RANGE selector down-scale. Use this new setting as the 100% or 0 as SET LEVEL position, thus making the next range 30% or -10 dB etc.
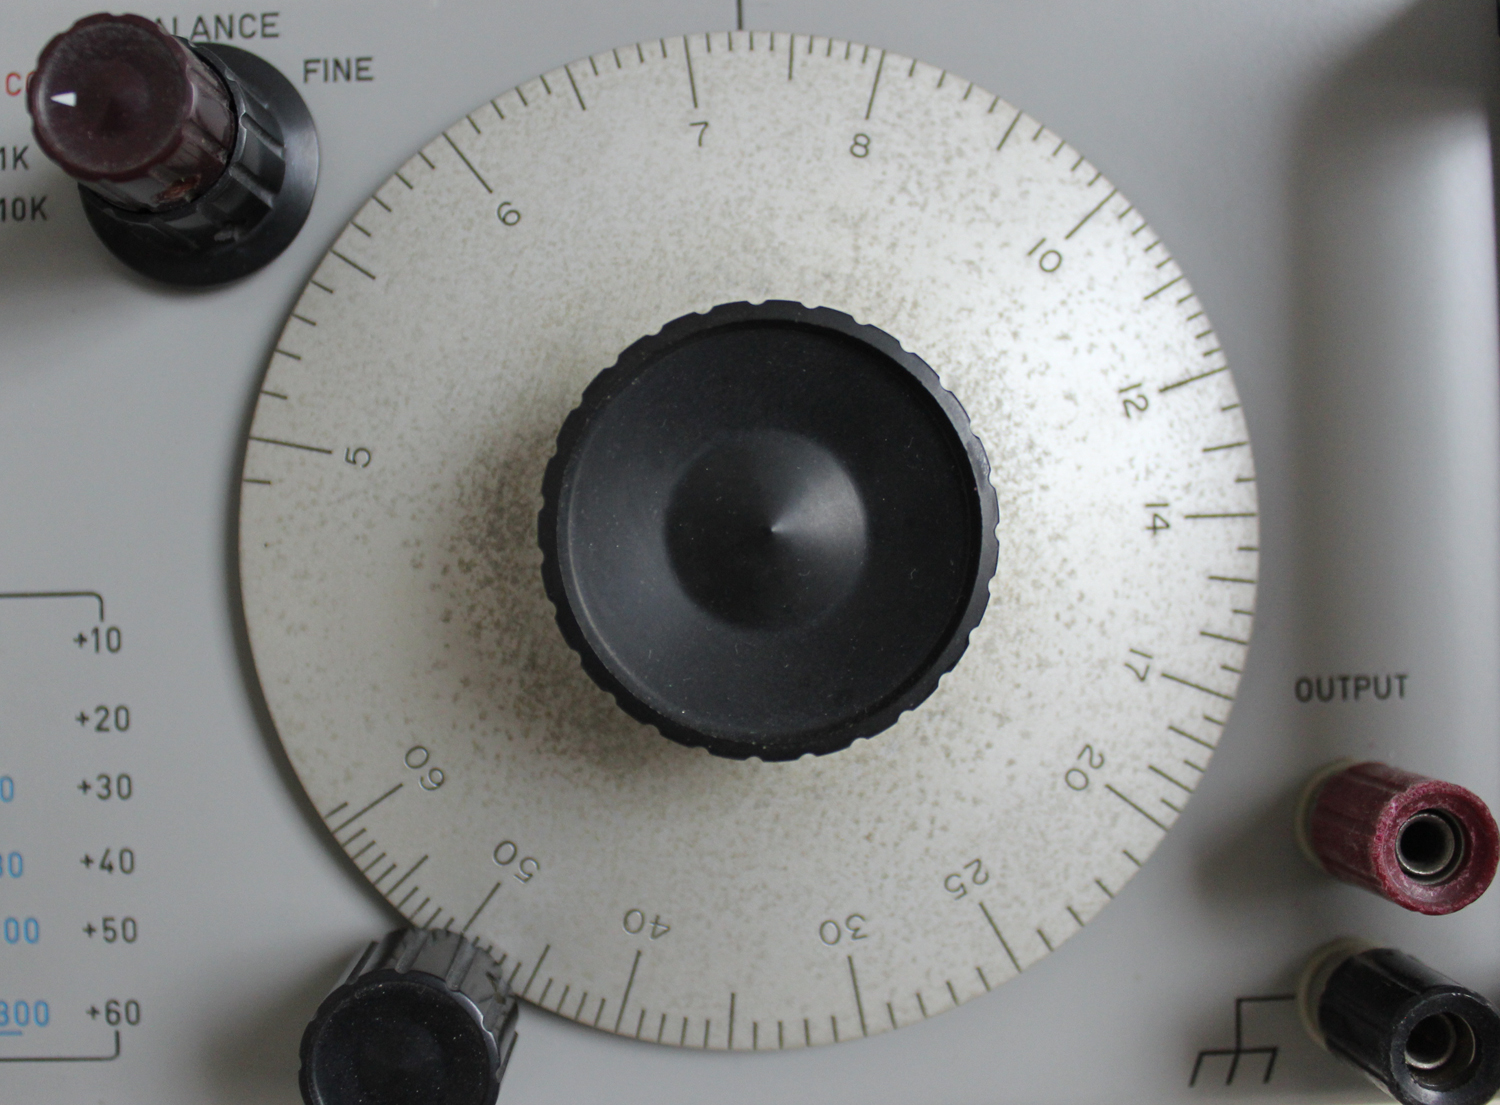
i. Set FREQUENCY RANGE switch and frequency dial to fundamental frequency of input signal.
j. Set FUNCTION Switch to DISTORTION.
k. Adjust frequency dial vernier and BALANCE COARSE and FINE controls for minimum meter indication. Set METER RANGE switch down-scale as necessary to keep meter indication on scale.
Note
Because of the high sensitivity and narrow fundamental rejection notch, pressure applied to the top cover may cause the null to shift. This is caused by small capacitive changes between the Wien bridge and case. Accuracy of reading is not degraded, however, if the pressure  is constant and the bridge is rebalanced.
l. Repeat step k until no further reduction in meter indication can be obtained.
m. Observe distortion either-in percentage or dB, as indicated by meter deflection and METER RANGE switch setting. For example, if meter indicates 0.4 and METER RANGE setting  is 1%, distortion measured is 0.4% of fundamental. Similarly, if meter indicates -6 dB and METER RANGE setting is -40 dB, distortion measured is -46 dB from fundamental.
NOTE
The accuracy of distortion measurements is affected by the frequency stability of the input signal. An inaccuracy in distortion indications occurs when the frequency drift of the input signal exceeds the bandwidth of the rejection curve.
p. If desired, rms voltage of input signal can be measured by setting FUNCTION switch to VOLTMETER, and setting METER RANGE switch to obtain an on-scale indication.
3-19 DISTORTION AND NOISE MEASUREMENT OF AM RF CARRIERS (332A ONLY).
CAUTION
DO NOT EXCEED MAXIMUM INPUT VOLTAGES LISTED ON REAR PANEL.
3-20 DISTORTION MEASUREMENT.
a. Turn instrument on and mechanically zero meter according to procedure in Paragraphs 3-15 and 3-16.
b. Set NORM. -R. F. DET. switch to R. F. DET.
c. Connect input signal to R. F. INPUT terminal on rear panel.
d. Refer to Paragraph 3-18 for distortion measurement procedures.
NOTE
If no meter deflection can be obtained with an RF input, diode, A4CR1 should be checked. A spare diode is located on the outside of the A4 shield.
3-21 NOISE MEASUREMENT.
a. Perform steps a through c of Paragraph 3-20.
b. Set modulation of carrier to 100%, using amodulating frequency between 20 Hz and 20 kHz.
c. Set FUNCTION switch to SET LEVEL, and set METER RANGE to SET LEVEL.
d. Adjust SENSITIVITY controls for 0 dB indication on meter.
e. Reduce modulation of carrier to 0%.
f. Leave FUNCTION switch in SET LEVEL position, and adjust METER RANGE switch for on-scale meter indication.
g. Noise level of carrier is algebraic sum of meter reading and METER RANGE setting.
h. This same general procedure can be used to measure noise in an FM carrier when an external discriminator is substituted for the AM detector.3-22 VOLTAGE MEASUREMENT.
a.Turn instrument on and mechanically zero meter according to procedure in Paragraphs 3-15 and 3-16.
b. Set NORM. -R. F. DET. switch to NORM.
c. Set FUNCTION switch to VOLTMETER.
d. Set METER RANGE switch to a range exceeding amplitude of signal to be measured.
e. Connect signal to be measured to INPUT terminals.
f. Set METER RANGE switch to give a reading as close to full scale as possible, and observe meter indication.
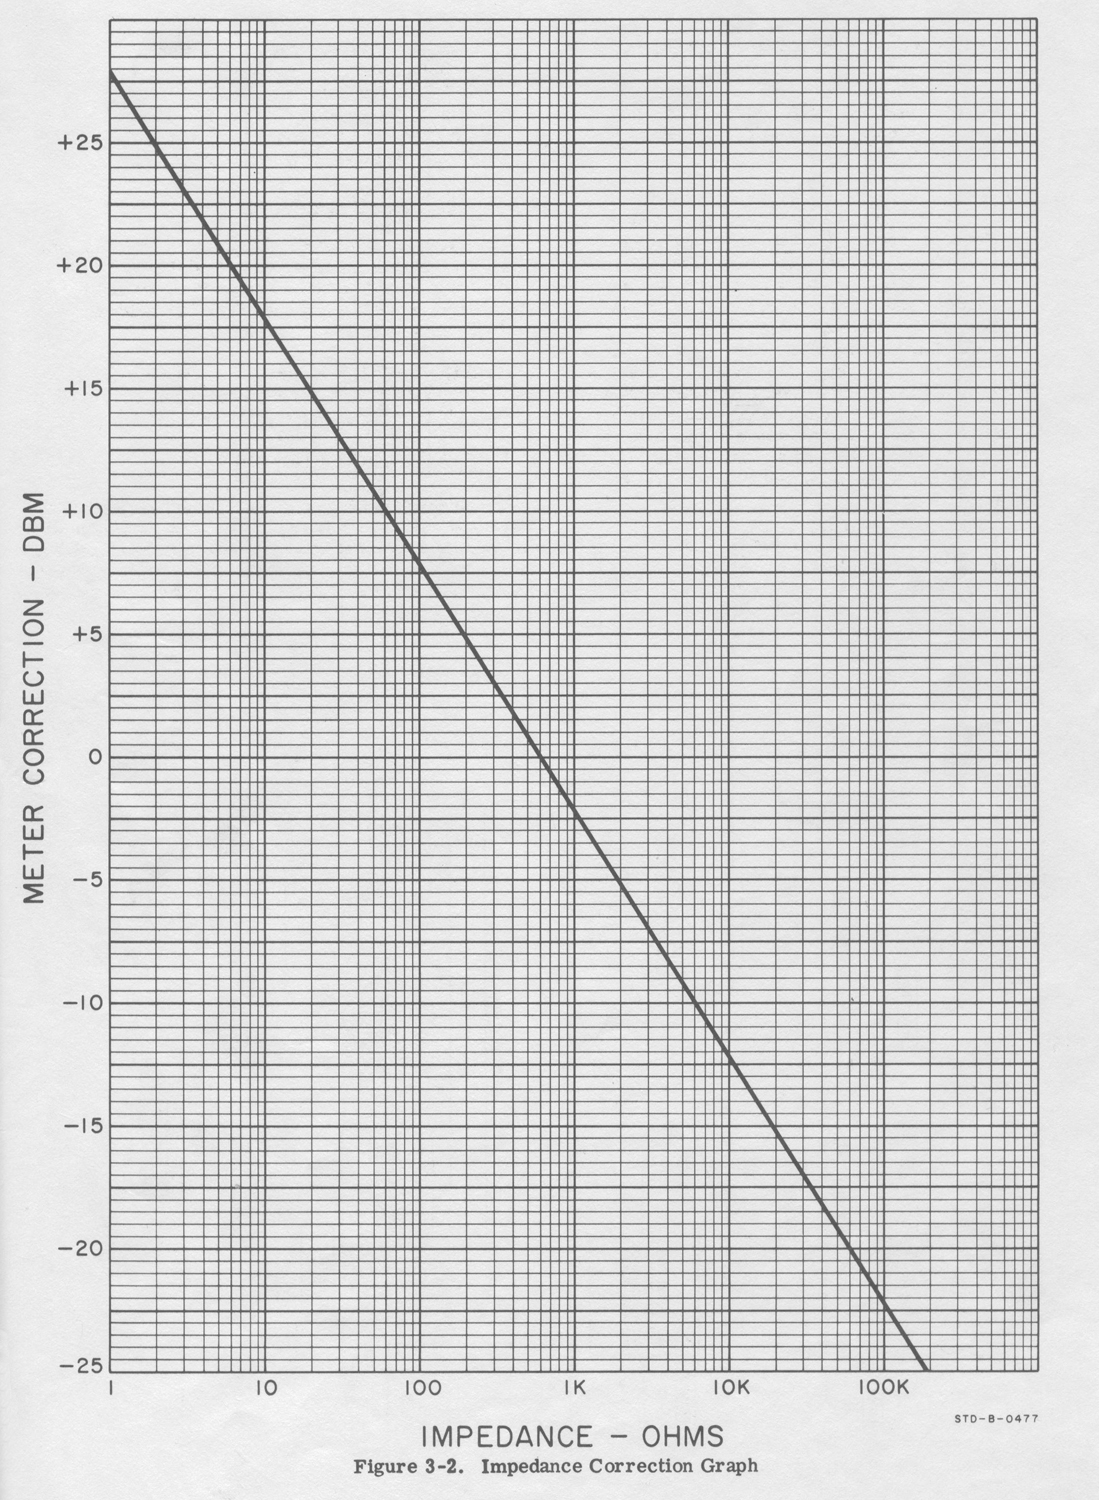
g. The dB scale of the 331A/332A is calibrated in dBm, such that 0 dBm = 1 milliwatt dissipated  by 600 ohms. Therefore, a dBm measurement must be made across 600 ohms. However, dB measurements across other impedances can be converted to dBm by use of the Impedance Correction Graph of Figure 3-2.For example: To convert a -30 dB reading across 200 ohms to dBm, locate the 200 ohm impedance line at the bottom of the graph. Follow the impedance line to the heavy black line, and read the meter correction at that point. The correction for 200 ohms is +5 dBm; thus the corrected reading is -25 dBm.
NOTE
When dBm measurements are made, the dB markings on the METER RANGE switch must each be lowered by 10. That is, the dB marking for the 0.3 V range becomes -10 dBm, 1 V range becomes 0 dBm, 3 V range becomes +10 dBm etc. If the other dB markings are used, the dBm readings will be 10 dBm high. 3-23. USE OF OUTPUT TERMINALS.
3-24. In VOLTMETER and SET LEVEL functions, the
331A/332A can be used as a low distortion, wideband amplifier. A portion of the meter input (0. 1 V rms open circuit for full scale meter deflection) is provided at the OUTPUT terminals.
3-25. In DISTORTION function, the distortion (0.1 V rms open circuit for full scale deflection) is provided at the OUTPUT terminals for monitoring purposes.
3-26. 331A/332A WITH OPTION 01.
3-27. Operating procedures for the 331A/332A with
Option 01 are the same as for the standard instrument. The only difference between the standard and optional instrument is that the Option 01 has a special meter and meter amplifier which is compensated to respond to VU (volume unit) characteristics».
§§§
Per consultare le altre parti scrivere “332A” su Cerca.
Foto di Claudio Profumieri, elaborazioni e ricerche di Fabio Panfili.
Per ingrandire le immagini cliccare su di esse col tasto destro del mouse e scegliere tra le opzioni.


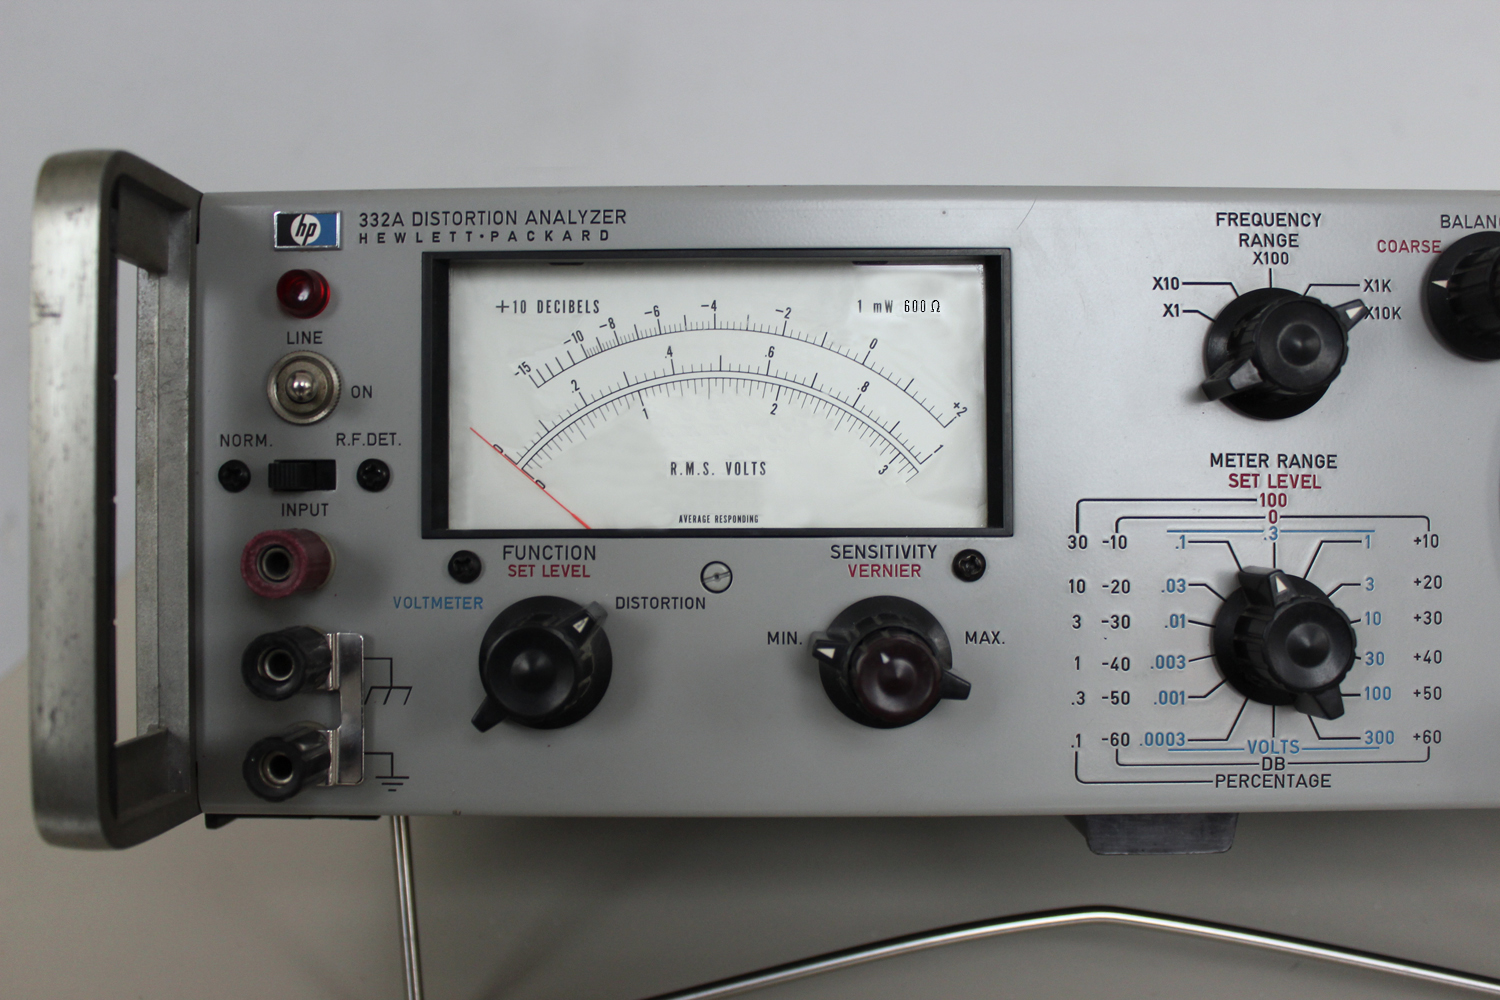
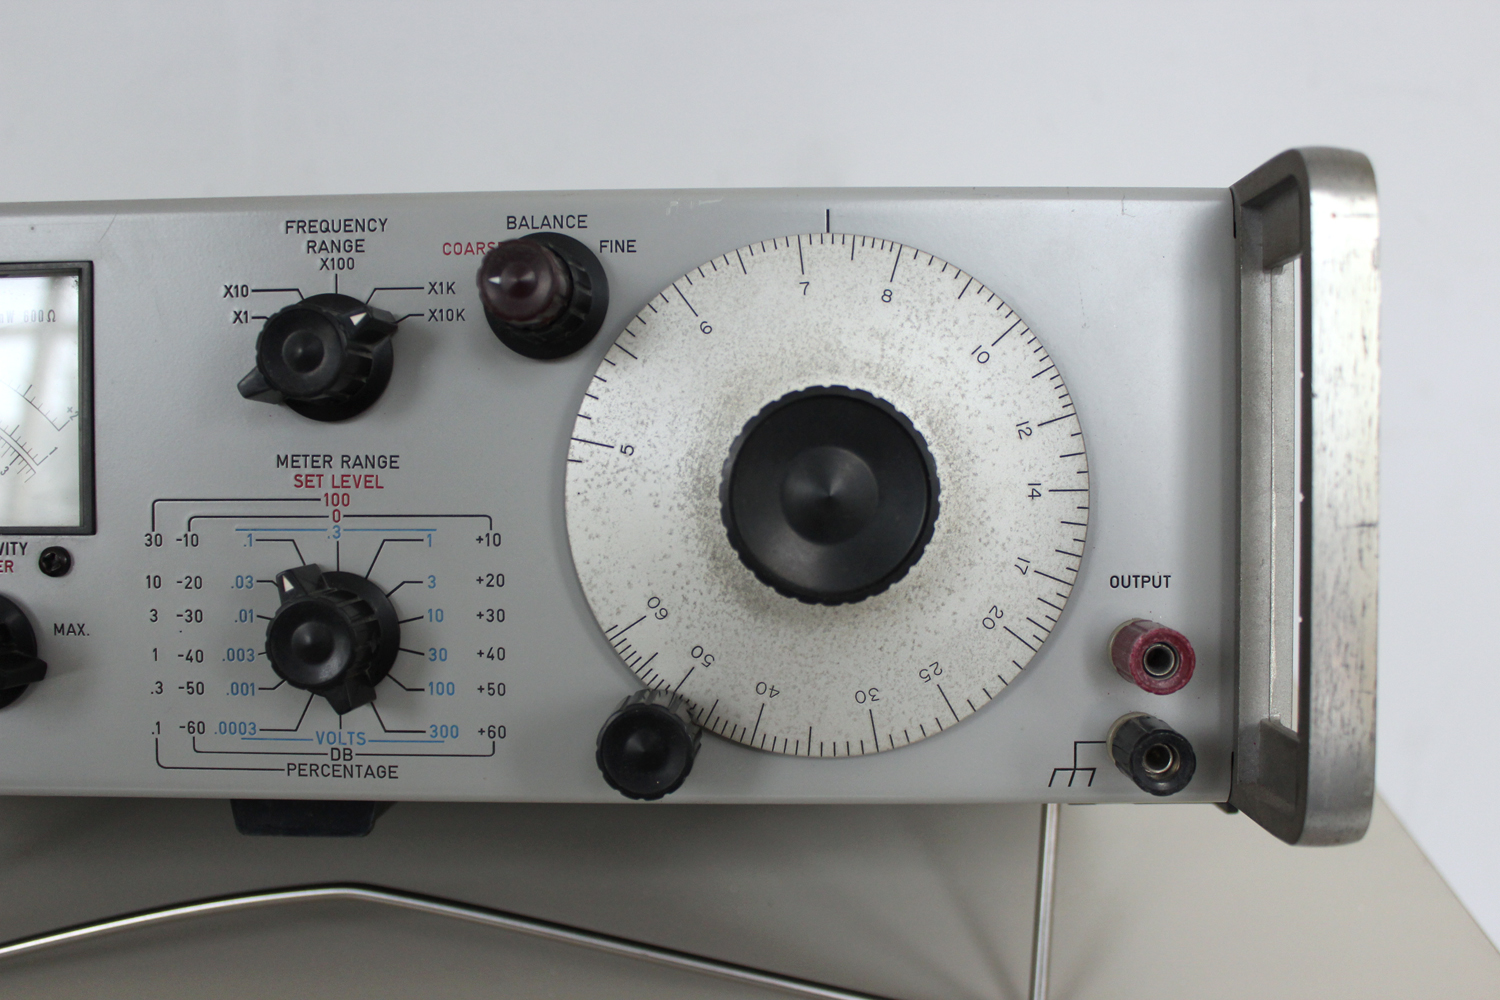
Distortion Analyzer Hewlett Packard 332A matr. N° 930 – 96620 1ª parte

Distortion Analyzer Hewlett Packard 332A matr. N° 930 – 96620. Prima parte.  
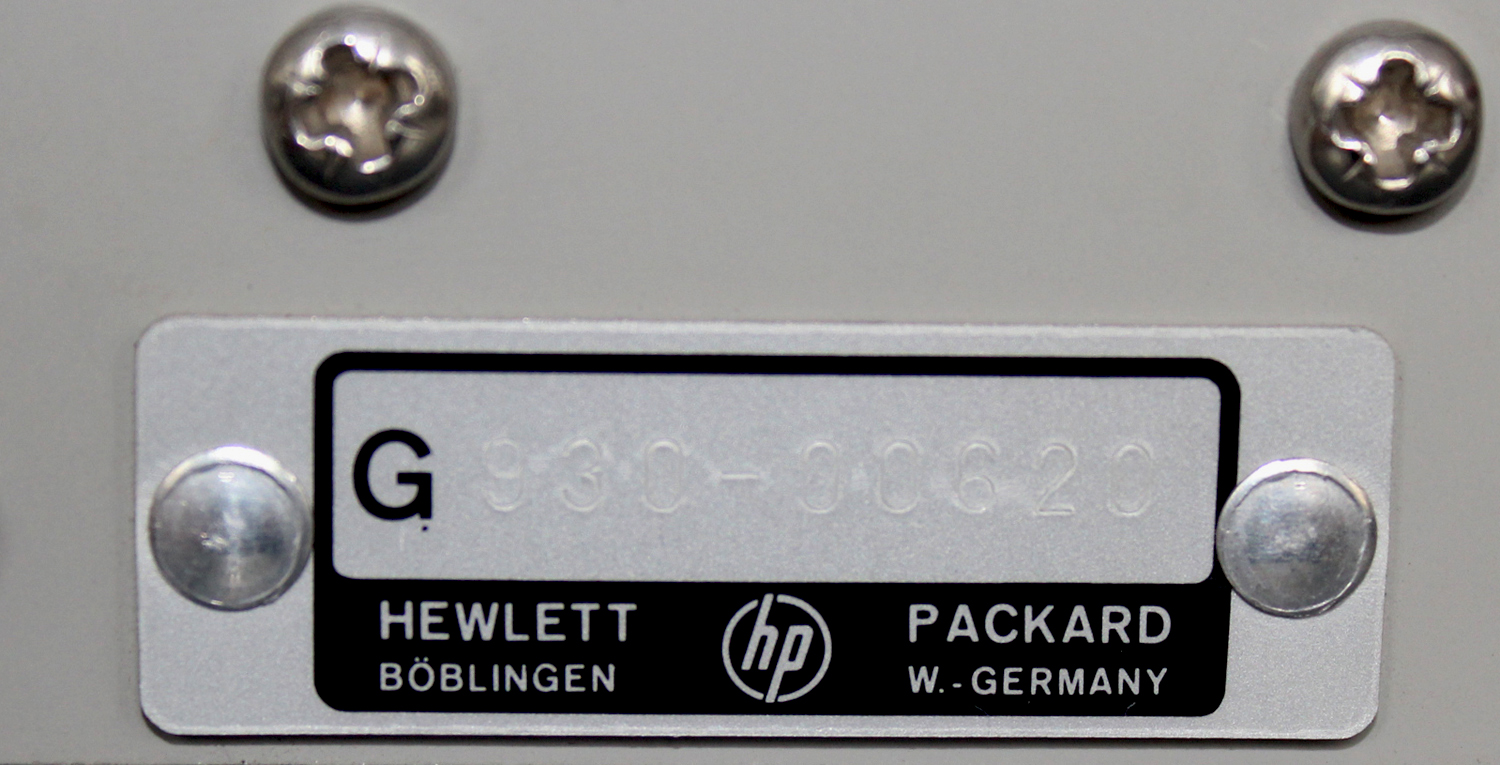
Nell’inventario particolare del Laboratorio di Elettronica  al n°  D 4826, in data  ottobre 1970, si legge:  “Distortion Analyzer  S/N 620 mod. 332A”.
Nell’ HEWLETT·PACKARD Journal VOL. 17 NO. 8 APRIL 1966 vi è addirittura la presentazione del modello 334A che nell’amplificatore di eliminazione della tensione a frequenza fondamentale (rejection) ha il ponte di Wien, come questo mod. 332A e come l’esemplare -hp- 330B che si può vedere in questo sito nella sezione Radiotecnica.
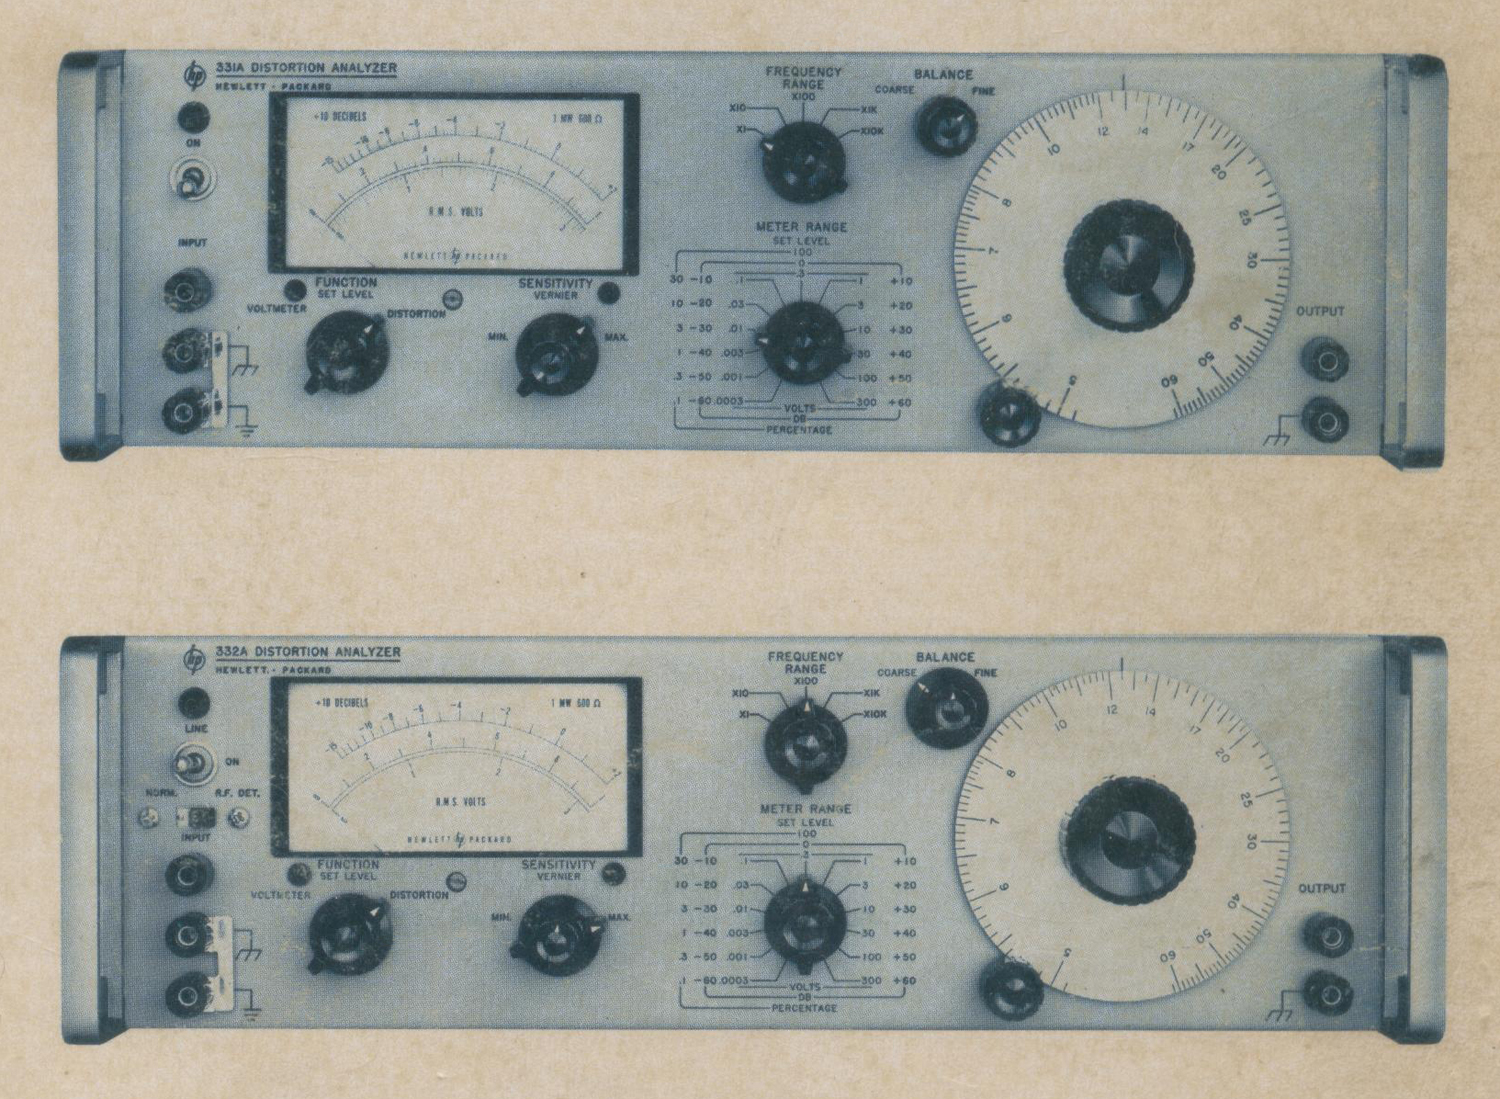
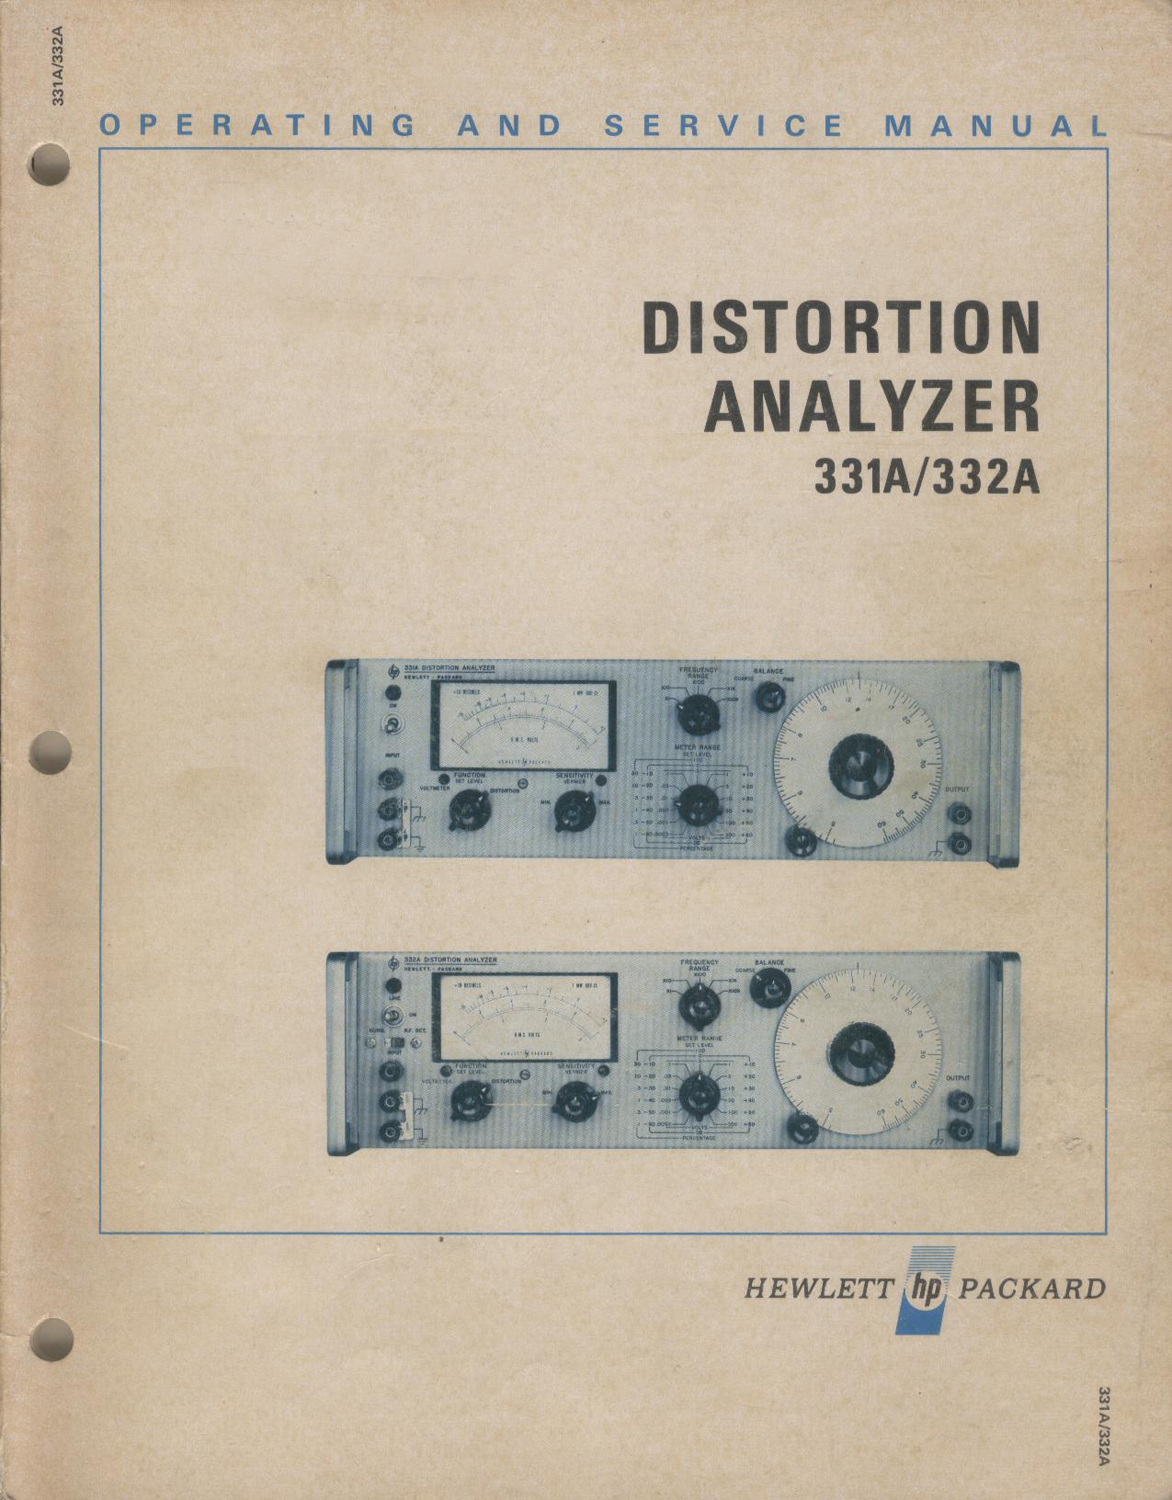
Il manuale di istruzioni, da cui sono tratte le seguenti figure, OPERATING AND SERVICE MANUAL DISTORTION ANALYZER 331A/332A HEWLETT hp PACKARD Printed JUNE 1969 è conservato presso la Sezione Elettronica.
Istruzioni  quasi identiche si possono trovare ad esempio all’indirizzo: https://www.artisantg.com/info/ATGx6v9r.pdf§§§
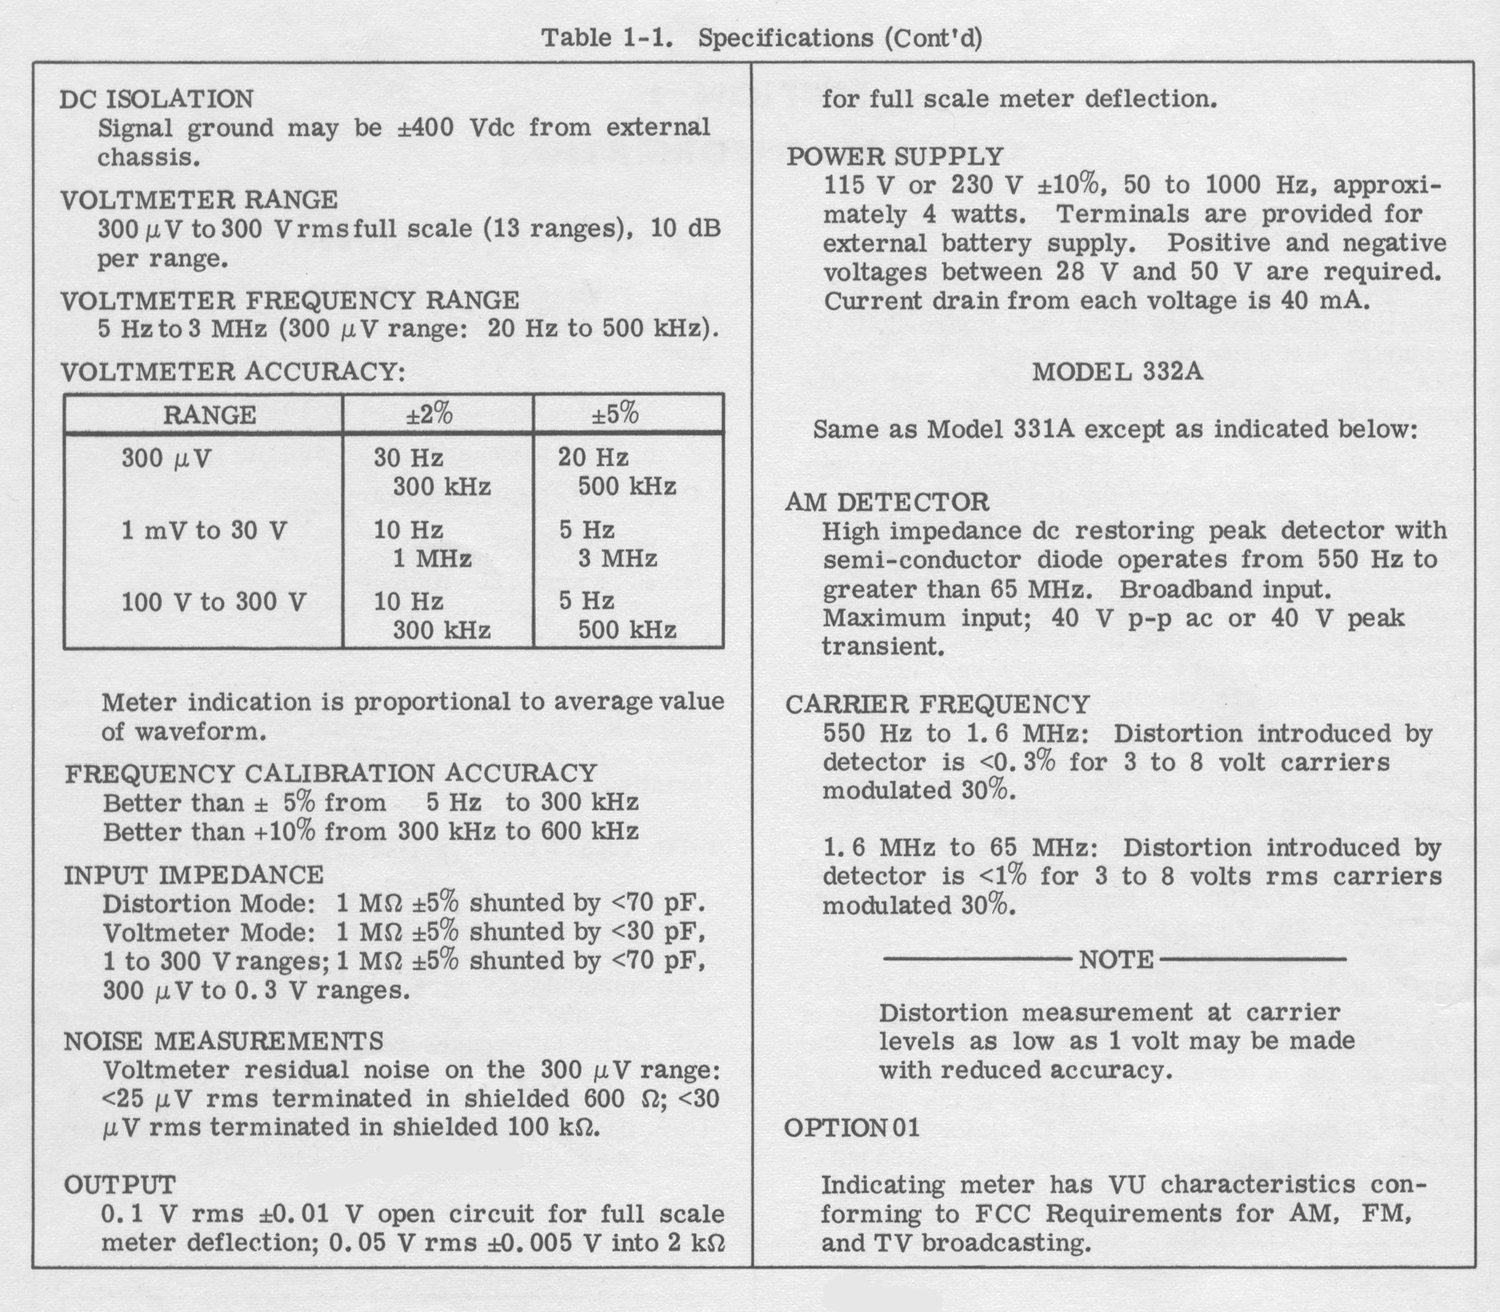
«SECTION I
GENERAL INFORMATION
1-1. DESCRIPTION.
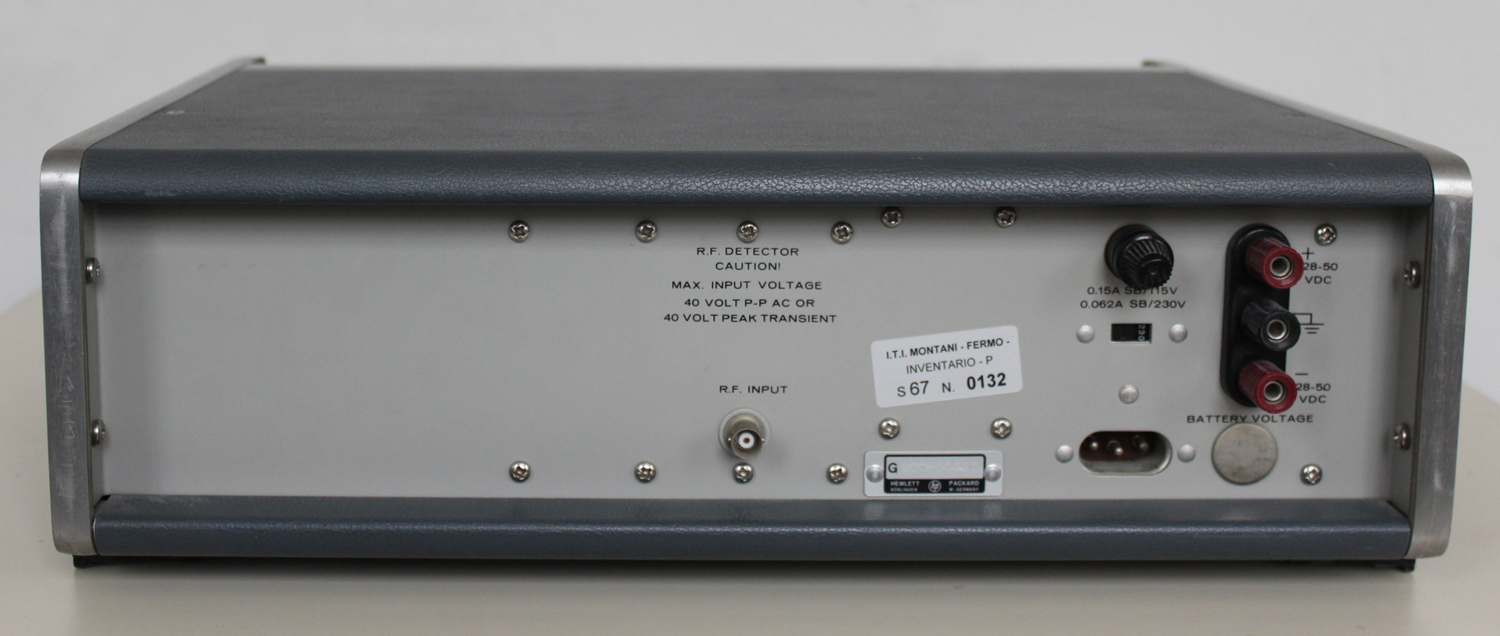
1-2. The Hewlett-Packard Models 331A and 332A Distortion Analyzers are solid state instruments for measuring distortion and ac voltages. The Model 332A includes a high impedance AM detector which operates from 550 kHz to greater than 65 MHz.
1-3. Distortion levels of 0. 1% to 100% full scale are measured in seven ranges for any fundamental frequency from 5 Hz to 600 kHz; harmonics are indicated up to 3 MHz.
The high sensitivity of these instruments requires only 0.3 V rms for the 100% set level reference. An output is provided at the OUTPUT connectors for monitoring the distortion with an oscilloscope, a true rms voltmeter, or a wave analyzer. The instruments are cabable {capable??} of a dc isolation voltage of 400 volts above chassis ground.
1-4. The transistorized voltmeter contained in the Model 331A and 332A can be used separately for general purpose voltage and gain measurements. The voltmeter has a frequency range of 5 Hz to 3 MHz (20 Hz to 500 kHz for 300 μV range) and a voltage range of 300 μV to 300 V rms full scale.
1-5. The AM detector included in the Model 332A is a broadband dc restoring peak detector consisting of a semiconductor diode and filter circuit. AM distortion levels as low as 0.3% can measured on a 3 V to 8 V rms carrier modulated 30% in the standard broadcast band, and lower than 1% distortion can be measured at the same level of the carrier up to 65 MHz.
1-6. ACCESSORY FEATURES.
1-7. The accessory available with the 331A and 332A Distortion Analyzers is a voltage divider probe, -hp- Model No. 10001A. The features of the probe are:
1. 10 megohm shunted by 10 pF.
2. 10:1 attenuation dc-to 30 MHz bandwidth.
3. 2% division accuracy.
4. 600 v peak input.
5. 5 nsec rise-time.
1-8. OPTION.
1-9. Option 01 is a standard -hp- Model 331A or 332A with a special meter and meter amplifier, compensated  to permit response to VU (volume units) characteristics.
1-10. INSTRUMENT IDENTIFICATION.
1-11. Hewlett-Packard instruments are identified by two-section eight- digit serial number (000-00000).
If the first three digits of the serial number on your instrument do not agree with those on the title page of this manual, change sheets supplied with the manual will define differences between your instrument and the 331A and 332A described in this manual.
1 -12. If a letter prefixes the serial number, the instrument was manufactured outside the United States.
SECTION II
INSTALLATION
2-1. INSPECTION.
2-2. This instrument was carefully inspected both mechanically and electrically before shipment. It should be physically free of mars or scratches and in perfect electrical order upon receipt. To confirm this, the instrument should be inspected for physical damage in transit. Also check for supplied accessories, and test the electrical performance of the instrument using the procedure outlined in Section V. If there is damage or deficiency, see the warranty on the inside front cover of this manual.
2-3. POWER REQUIREMENTS.
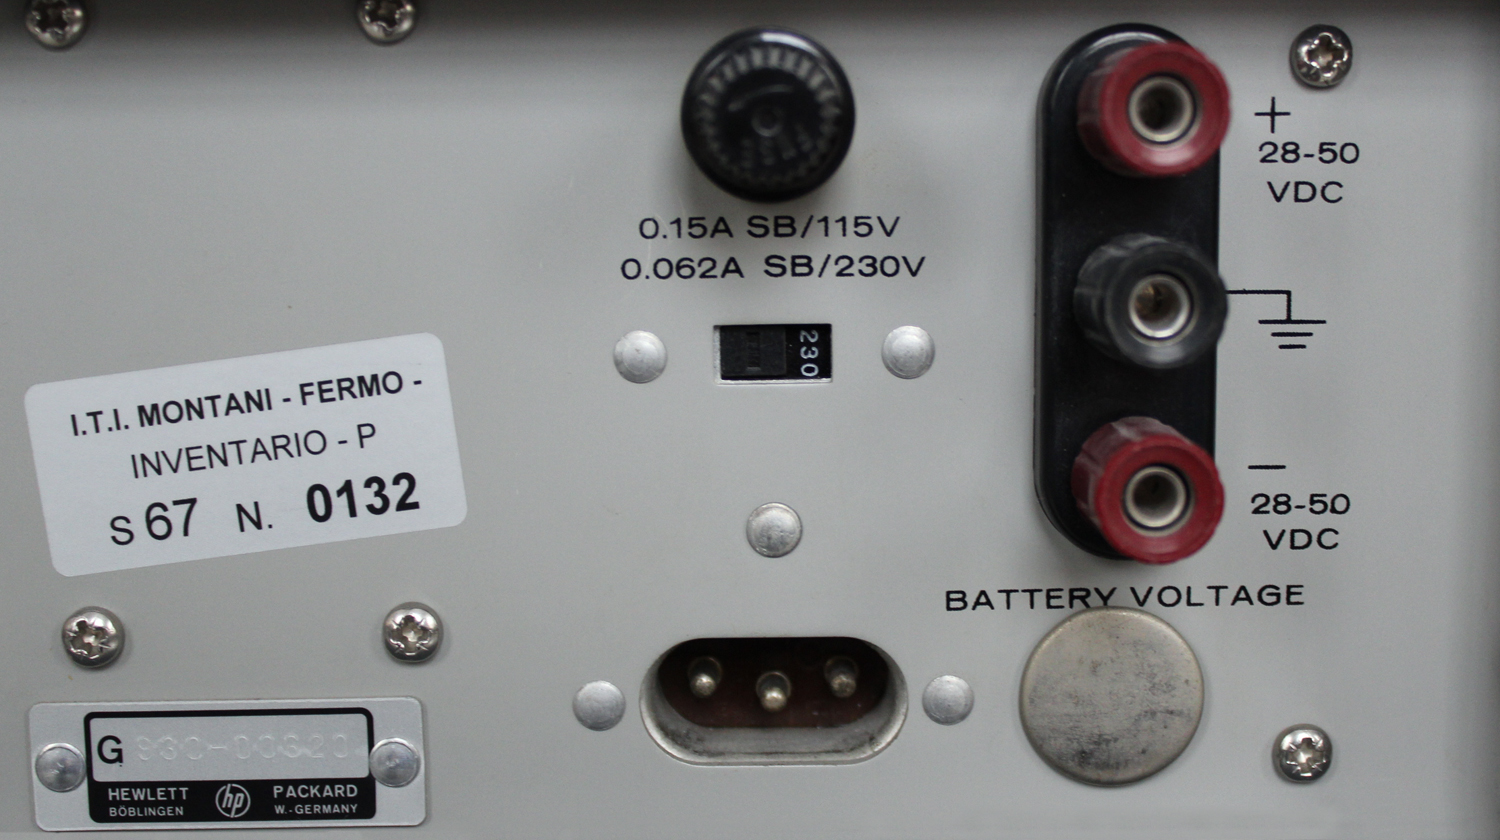
2-4. The Model 331A and 332A will operate from either 115 or 230 Vac, 48 to 440 Hz. The instruments can be easily converted from 115 to 230 volt operation by changing the position of the slide switch, located on rear panel, so that the designation appearing  on the switch matches the nominal voltage of the power source. A 1/16 ampere, slow-blow fuse is used for 115 V operation; a 1/32 ampere slow-blow fuse is used for 230 V operation. The instruments can be battery operated by connecting two 28 to 50 V batteries (rated at 40 milliamperes) to the battery  terminals on the rear panel.
2-5. THREE-CONDUCTOR POWER CABLE.
2-6. To protect operating personnel, the National Electrical Manufacturers’ Association (NEMA) recommends that the instrument panel and cabinet be grounded. This instrument is equipped with a three-conductor power cable which, when plugged into an appropriate receptacle, grounds the instrument. The offset pin on the power cable three-prong connector is the ground wire.
2-7. To preserve the protection feature when operating the instrument from a two-contact outlet, use a three-prong adapter and connect the green pigtail on the adapter to ground.
2-8. INSTALLATION.
2-9. The 331A and 332A are fully transistorized; therefore, no special cooling is required. However, the instruments should not be operated where the ambient temperature exceeds 55°C (131°F)».
§§§
Le parti: 2.10; 2.11 e 2.12 sono state omesse.
Per vedere le altre tre parti scrivere “332A” su Cerca.
Foto di Claudio Profumieri, elaborazioni e ricerche di Fabio Panfili.
Per ingrandire le immagini cliccare su di esse col tasto destro del mouse e scegliere tra le opzioni.