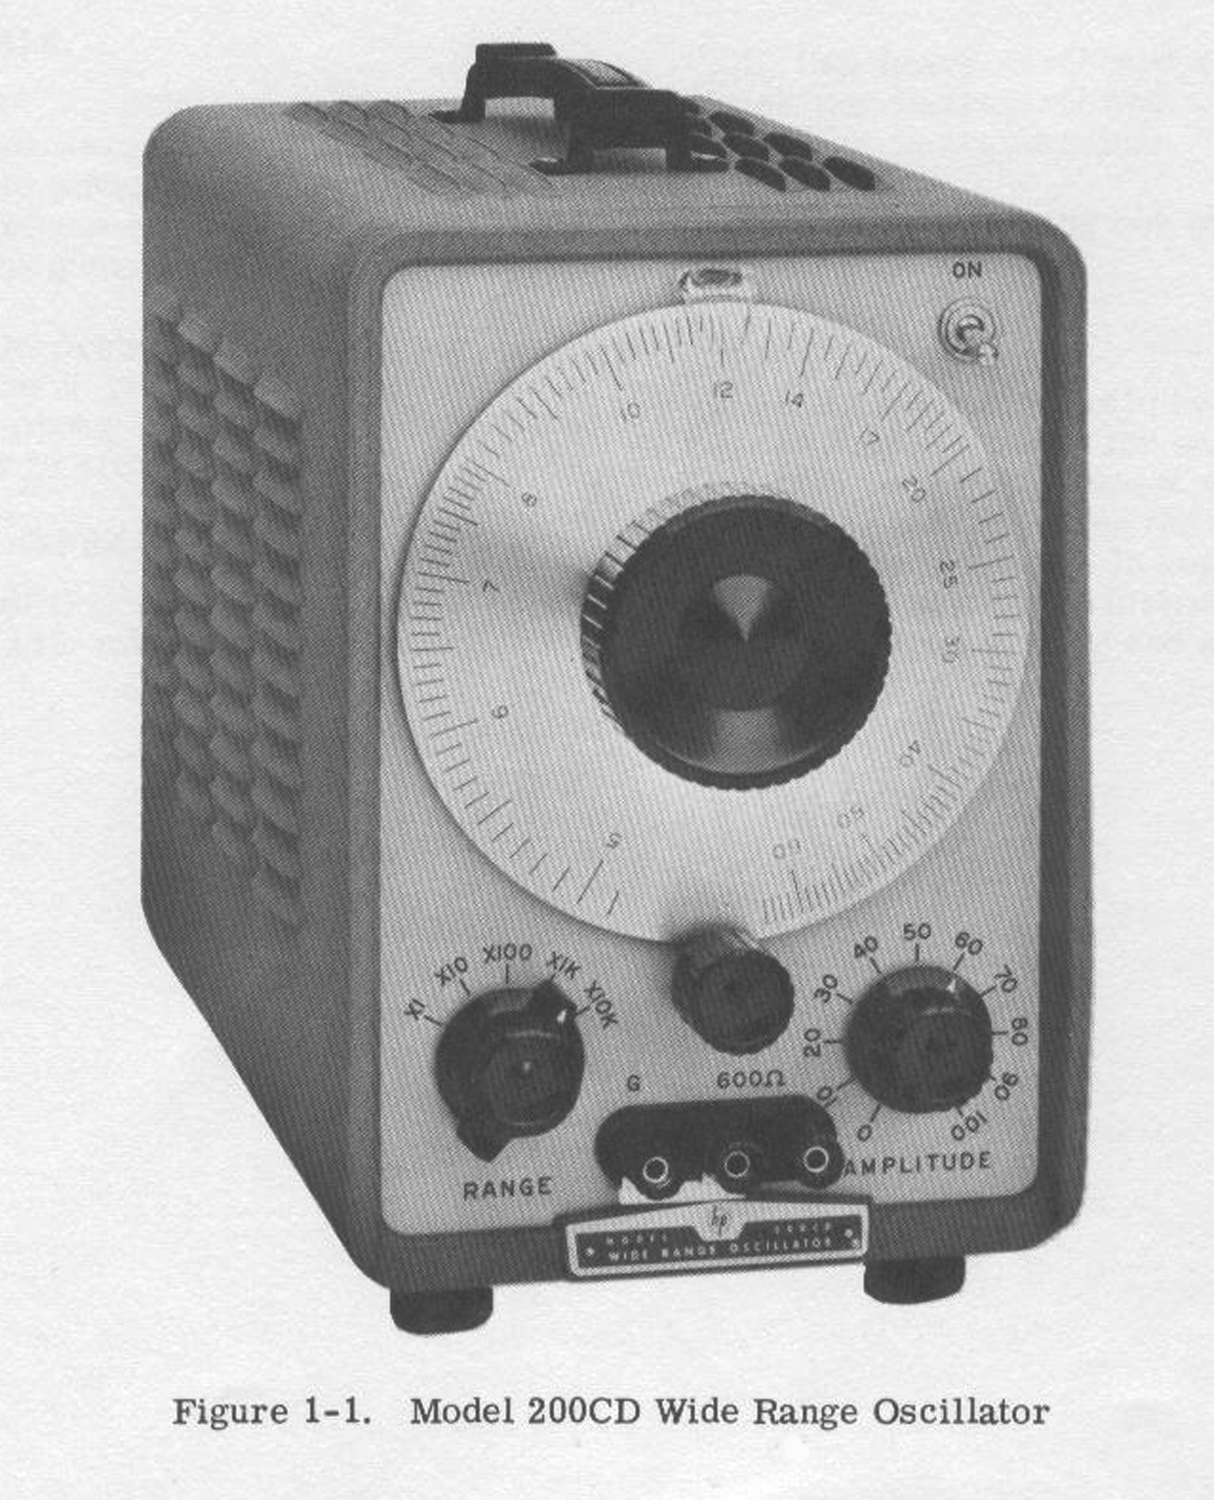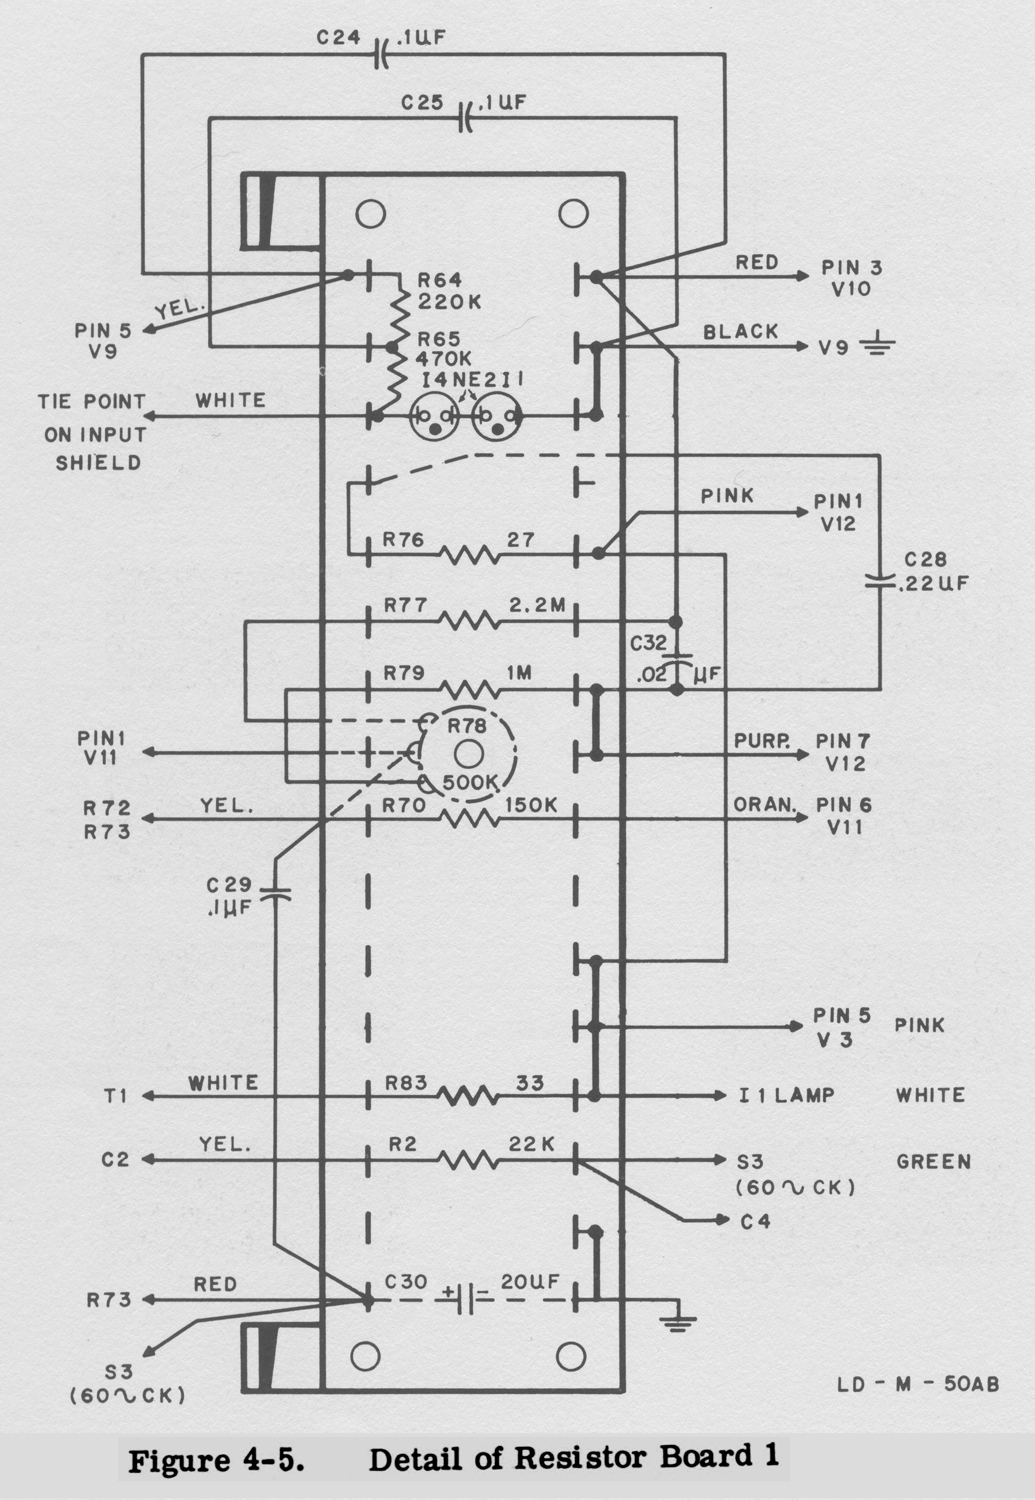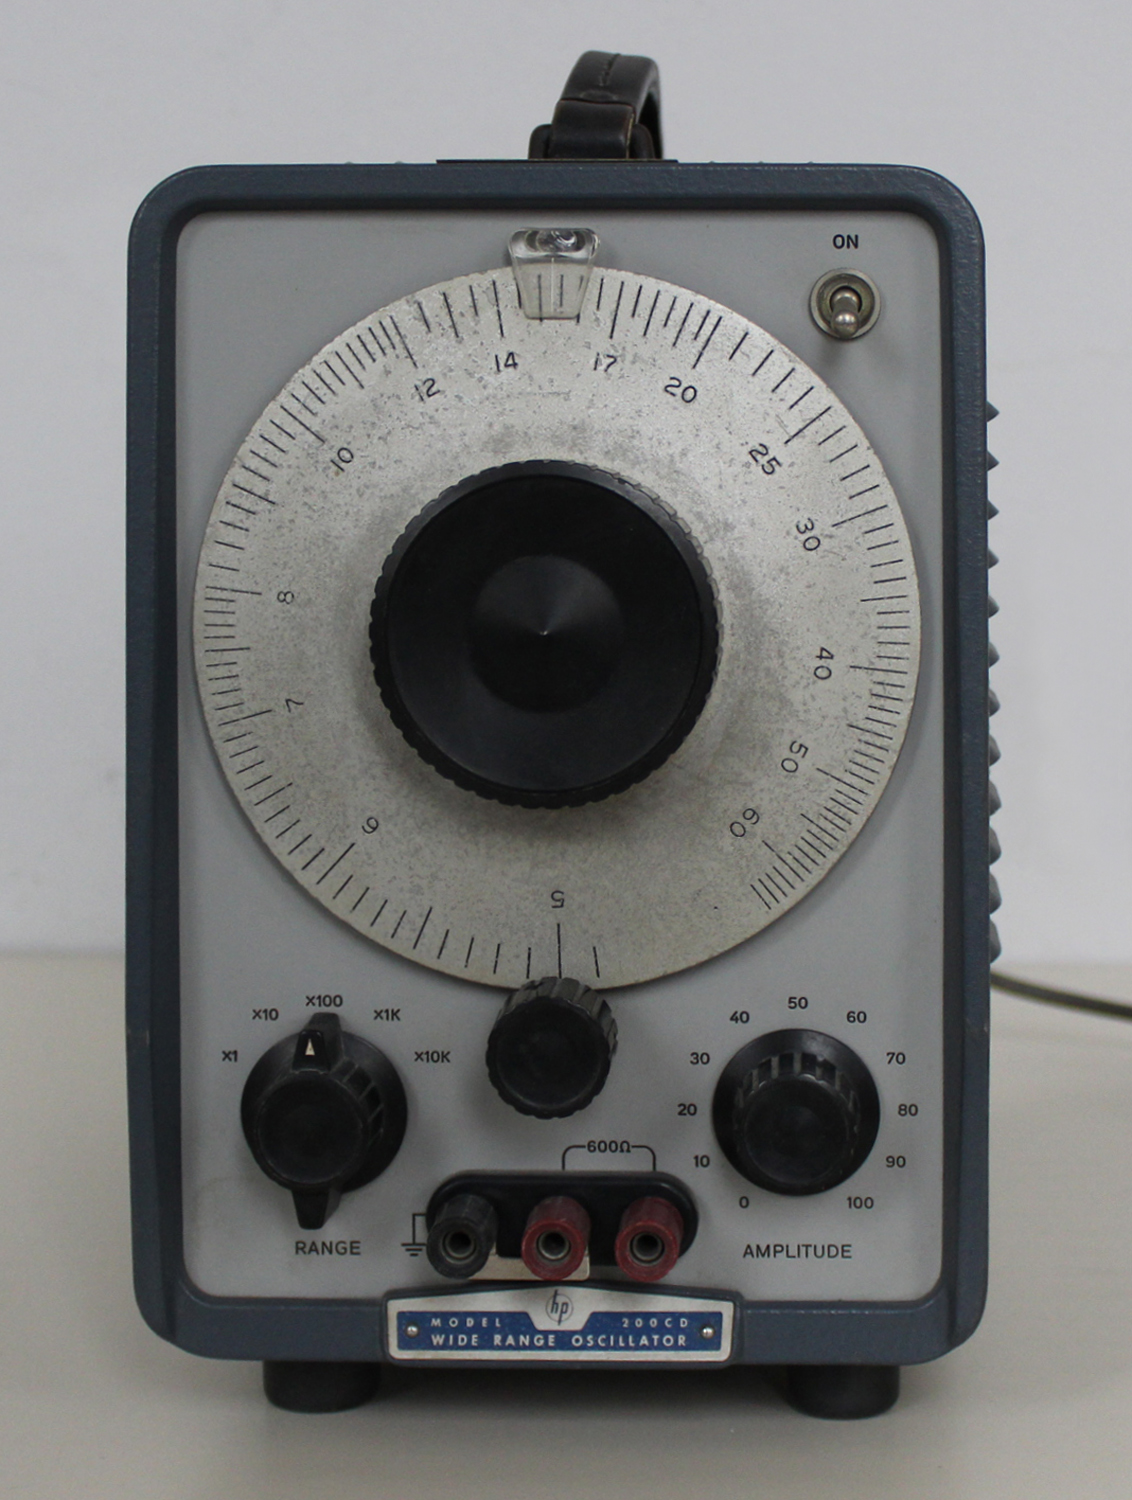
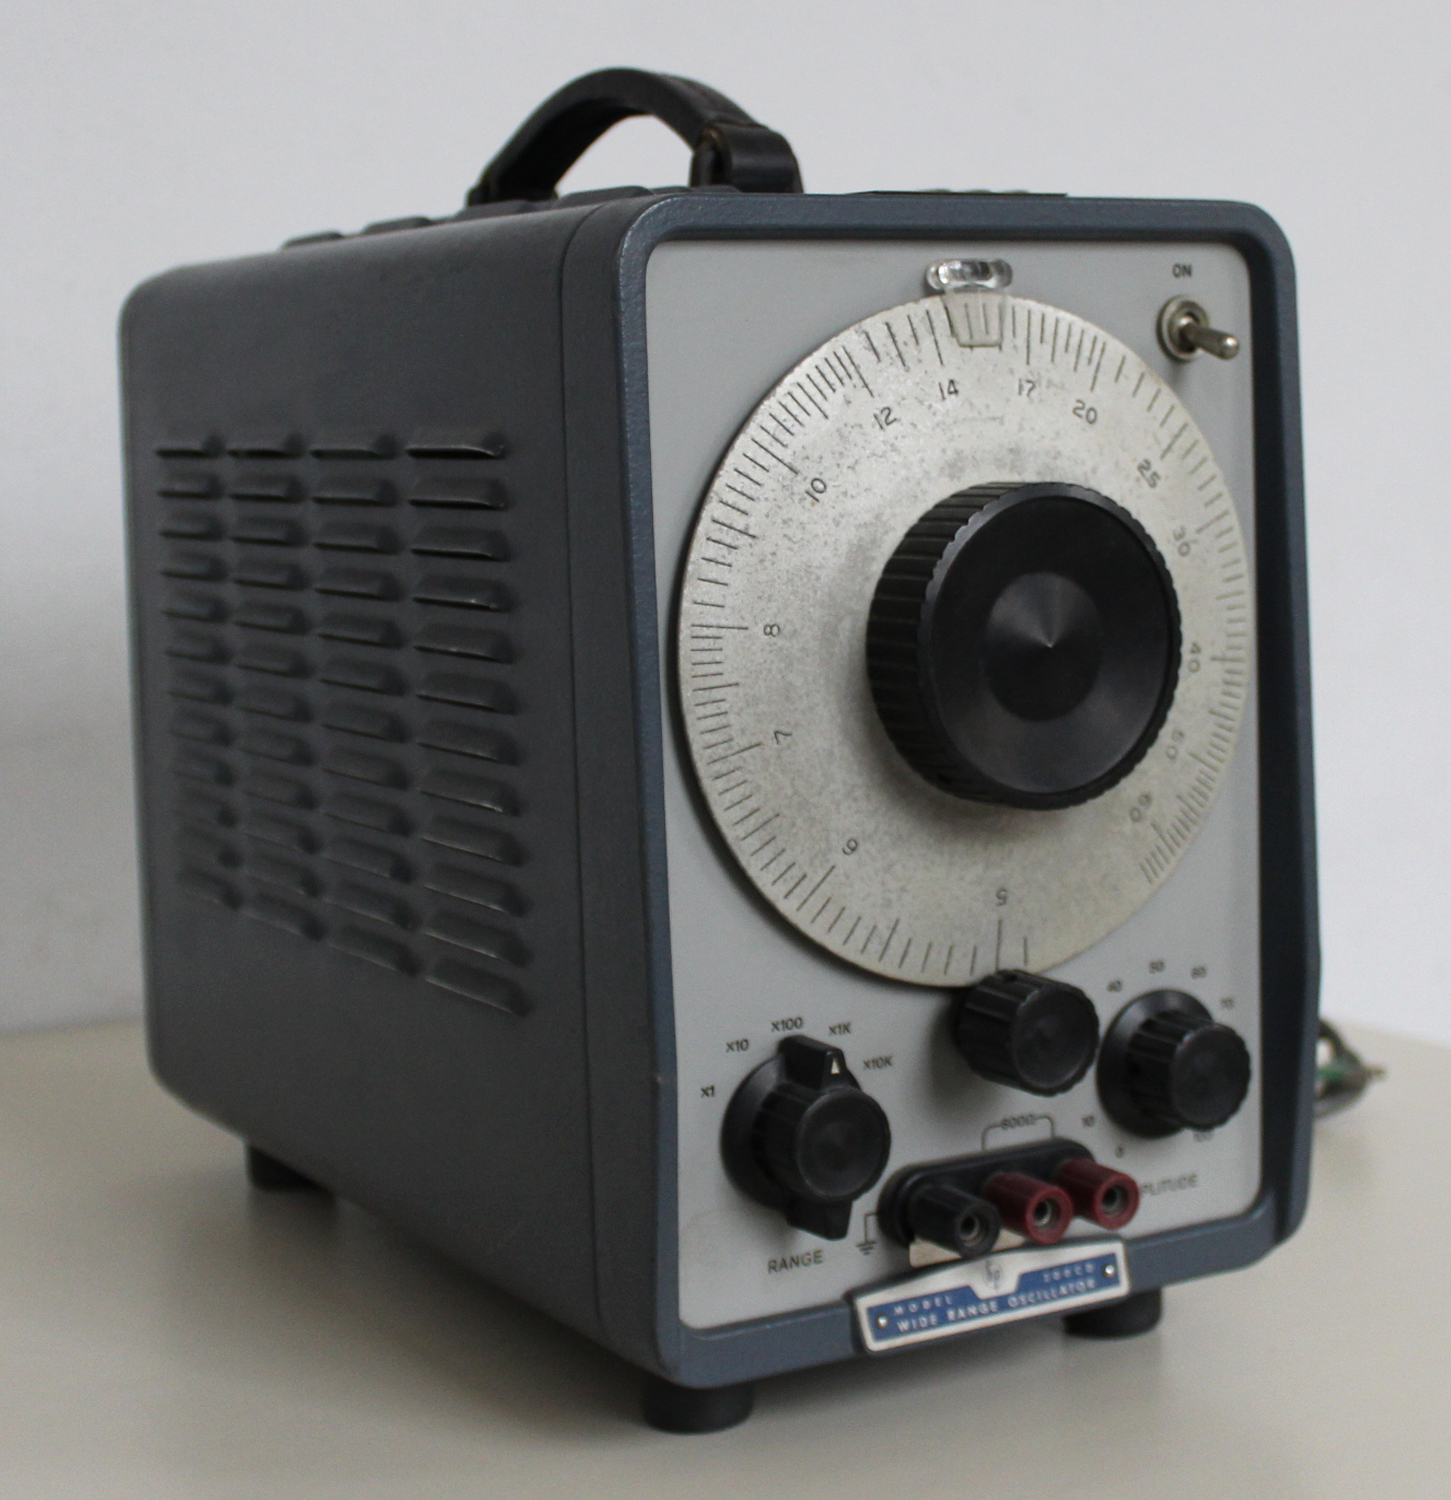
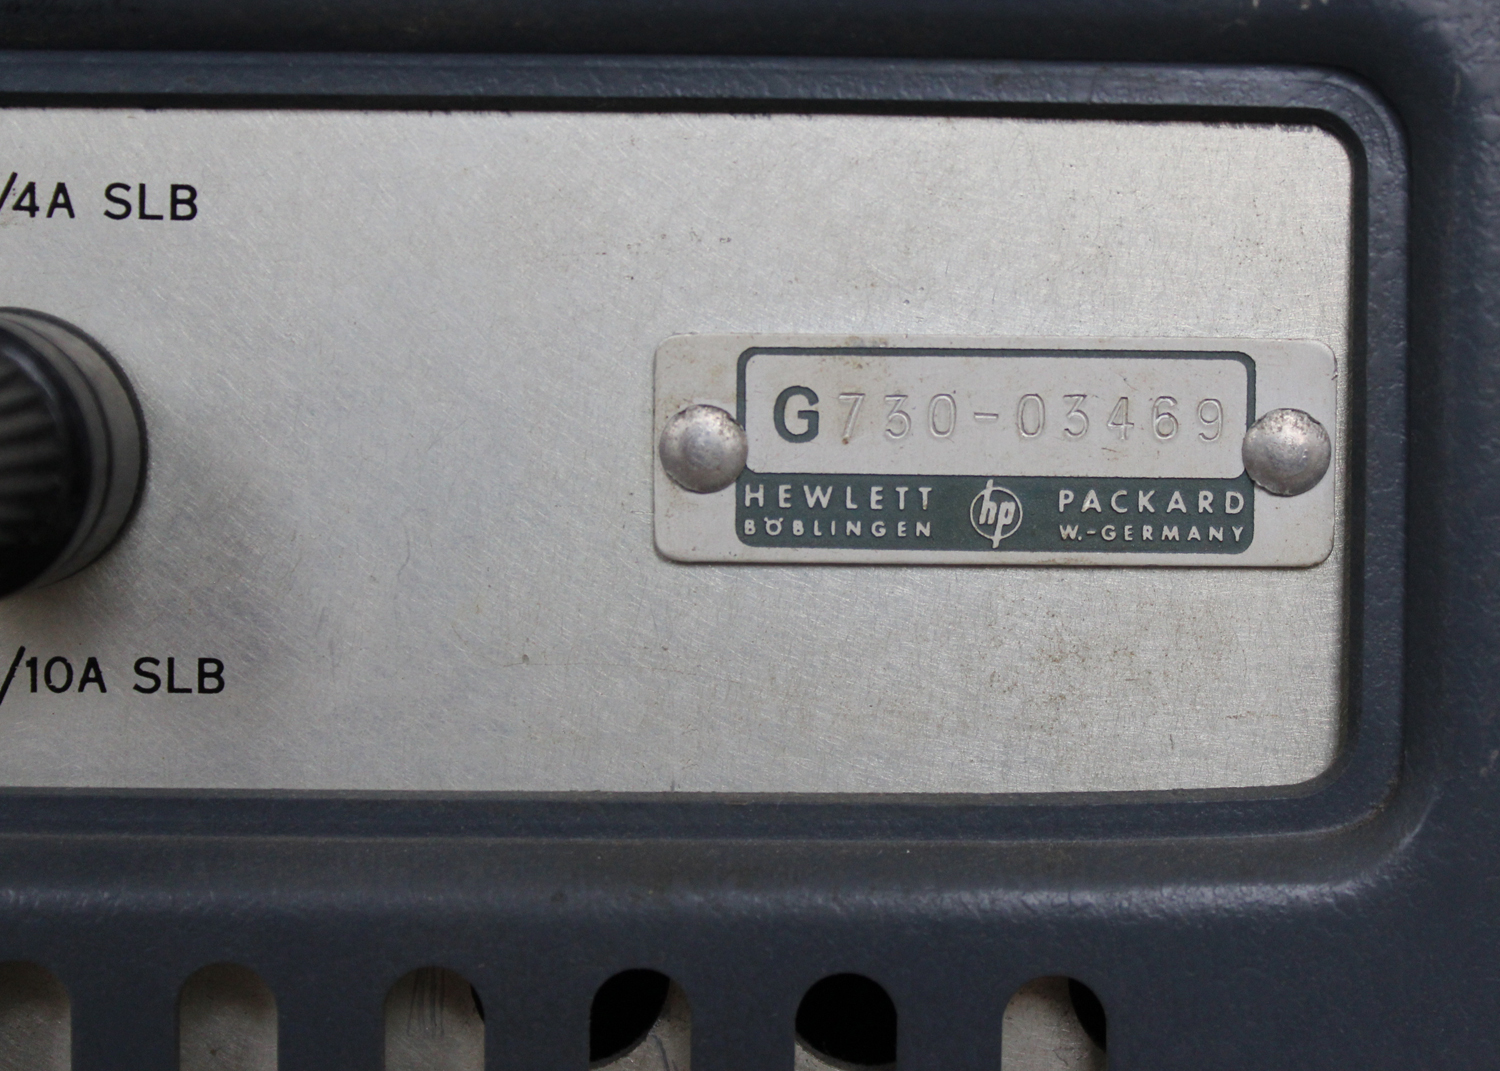
Wide Range Oscillator Hewlett Packard, mod. 200CD, matr. G 730-03469 (in italiano)


Wide Range Oscillator Hewlett Packard, mod. 200CD, matr. G 730-03469,W.-Germany, in italiano.
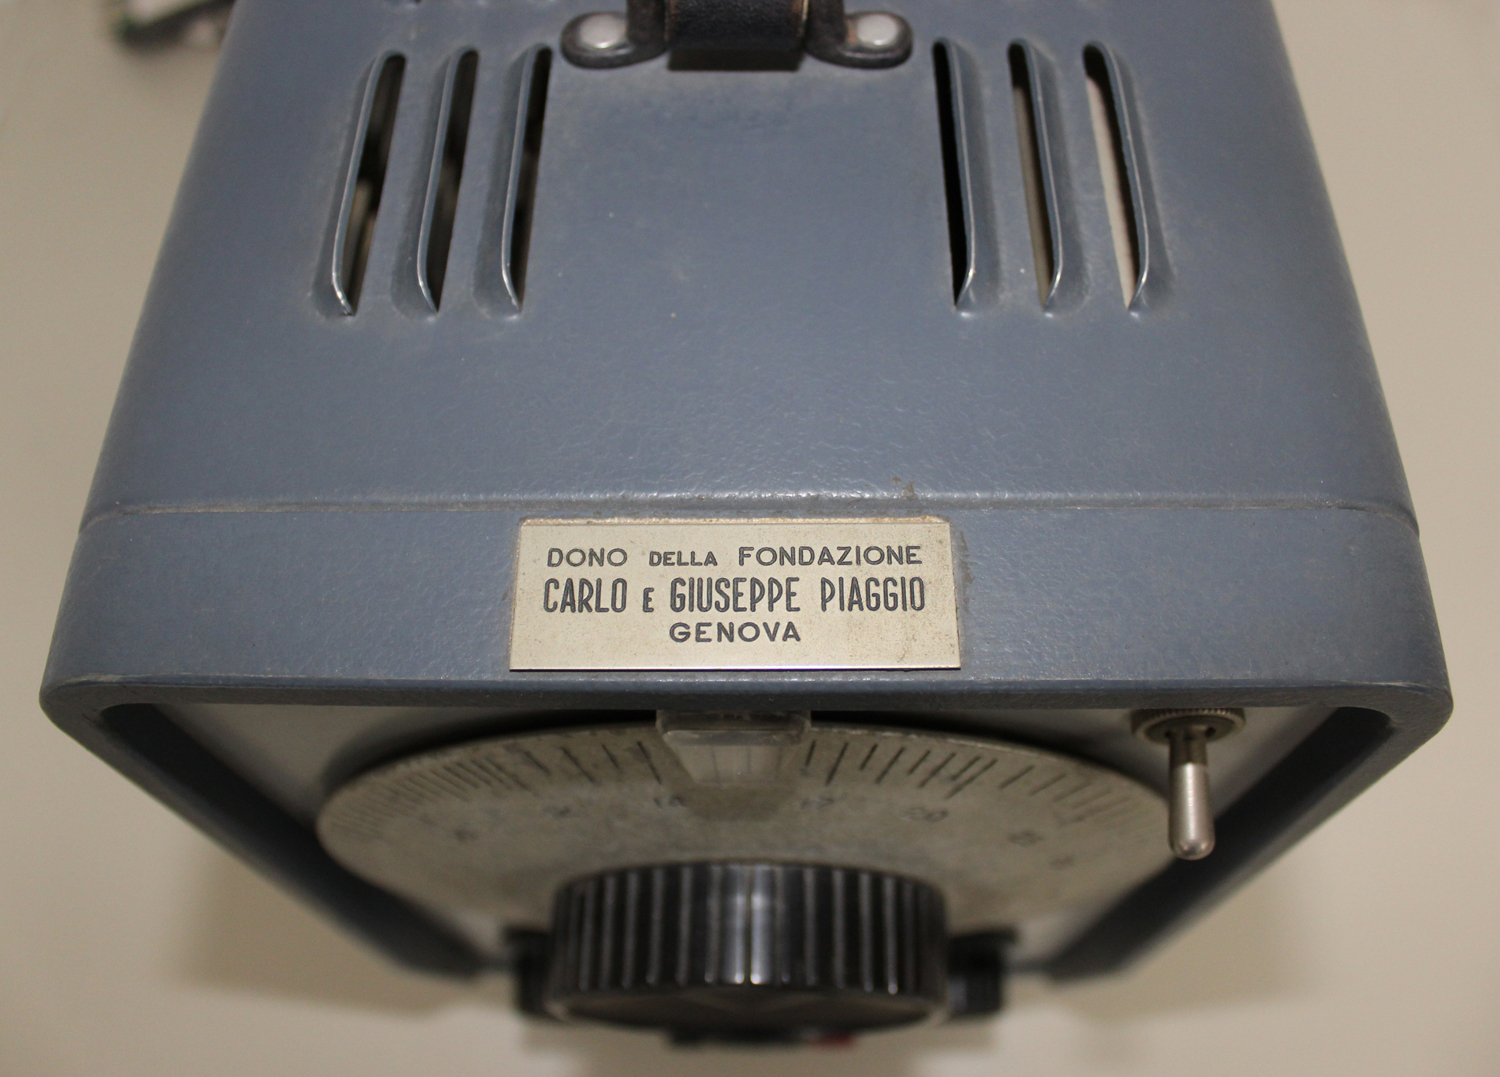
Dono della Fondazione Carlo e Giuseppe Piaggio – Genova.
Nell’estratto di inventario della Sezione Elettronica, in data febbraio 1968 al n° 198 si legge: “N° D 42324-35. Oscillatore 230 V  ( HP 200CD)”.
Mentre scriviamo questa scheda purtroppo non disponiamo dell’inventario generale D dell’epoca per ulteriori dettagli, ma sappiamo che gli esemplari acquistati erano due.
In internet si trova molta documentazione che riguarda lo strumento; per consultare il manuale di istruzioni si può andare all’indirizzo:
http://www.hparchive.com/Manuals/HP-200CD-Manual-SNP_605.PDF
Nella Sezione Elettronica sono custoditi sia due diversi manuali originali di istruzioni, sia una traduzione in italiano. Riportiamo qui solo alcune pagine delle istruzioni in italiano poiché  esse sono state tradotte da un manuale ancora diverso.
§§§

«OSCILLATORE A LARGA BANDA MOD. 200 CD
ISTRUZIONI PER L’IMPIEGO E LA MANUTENZIONE
(TRADUZIONE)
CARATTERISTICHE PRINCIPALI
Frequenza
Portata in frequenza:              da 5 Hz a 600 kHz in 5 portate
Graduazione del quadrante:    da 5 a 60
Portate:                                    ×1    da 5 a 60 Hz

                                                ×10   da 50 a 600 Hz

                                                ×100 da 500 Hz a 6 kHz

                                                × 1k  da 5 a 60 kHz

                                                ×10k  da 50 a 600 kHz
Precisione della calibrazione: ± 2% a temperatura ambiente normale, comprensiva dell’errore di taratura, riscaldamento e variazioni dovute all’invecchiamento delle valvole e dei componenti.
Risposta:                                   ± 1 dB sull’intera gamma di frequenza (riferimento 1 kHz).
Stabilità di frequenza:              variazioni della tensione di rete del ± 10% causano slittamenti insensibili nella frequenza di uscita.
Tempo di recupero:                 minore di 5 sec. Da 5 Hz a 600 kHz.
Potenza di uscita:
Potenza di uscita:                     160 mW (10V) su 600 ohm, 20 V a circuito aperto.
Distorsione:                               minore di 0,5% al di sotto di 500 kHZ; minore di 1% da 500 kHz in su. Indipendente dall’impedenza del carico.
Fondo e rumore:                         minore di 1% della potenza di uscita; diminuisce col diminuire della potenza di uscita.
Bilanciamento dell’uscita:        migliore di 0,1% sulle frequenze più basse e circa 1% su quelle più alte con il comando AMPLITUDE predisposto per la massima uscita. L’apparecchio può anche essere predisposto per il funzionamento sbilanciato.
Impedenza interna:                   600 ohm. Su posizione di massima uscita del comando AMPLITUDE, l’uscita è bilanciata verso massa.
Alimentazione:  115 o 230 V, ± 10%, 50-1000 Hz, consumo 95 W.
Dimensioni in pollici:
Tipo
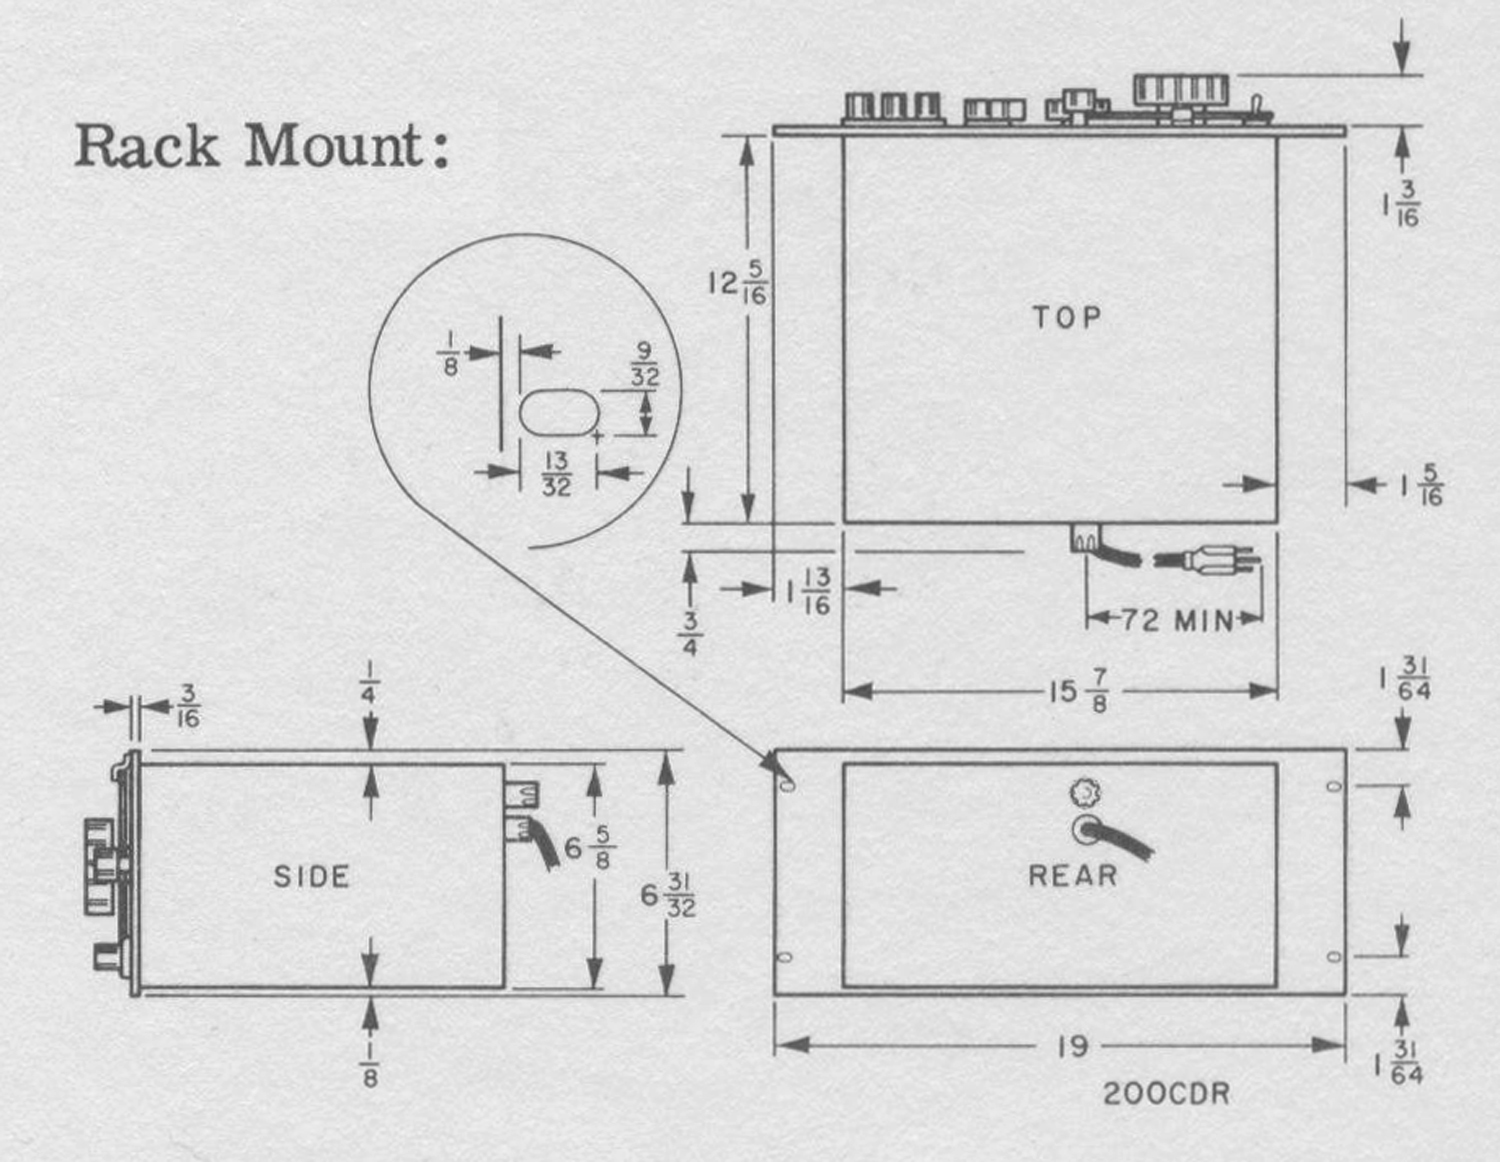
 In cofano: larghezza 7.½ ; altezza 11-½ ; profondità 14-½
Tipo per telaio: larghezza 19 ; altezza 7 ; profondità 14-¼
Profondità dietro il frontale: 13-¼
Peso in libbre:
Tipo in cofano: ca. 23. Peso di spedizione 29.
Tipo per telaio: ca. 27. Peso di spedizione 42.
SEZIONE I
DESCRIZIONE GENERALE
1.1 Generalità.
L’oscillatore a larga banda mod. 200CD genera frequenze di eccellente forma d’onda nelle bande sotto soniche, audio e supersoniche (da 5 Hz a 600 kHz in cinque portate decimali). L’apparecchio è stato costruito secondo i più moderni dettami della tecnica, la qual cosa gli conferisce prestazioni superiori ai tipi precedenti. Circuiti speciali assicurano una uscita a bassa distorsione e alta stabilità con qualsiasi impedenza di carico, da zero a circuito aperto. La flessibilità dell’oscillatore è stata incrementata rendendo il circuito d’uscita adatto a funzionamento sbilanciato e bilanciato e provvedendo un adattamento di impedenza di 600 ohm.
L’apparecchio è di facile impiego, la voluta ampiezza e frequenza si ottengono predisponendo i comandi che si trovano tutti sul pannello frontale. Il quadrante di frequenza è di facile definizione, ha un diametro di 6 pollici e uno sviluppo effettivo di circa 80 pollici. La graduazione si estende su un arco di 300°.
L’apparecchio fornisce fino a 10 V su di un carico di 600 ohm (20 V a circuito aperto) su qualsiasi frequenza compresa fra i 5 Hz e 600 kHz. La potenza d’uscita è controllata mediante un attenuatore variabile a ponte inserito nel circuito di uscita.
L’oscillatore mod. 200CD costituisce un flessibile generatore di segnali adatto per misure su sistemi vibratori e servo ripetitori, apparecchiature geofisiche ed elettromedicali, circuiti amplificatori audio, trasduttori, apparecchiature sonar e supersoniche, sistemi telefonici a frequenze vettrici e apparecchiature radio a bassa frequenza.
1-2 Cavo di alimentazione [Omissis…]
Il cavo di alimentazione a tre conduttori fornito con l’apparecchio è terminato con un connettore a tre piedini e posizione obbligata raccomandata dalla National Manufacturers’s Association. Il terzo piedino è di forma cilindrica ed è aggiunto ad una spina  standard a due lame. Quando la spina è usata unitamente ad una adatta presa di corrente il connettore cilindrico serve a mettere a massa l’apparecchio. Per impiegare questo connettore con una spina normale a due reofori soltanto, è necessario servirsi di un adattatore da tre piedini a due piedini.
1.3 e 1.4 [Omissis…]
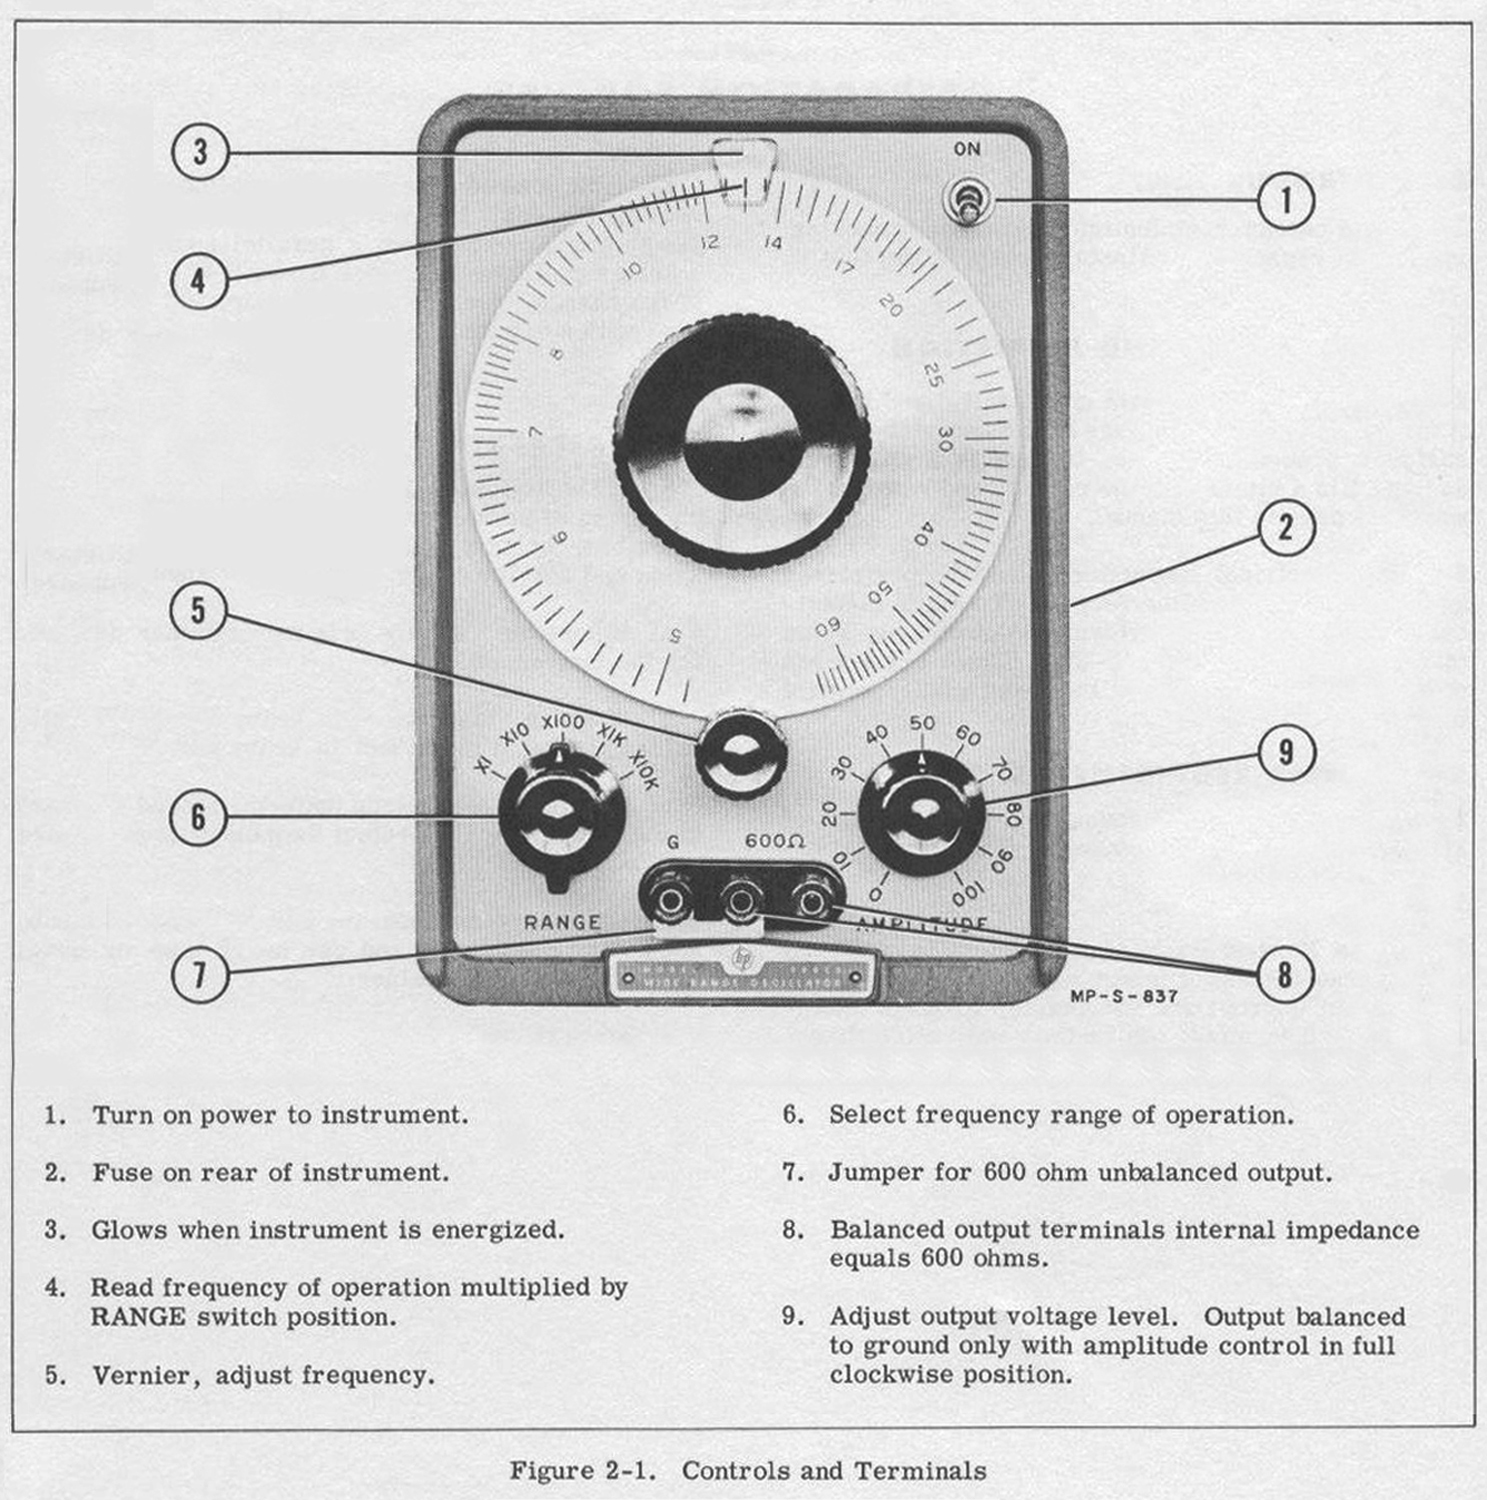
Fig. 2.1 Comandi e morsetti
[la numerazione è in ordine diverso così come la traduzione è diversa e forse si riferisce ad una figura leggermente diversa. N.d.R.]
– (7) Ponticello per uscita [sbilanciata da (N.d.R.)] 600 ohm sbilanciati.
– (6) Moltiplicatore per le portate di frequenza.
– (4) Lettura della frequenza da moltiplicarsi per il potere di moltiplicazione indicato dal commutatore in basso a sinistra.
– (3) Si illumina quando l’apparecchio è acceso.
– (2) Fusibile sul lato posteriore, 1 Amp. a lenta azione per rete 115 V.
– (1) Interruttore per l’accensione.
– (5) Verniero per la regolazione della frequenza.
– (9) Regolazione del livello d’uscita. Uscita bilanciata verso massa solo quando questo comando è girato completamente verso destra.
[ (8)  terminali di uscita bilanciata impedenza interna eguale a 600 ohm (N.d.R.)]
SEZIONE II
ISTRUZIONI PER L’IMPIEGO
2.1 Procedimento per l’impiego
a) Inserire la spina in una presa sede di tensione e frequenza adatte, [far] scattare l’interruttore di accensione su On ed attendere cinque minuti circa per il riscaldamento.
Nota – Se si adopera una sorgente di tensione 230 V, accertarsi che il trasformatore di alimentazione sia conseguentemente predisposto ( riferirsi allo schema elettrico) e che il fusibile sia da 0,5 Amp. A lenta azione. Prendere visione del paragrafo 4.12.
b) La frequenza della tensione di uscita si determina predisponendo il quadrante di frequenza  e ponendo il commutatore RANGE sulla adatta posizione. Per ottenere, ad esempio, una frequenza di 1 kHz all’uscita mettere il quadrante su 10 e il commutatore Range su X100 (10 X 100 = 1000 Hz).
c) Girare il comando AMPLITUDE sulla posizione 0. Collegare il carico ai morsetti d’uscita dell’apparecchio contrassegnati con 600 ohm. (Le connessioni sono discusse nel paragrafo 2.2).
L’oscillatore può essere connesso ad un carico di qualsiasi valore senza alterazione della forma d’onda d’uscita. Carichi con impedenza minore di 600 ohm diminuiranno la massima tensione di uscita; quelli maggiori di 600 Ohm l’aumenteranno. L’apparecchio può essere considerato coem un generatore a 20 V con una impedenza interna di 600 ohm.
d) Regolare il comando AMPLITUDE per la voluta tensione di uscita.
2.2. Commutazione del circuito di uscita.
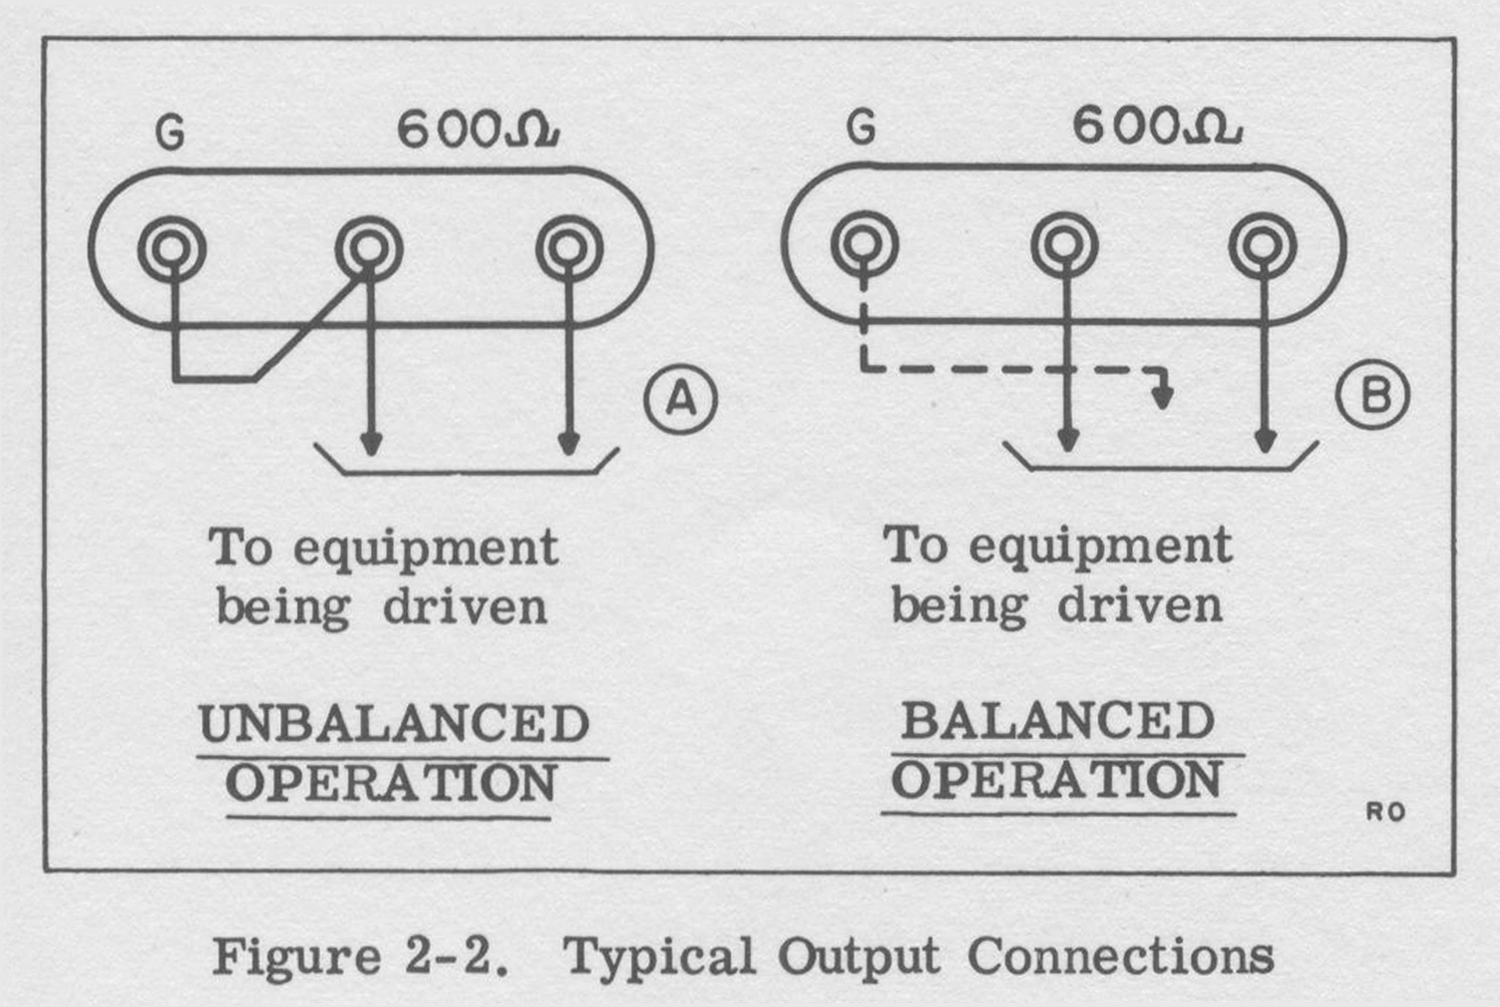
L’uscita dell’apparecchio 200CD può essere predisposta per funzionamento bilanciato e sbilanciato.Fig. 2.2 connessioni tipiche d’uscita A B – al carico
Funzionamento sbilanciato
Per il funzionamento con un capo a massa si pone il ponticello fra il terminale di sinistra G e quello centrale, come indicato in Fig. 2.2 A.
Funzionamento bilanciato
Le connessioni per il funzionamento bilanciato sono riportate in Fig. 2.2 B (la linea tratteggiata dal morsetto di massa indica il circuito di uscita bilanciato verso massa entro le tolleranze date prima).
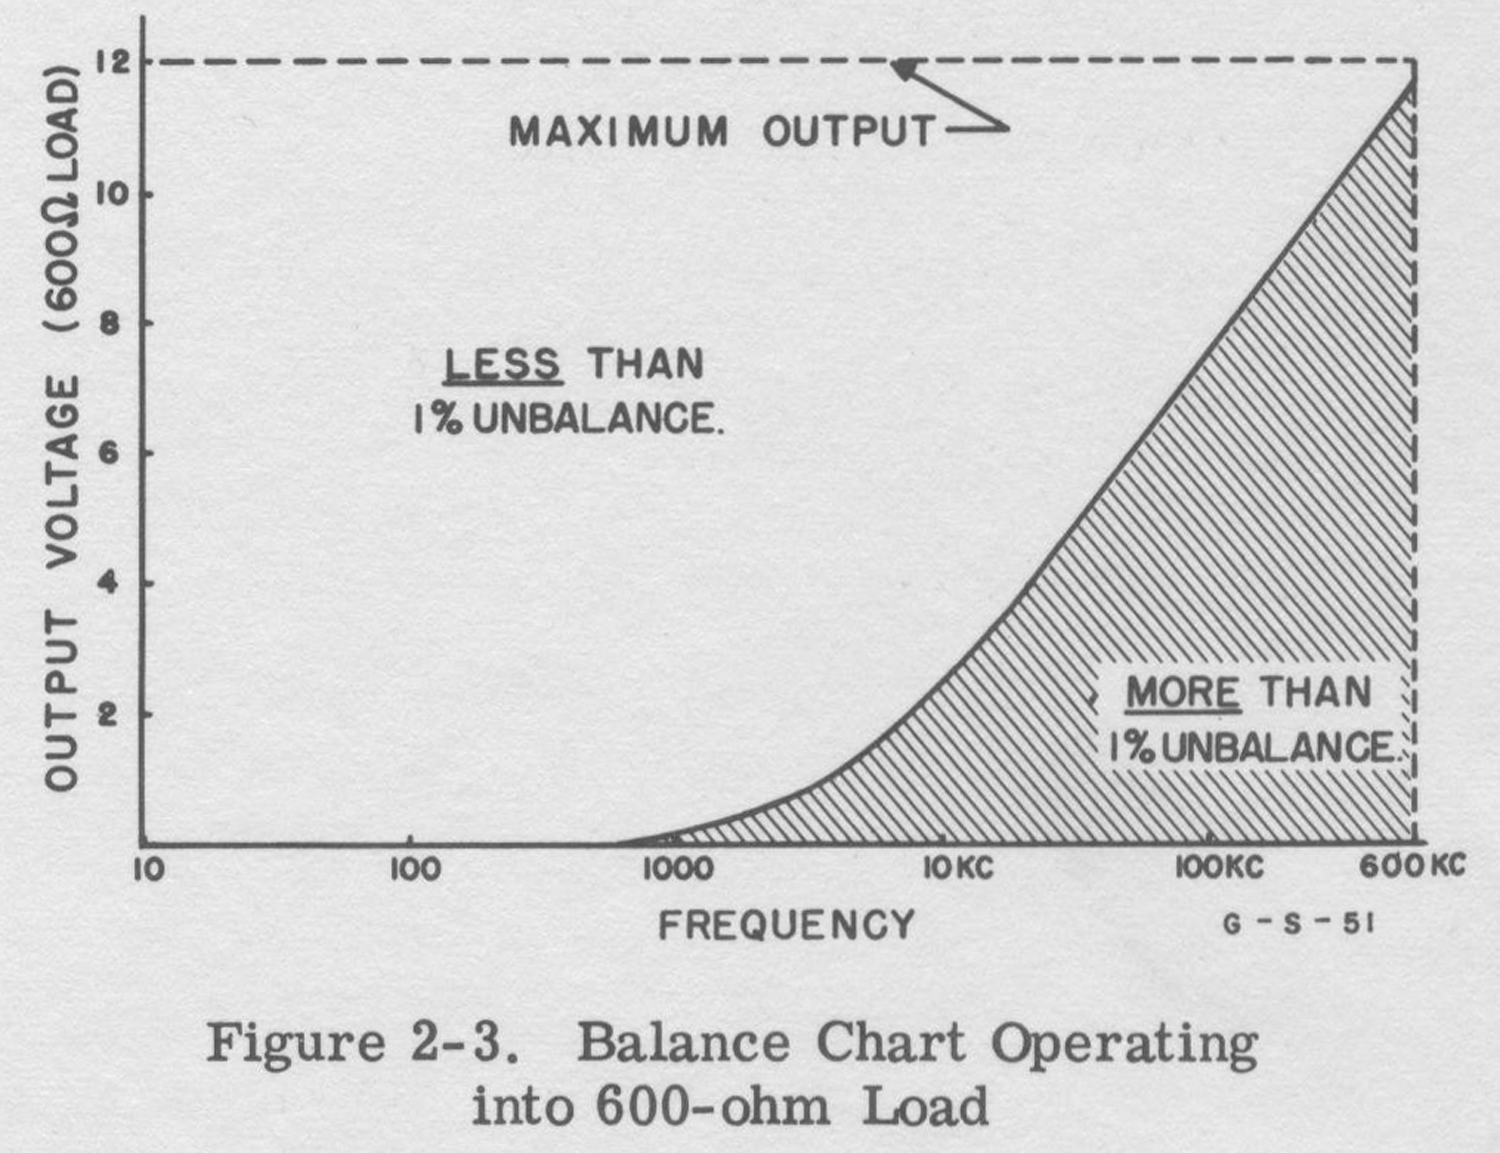
Il comando AMPLITUDE nel circuito d’uscita è costituito da un attenuatore a T a ponte. Esso sbilancia il circuito su tutte le posizioni meno su quella corrispondente alla minima attenuazione. Per il funzionamento bilanciato, quindi, questo comando deve essere messo sulla massima uscita (posizione estrema in senso orario). L’uscita bilanciata è anche funzione della frequenza a causa delle reazioni capacitive sulle più alte frequenze. Fino a 10 kHz lo sbilanciamento è minore dello 0,1% e a 600 kHz esso è circa 1%. Se si desiderano delle uscite di basso valore e se il bilanciamento alle più alte frequenze è critico, girare il comando AMPLITUDE direttamente in senso orario e inserire un attenuatore esterno, progettato per le frequenze in gioco, fra l’oscillatore e il carico. La curva che segue indica l’area entro cui  si può ottenere un bilanciamento dell’1%. La curva indica il bilanciamento che si può ottenere alle varie posizioni del comando AMPLITUDE con carico 600 ohm. Per carichi diversi da 600 ohm la curva non può essere applicata direttamente, ma fa predisporre il comando sulla posizione che darebbe la tensione voluta se il carico fosse 600 ohm; Fig. 2.3 Curva di bilanciamento per funzionamento su 600 ohm.SEZIONE III
FUNZIONAMENTO
3.1 Generalità
L’oscillatore a larga banda mod. 200CD impiega un circuito oscillatorio bilanciato in push-pull, da cui l’uscita è presa direttamente, evitando così le complicazioni e le possibili distorsioni che servirebbero dall’impiego di un amplificatore separatore. La reazione del carico sull’oscillatore è eliminata con l’ausilio di uno stadio di uscita  [ad (N.d.R.)] impedenza zero di [sorgente(N.d.R.)]. Questo montaggio da per risultato un circuito semplice e privo di disturbi, a bassa distorsione e alta stabilità sull’intera gamma di frequenza.
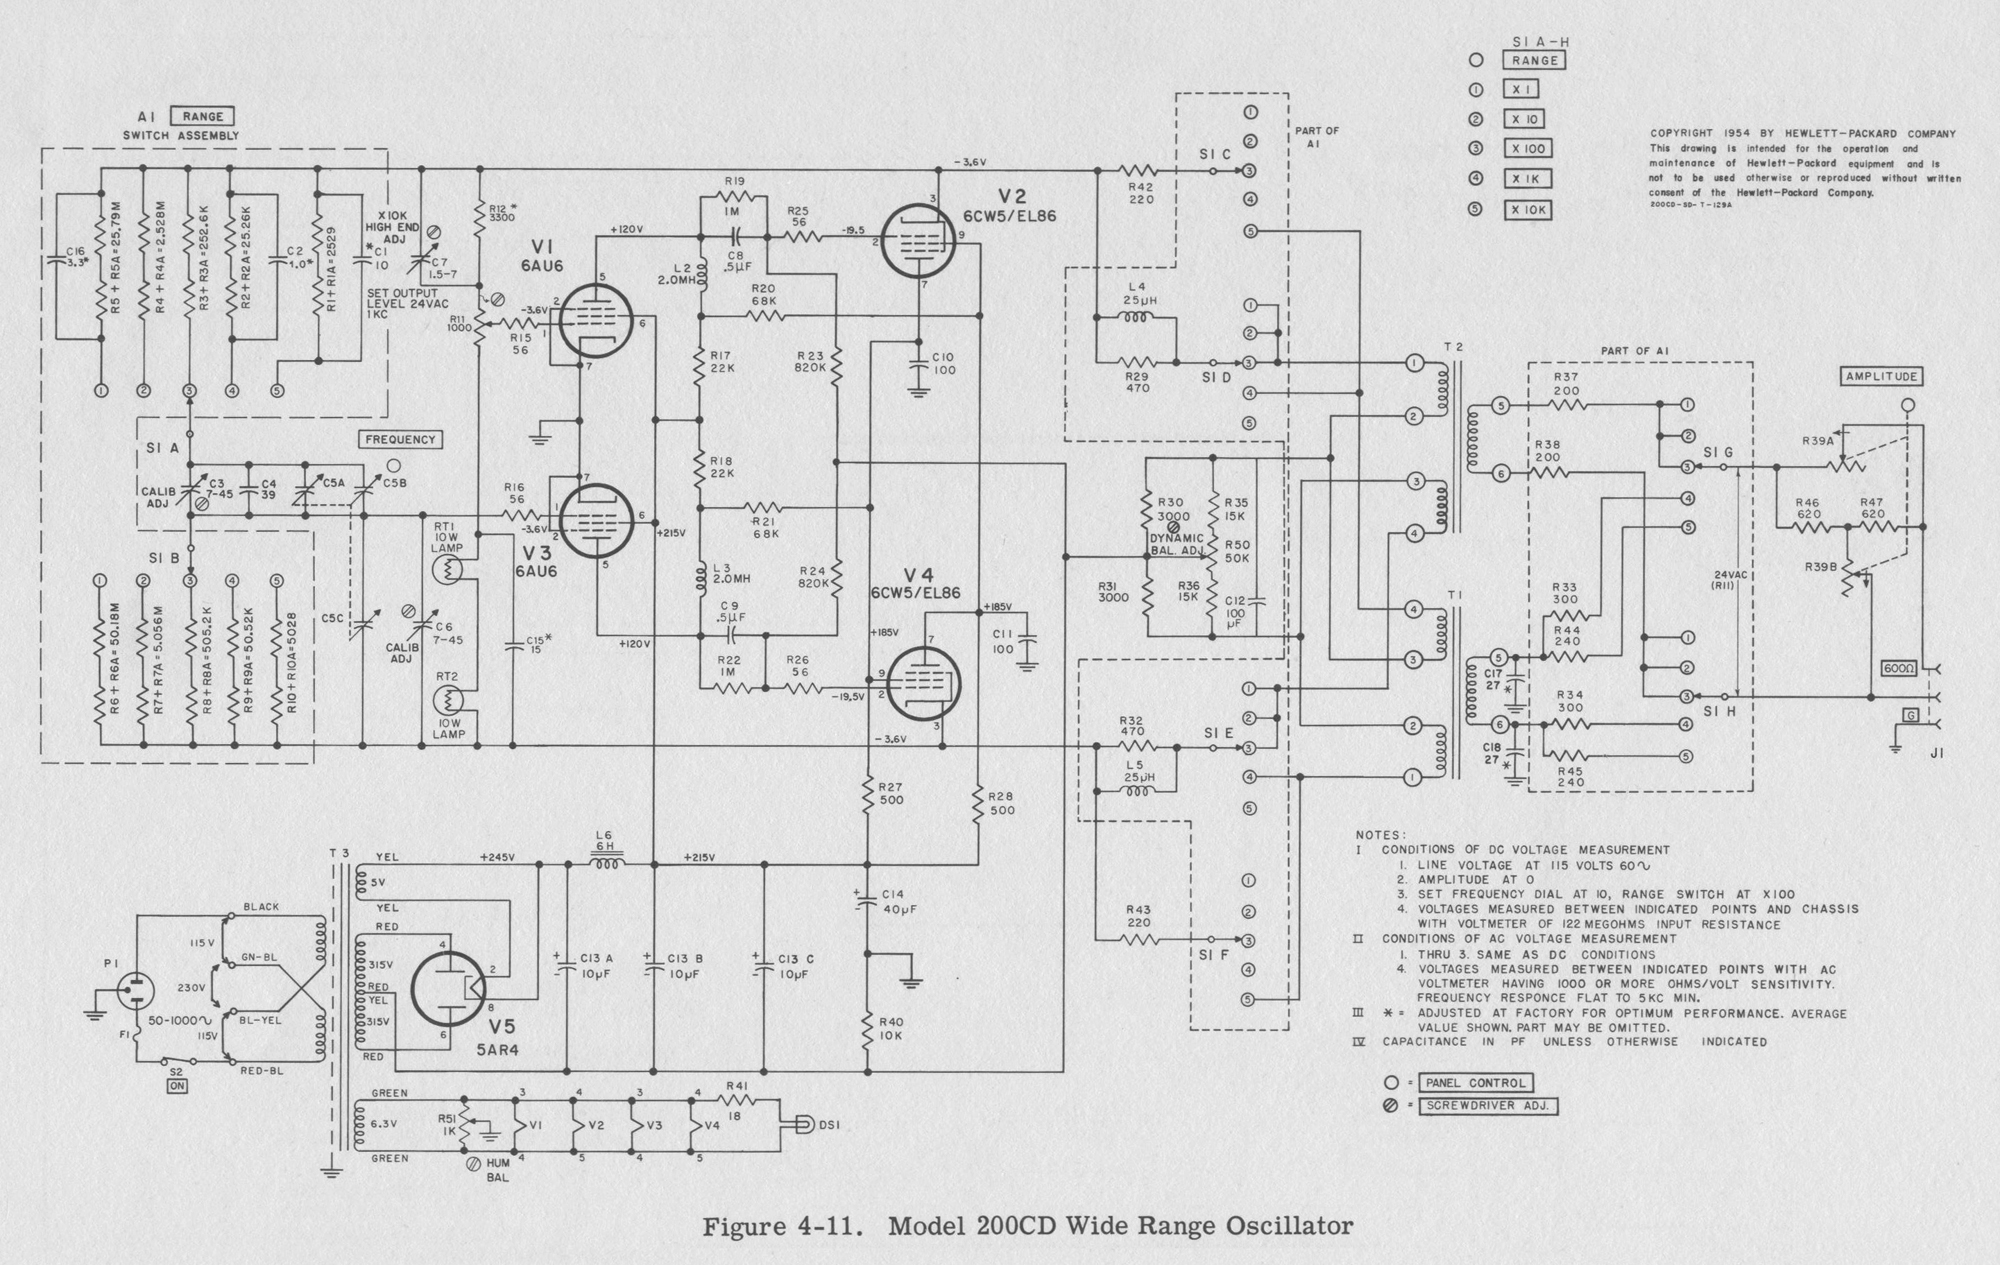
Funzionalmente, i circuiti dell’oscillatore comprendono un ponte per il controllo della frequenza con amplificatore bilanciato in controfase che costituisce il circuito  oscillatorio, uno stadio di uscita predisponi bile per funzionamento bilanciato o sbilanciato e una sezione per l’alimentazione. Queste diverse unità sono riportate nello schema a blocchi di fig. 3.1  e in quello elettrico generale.
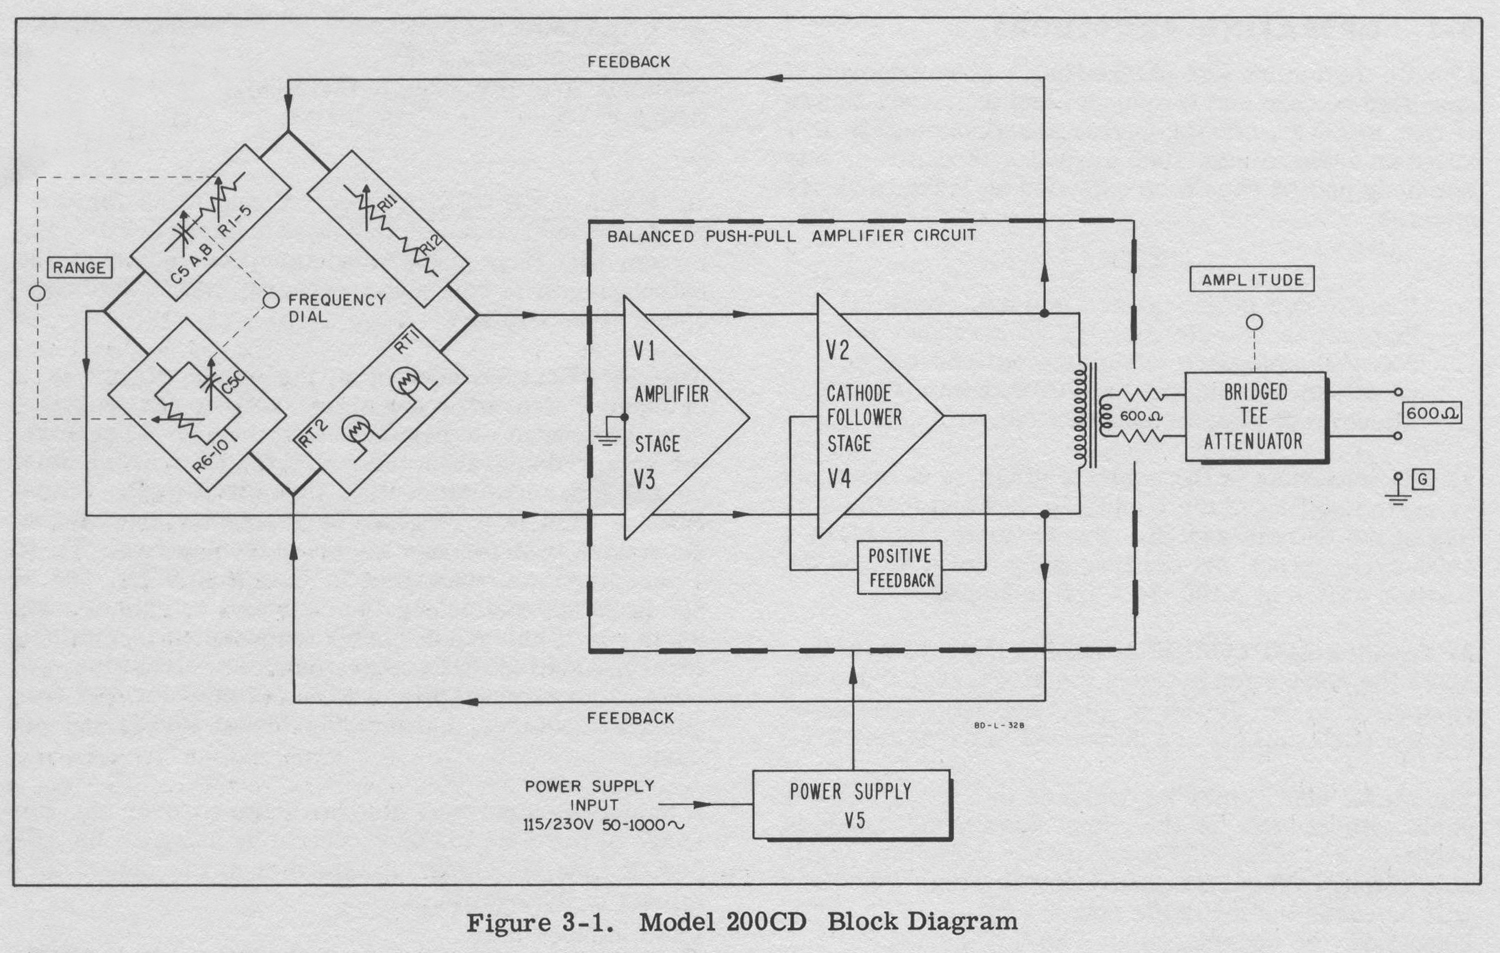
Fig 3.1 Schema a blocchi dell’oscillatore 200CD
Range switch = commutatore di portata
Frequency dial = Quadrante delle frequenze
Balanced …. Circuit = Amplificatore in push-pull bilanciato
Power supply= Alimentazione
Feedback = Reazione
3.2 Ponte per il controllo della frequenza
Il circuito per il controllo della frequenza è montato a ponte simmetrico verso massa. Senza alcuna connessione con la massa a nessun capo del ponte, la stabilità della calibrazione è assicurata poiché qualsiasi capacità distribuita o concatenamento con la massa presente ai terminali di uscita del ponte non shuntano né il ramo per il controllo della frequenza né quello per la stabilizzazione dell’ampiezza. I componenti per il controllo della frequenza (rete RC comandata dal commutatore di portata e dalla manopola per il movimento del quadrante) comprendono due rami del ponte, mentre quelli per la stabilizzazione dell’ampiezza (un partitore di tensione che include una resistenza a sensibilità termica) sono montati negli altri due rami. L’ampiezza è stabilizzata ad un livello tale da far lavorare le valvole amplificatrici prevalentemente sulla porzione lineare delle loro caratteristiche, la qual cosa, insieme alla elevata controreazione alle frequenze armoniche, produce una oscillazione perfettamente sinusoidale.
Il ponte è alimentato dalla tensione bilanciata sviluppata ai catodi della V2 e della V4 in uscita all’amplificatore bilanciato. L’uscita del ramo di controllo della frequenza del ponte è portata alla griglia della V3, e l’uscita di quello per la stabilizzazione dell’ampiezza alla griglia della V1. La possibilità di utilizzare insieme ad un amplificatore le caratteristiche di tensione e di fase in funzione della frequenza in una rete RC, per ottenere un oscillatore ad alta stabilità ed eccellente forma d’onda è ampiamente tracciata in molti testi, quale ad esempio “Electronic Measurements” di Termann e Pettit.
La resistenza variabile R11 serve alla regolazione del ramo per la stabilizzazione dell’ampiezza del ponte in caso di sostituzione delle lampade R13 o R14 che comporta una variazione nel livello di tensione mandato ai terminali di uscita.
I condensatori variabili C3, C6 e C7 sono regolati in fabbrica per il punto ottimo di calibrazione e costanza di ampiezza con la frequenza. Non sono richiesti ulteriori interventi su questo componente eccetto in caso di sostituzione del commutatore RANGE.
3.3 Amplificatore
L’amplificatore-oscillatore è costituito da un circuito in push-pull bilanciato comprendente uno stadio amplificatore di tensione (V1 e V3) e uno speciale stadio inseguitore catodico (V2 e V4). In questo stadio è usata una controreazione incrociata per provvedere una impedenza di uscita essenzialmente zero vista  fra catodo e catodo  e il carico. Il percorso della controreazione va dall’anodo della V2 alle griglie controllo e schermo della V4, e dall’anodo della V4 alle griglie controllo e schermo della V2. Il grado di reazione positiva è funzione del carico e aumenta col diminuire dell’impedenza di questo, [tendendo (N.d.R.)] quindi a mantenere costante l’uscita per qualsiasi impedenza di carico. L’auto-oscillazione dell’amplificatore è evitata mediante la scelta di un appropriato valore di resistenza nel circuito di reazione e controllando le impedenze di catodo e di placca sull’intera gamma di frequenza  dell’oscillatore. Lo stadio di uscita è protetto contro un eventuale corto circuito fra i catodi da alcune resistenze in serie con i secondari del trasformatore. Codeste resistenze presentano all’oscillatore una impedenza di 600 ohm verso l’attenuatore.
Lo stadio di uscita ha una sufficiente capacità da evitare sovraccarichi anche se i terminali di uscita sono in corto circuito. I condensatori C10, C11 e C12 e le bobine 12 e 13 fanno parte del circuito di compensazione di frequenza.
L’uscita dall’inseguitore catodico restituisce la reazione al onte di controllo della frequenza e alimenta l’avvolgimento primario dei trasformatori d’uscita che accoppiano l’oscillatore al circuito d’uscita.
3.4 Circuito d’uscita
Il trasformatore di accoppiamento fornisce un isolamento tra i circuiti oscillatorio e di uscita e permette di poter avere una uscita bilanciata o sbilanciata. Poiché un trasformatore singolo funzionerebbe in modo adatto solo su una parte  della banda coperta dall’apparecchio, è previsto un trasformatore doppio. I collegamenti fra l’inseguitore catodico V2 e V4  e il proprio trasformatore per la banda in uso sono effettuati con il commutatore RANGE. I secondari dei due trasformatori di accoppiamento alimentano un attenuatore a T convenzionale, la cui posizione è determinata dall’azione sul comando AMPLITUDE sul frontale. Girando questa manopola da destra verso sinistra, l’attenuazione introdotta dall’attenuatore aumenta. L’impedenza del generatore ai terminali di uscita è 600 ohm.
Con l’attenuatore predisposto per la minima attenuazione, il circuito di uscita è predisposto  per il funzionamento bilanciato. L’attenuatore è progettato in modo che per frequenze fino a 10 kHz la capacità parassita e la resistenza di concatenamento causano uno sbilanciamento minore di 0,1%. Lo sbilanciamento a 600 kHz è ca. 1%.
Quando si desidera il funzionamento sbilanciato, bisogna collegare la massa a morsetto centrale di uscita e la terminazione per la connessione prelevata dal terminale 6 dei trasformatori di uscita T1 e T2. Il funzionamento  non sarà regolare se la massa è connessa al lato del circuito che include l’attenuatore».
§§§
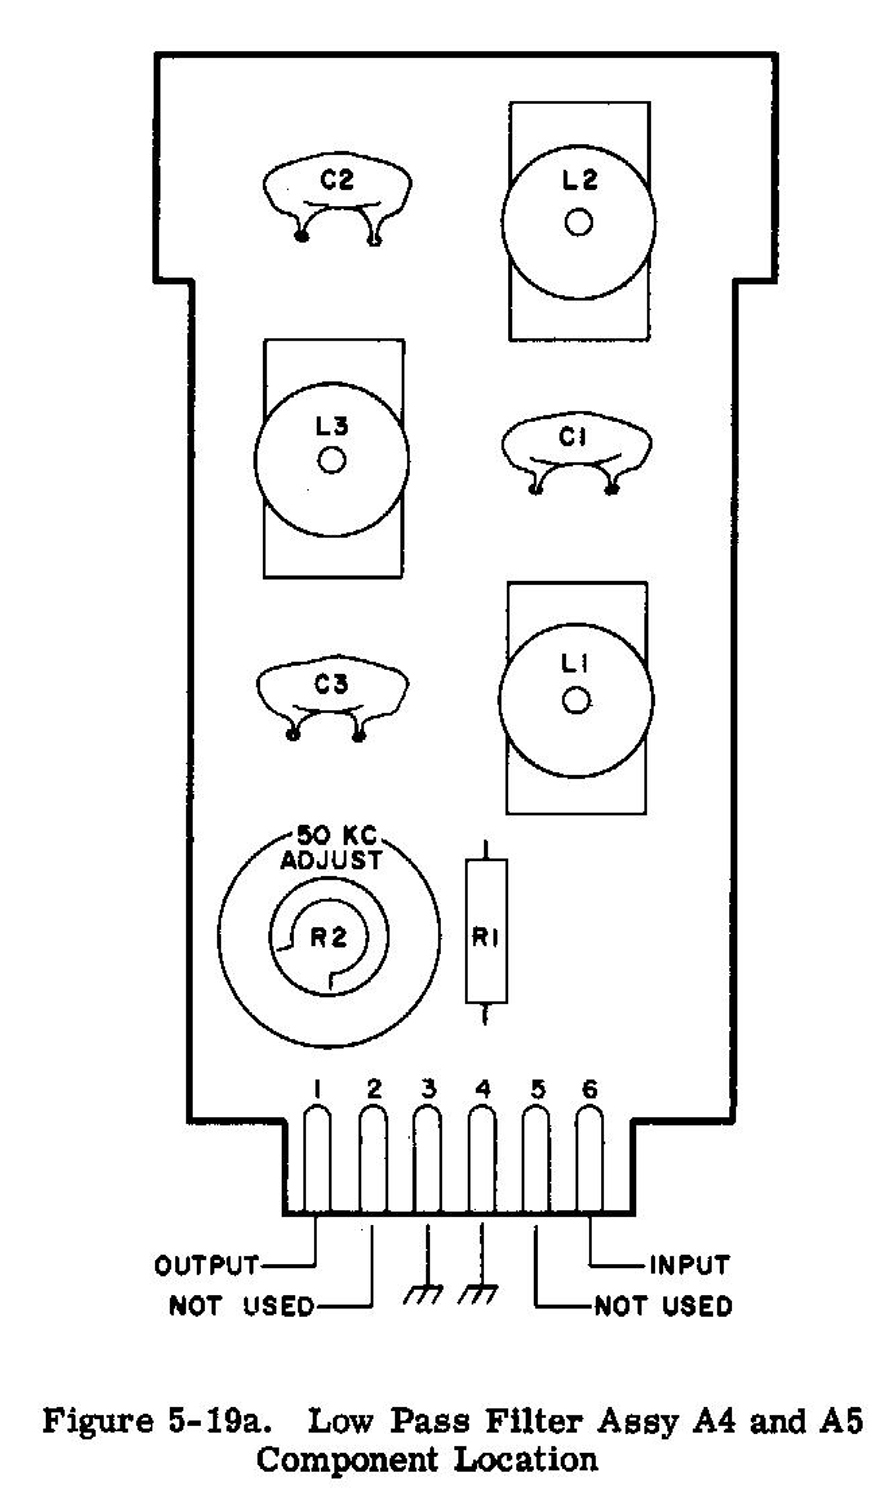
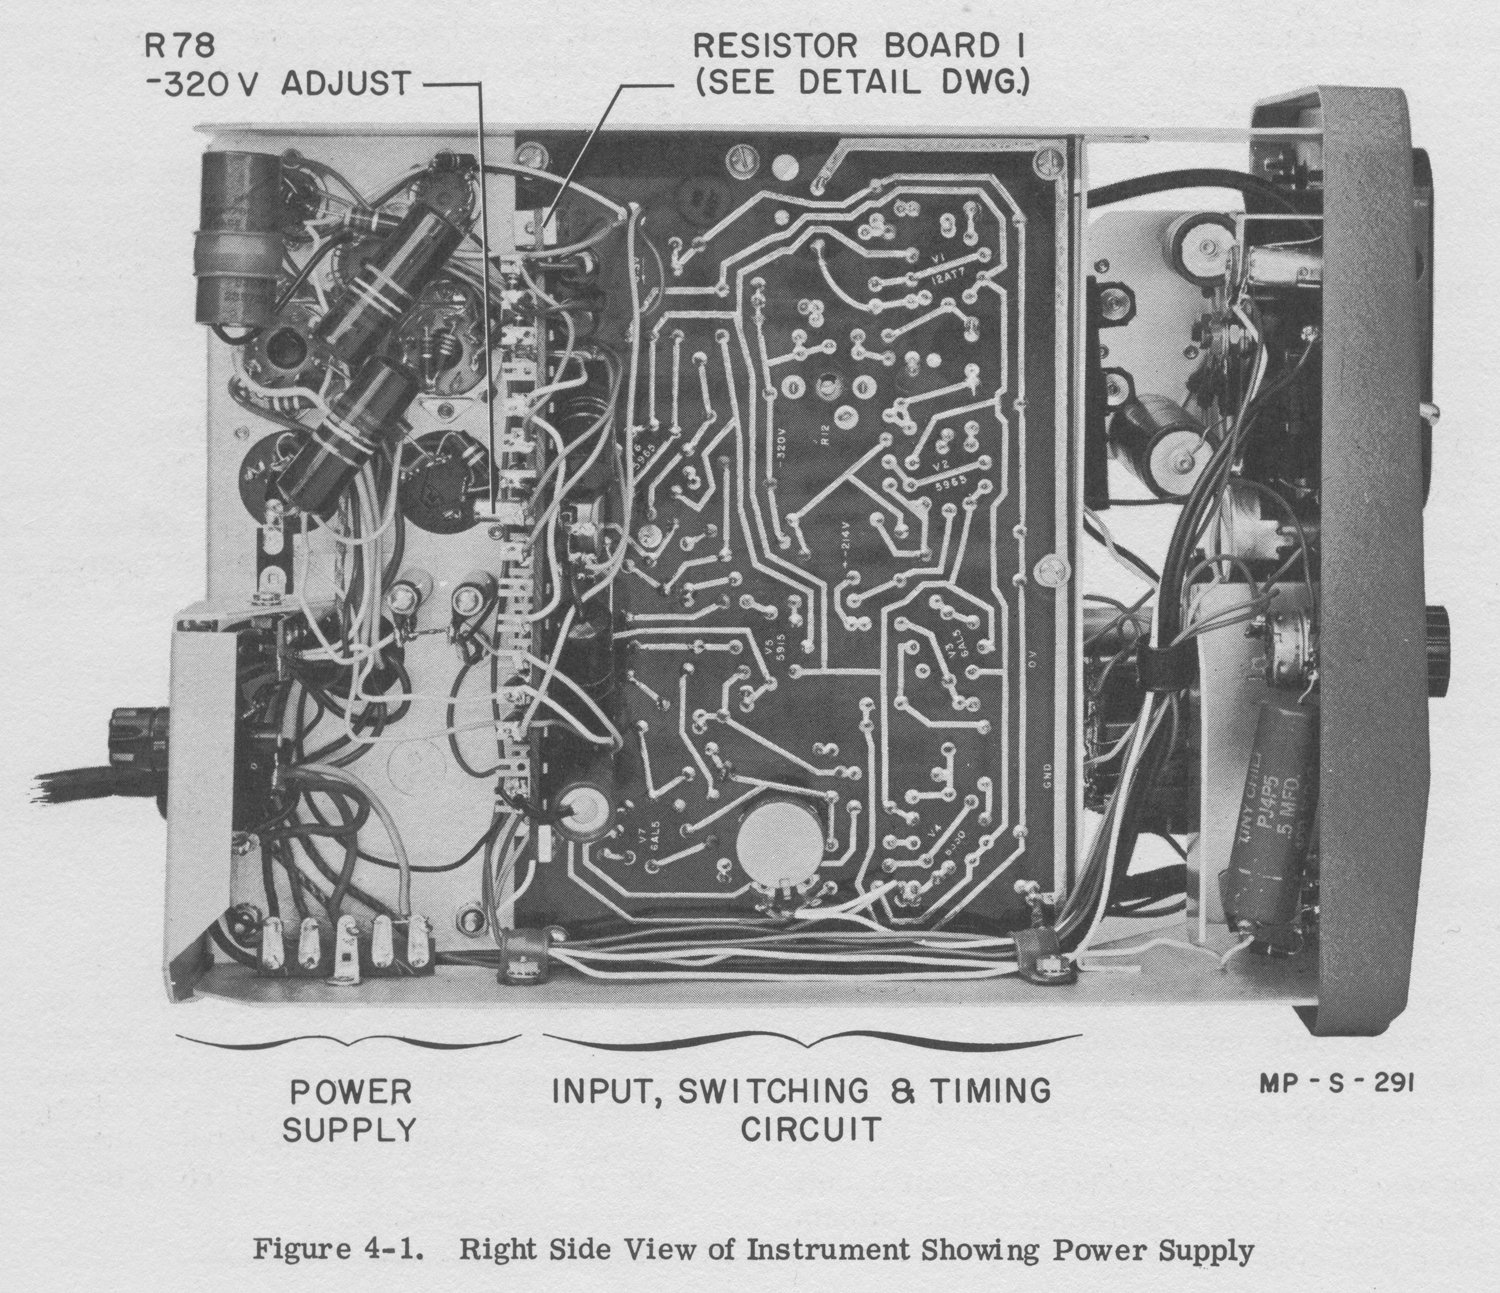
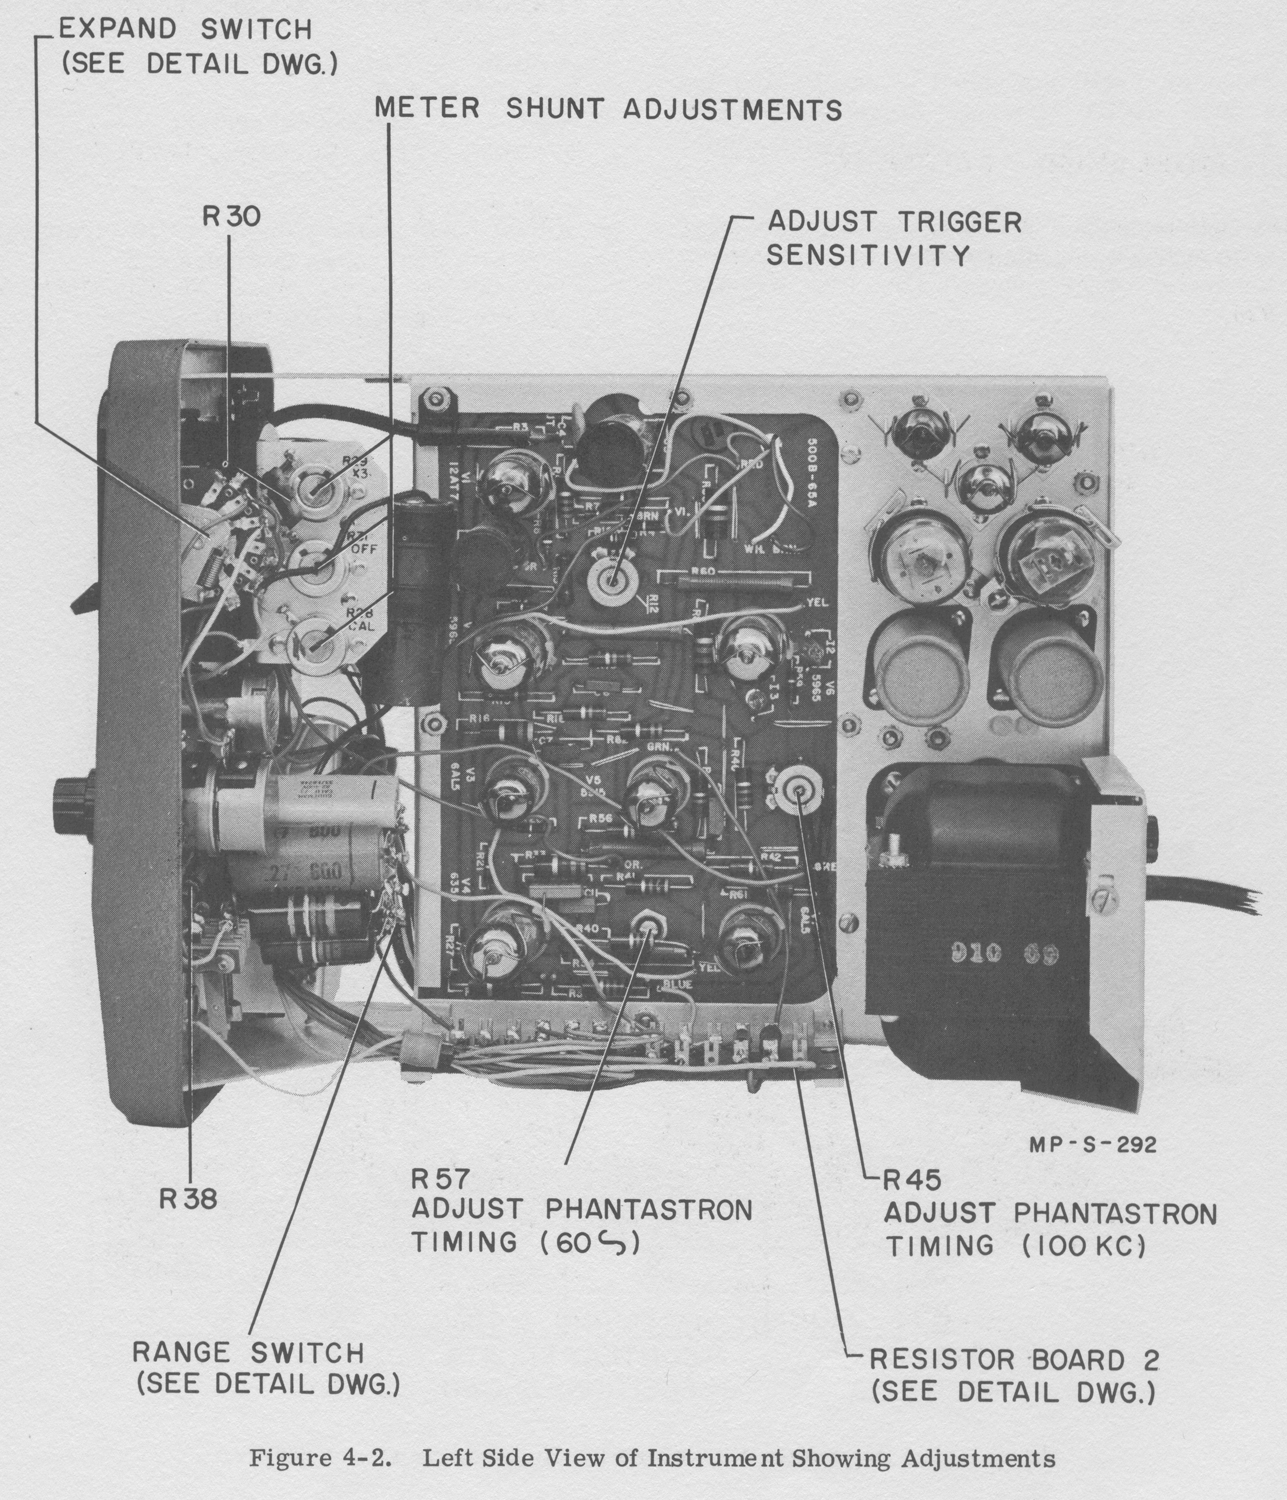
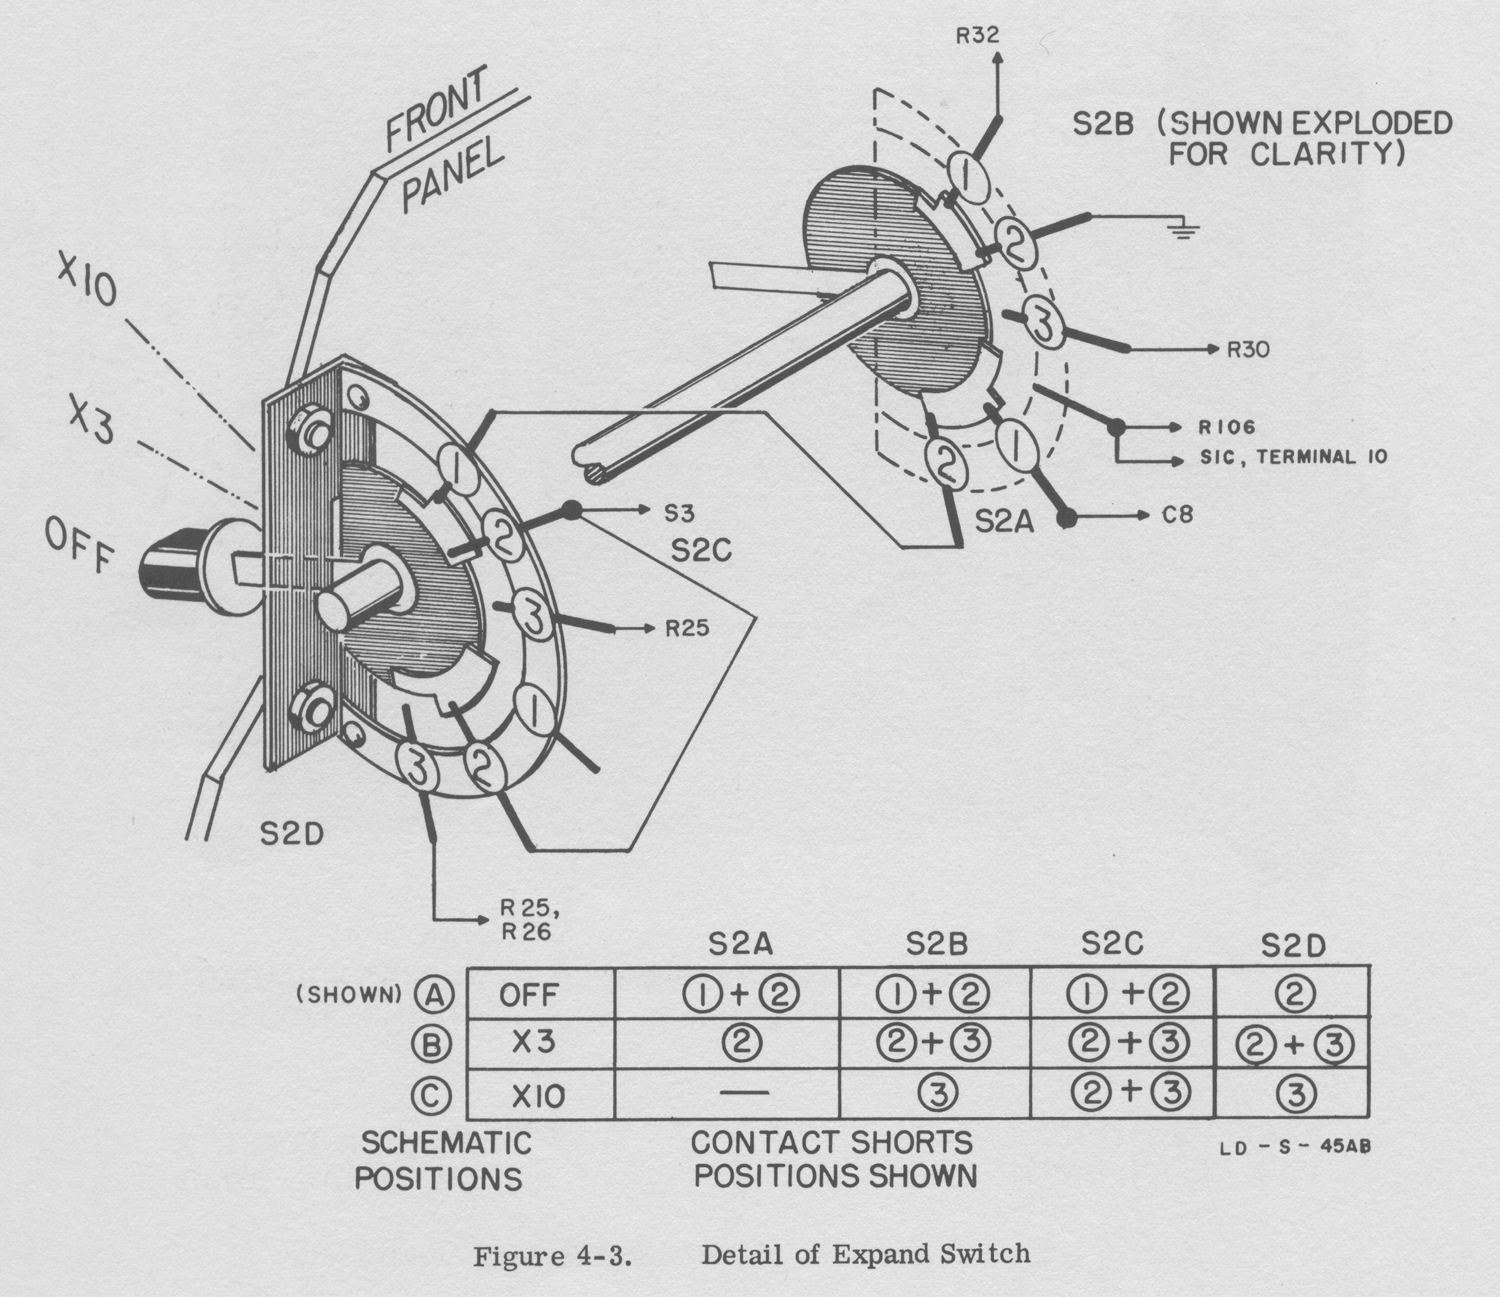
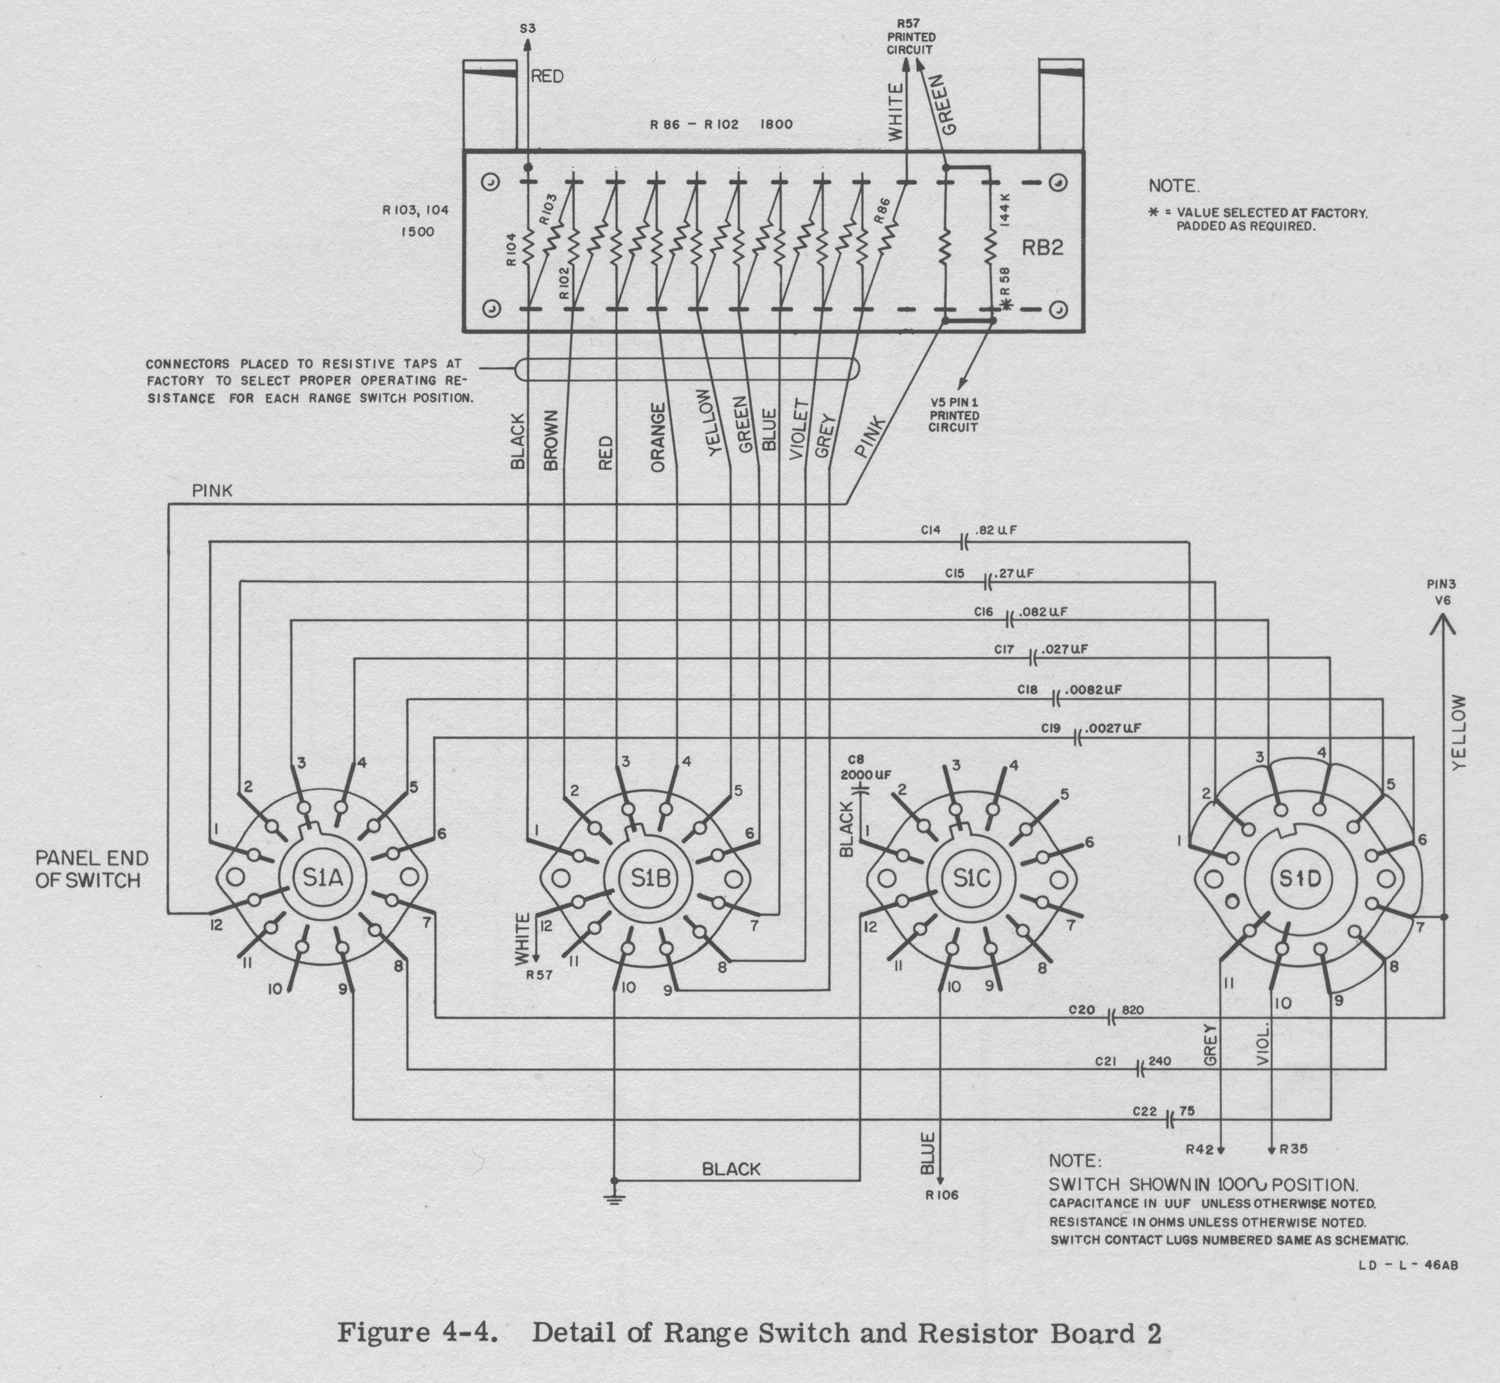
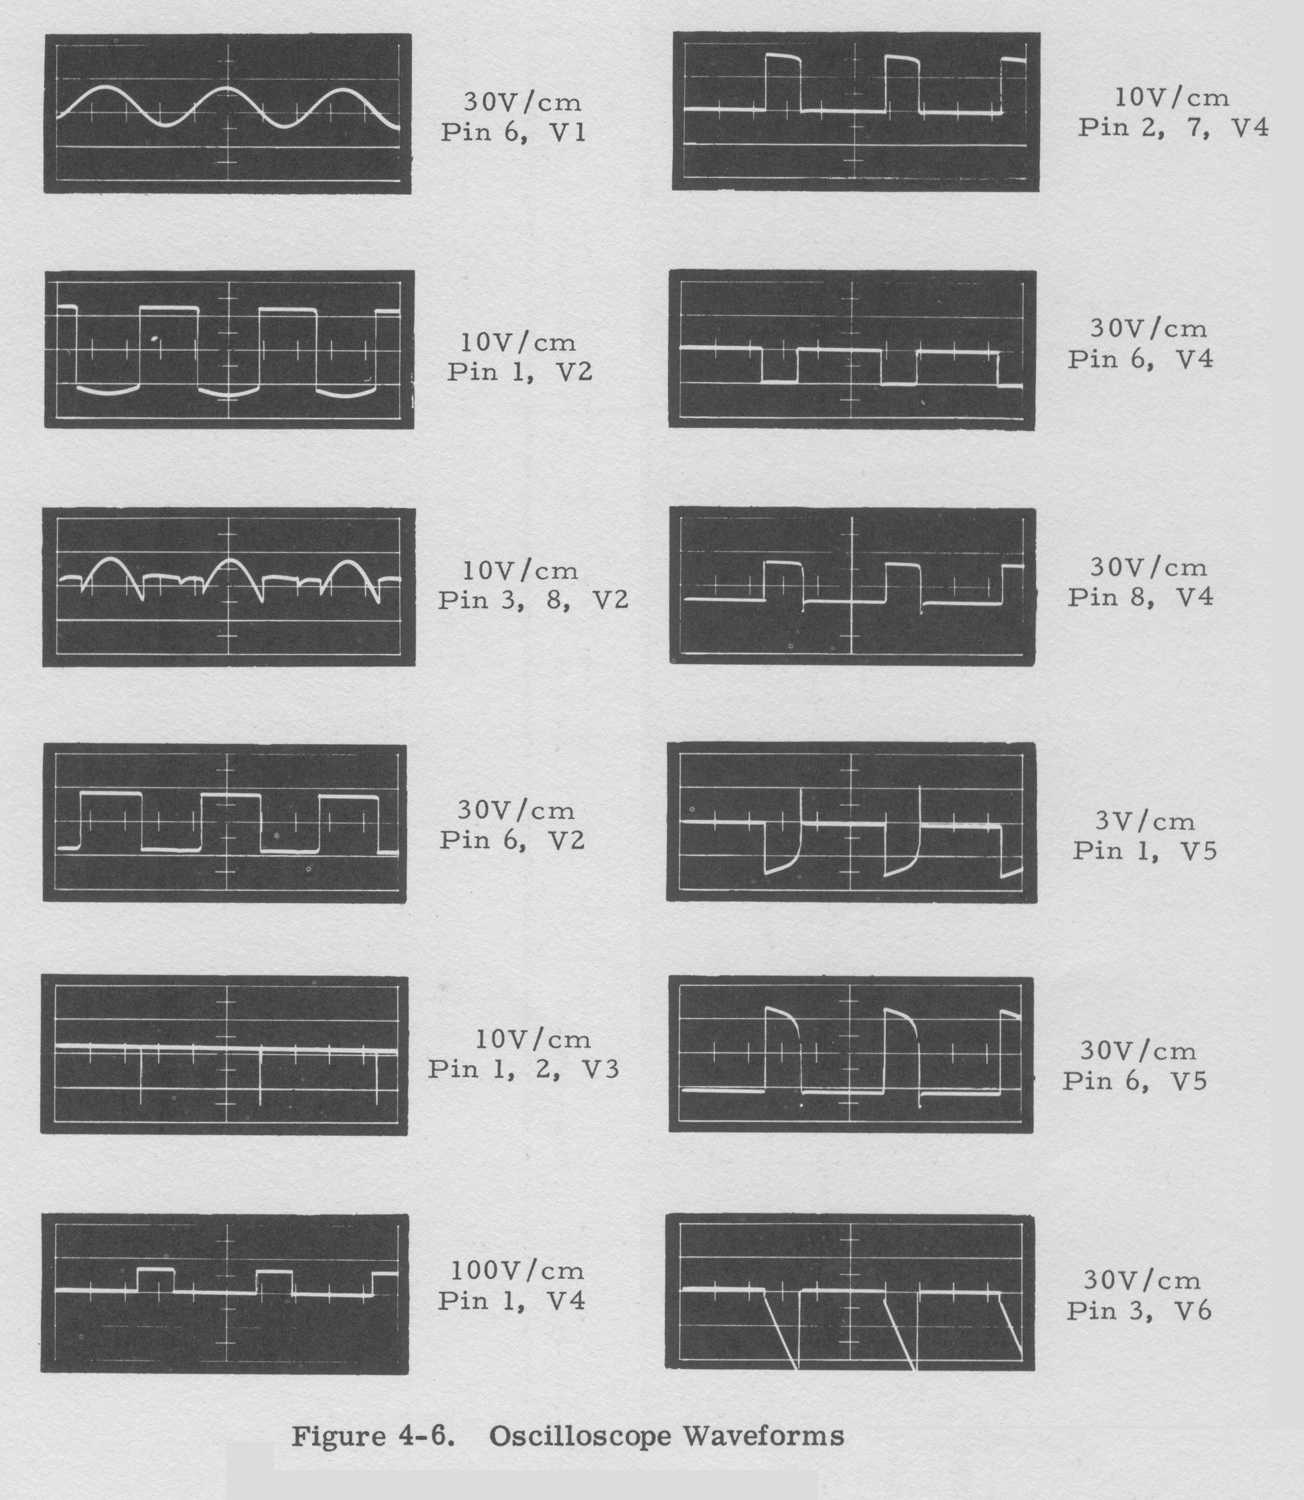
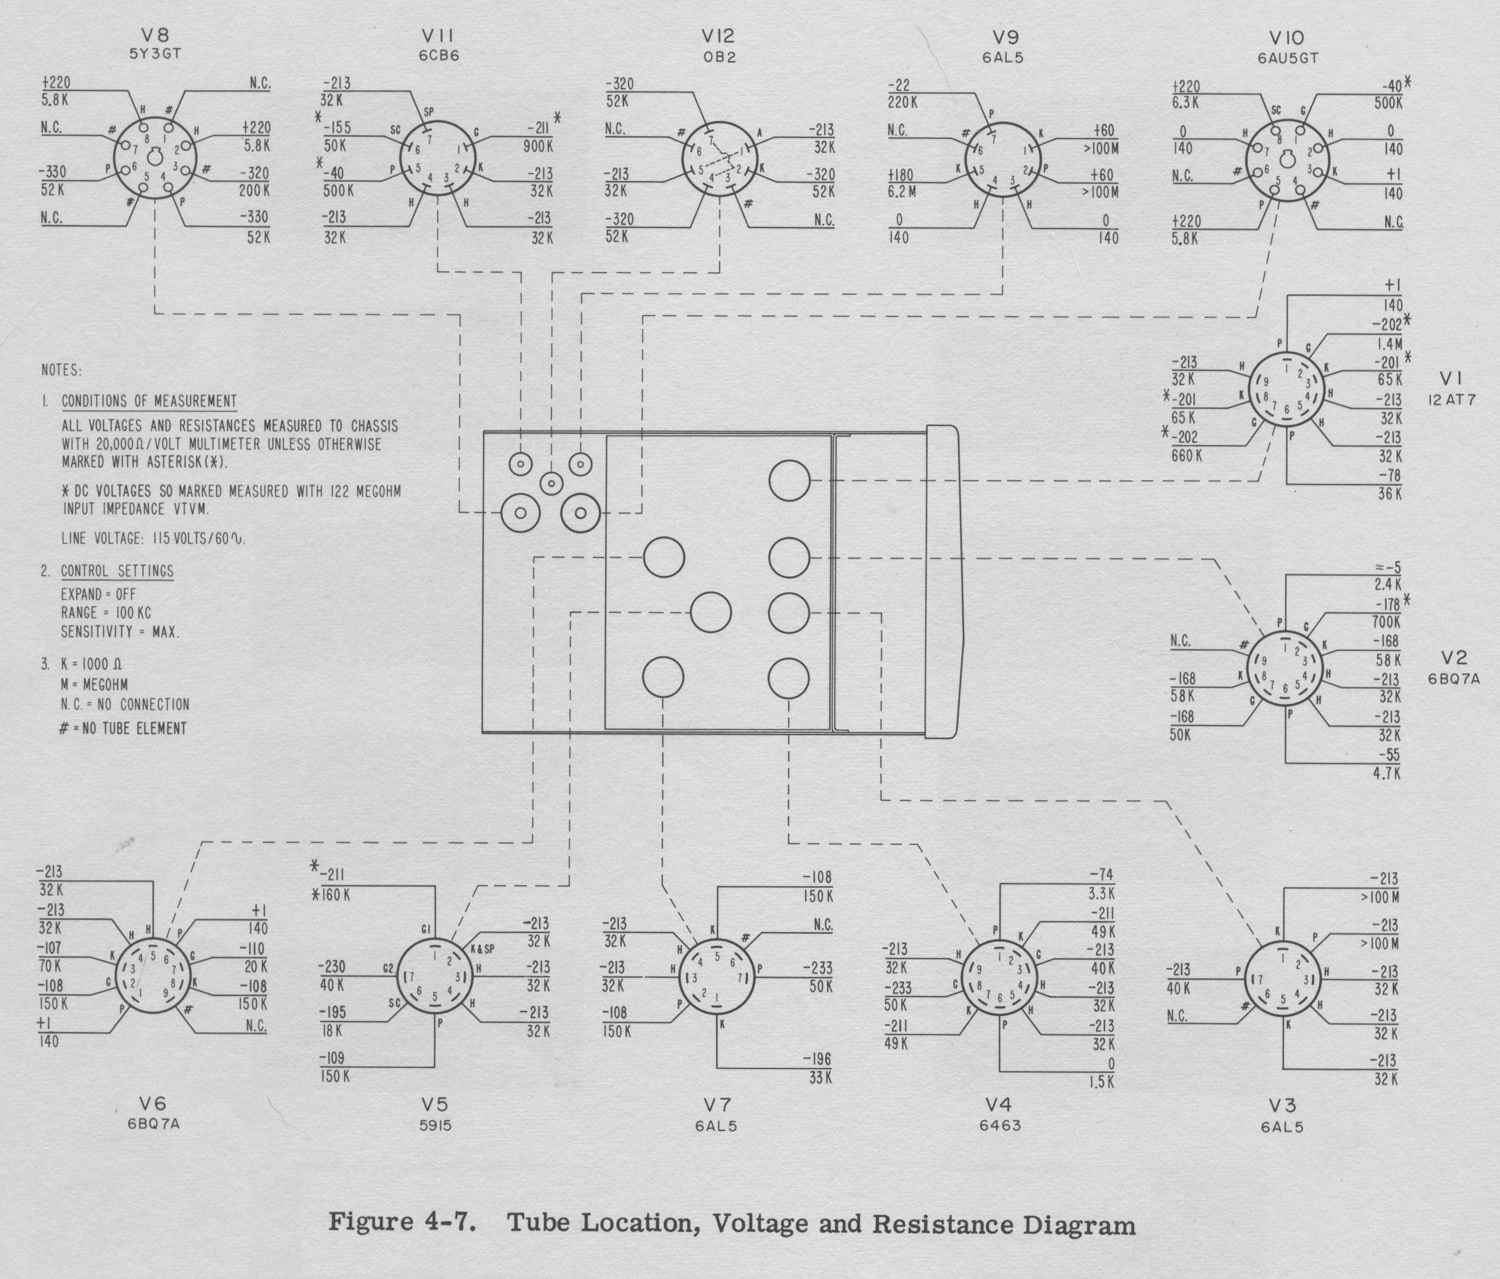
La sezione Manutenzione è stata omessa insieme ad altre parti. Di queste abbiamo riportato alcune figure che riteniamo interessanti.
Per consultare la versione in inglese scrivere “200CD” su Cerca.
Foto di Claudio Profumieri, elaborazioni e ricerche di Fabio Panfili.
Per ingrandire le immagini cliccare su di esse col tasto destro del mouse e scegliere tra le opzioni.


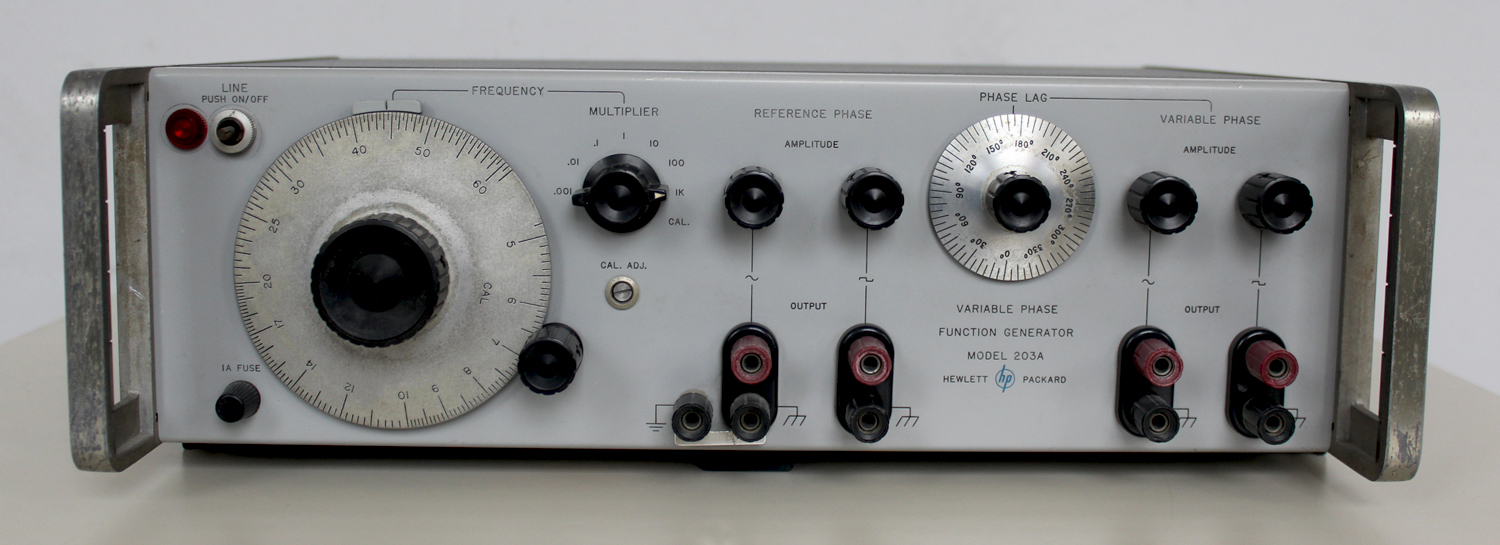
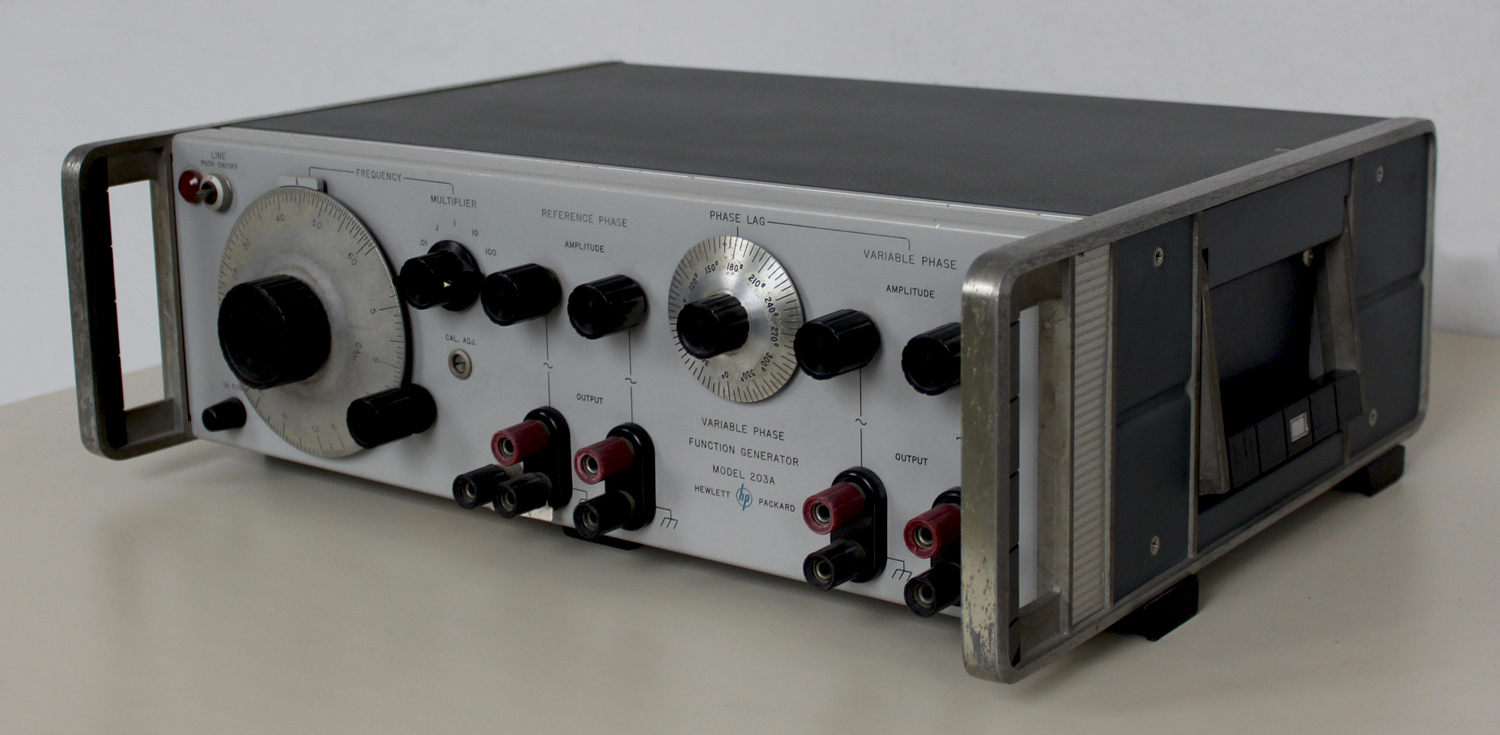
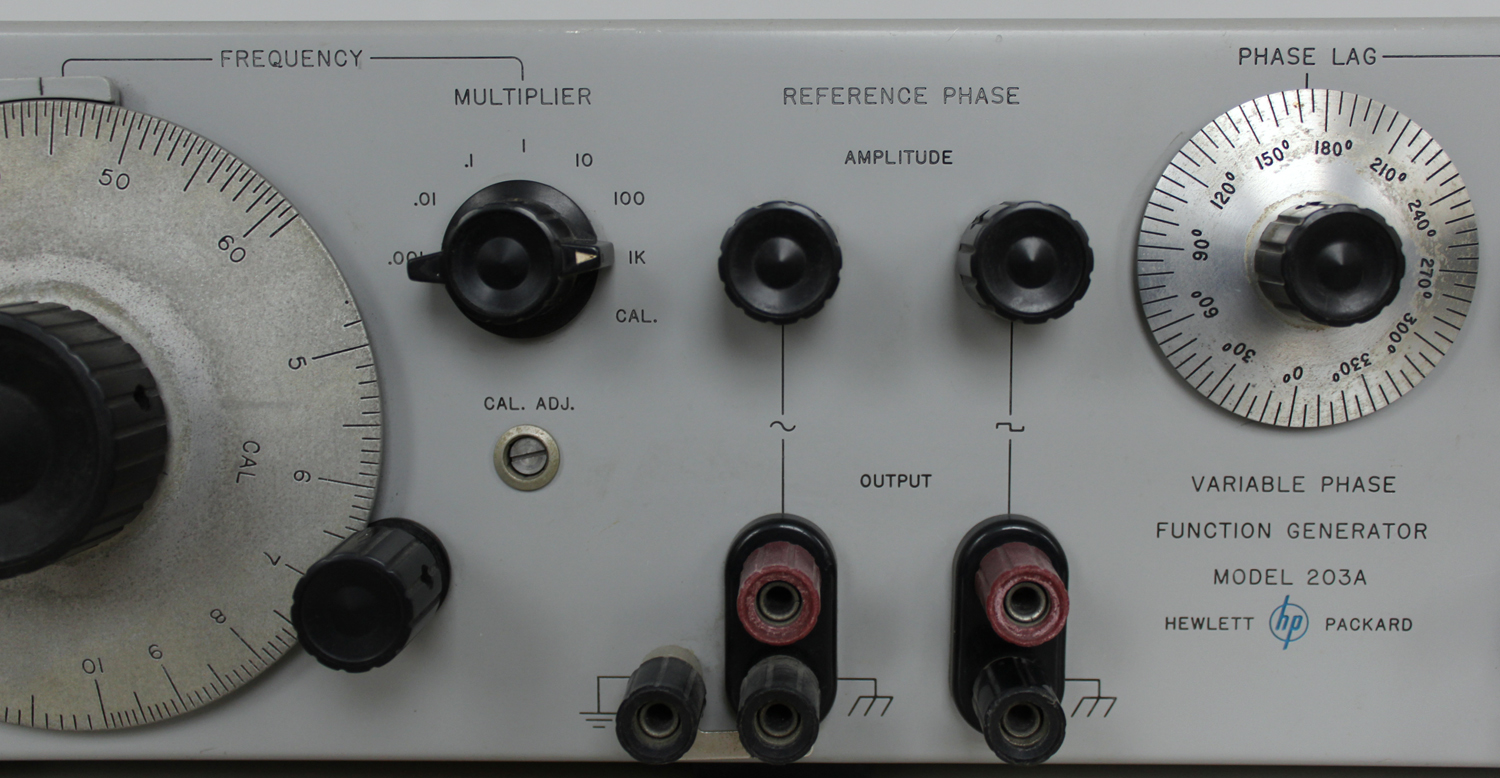
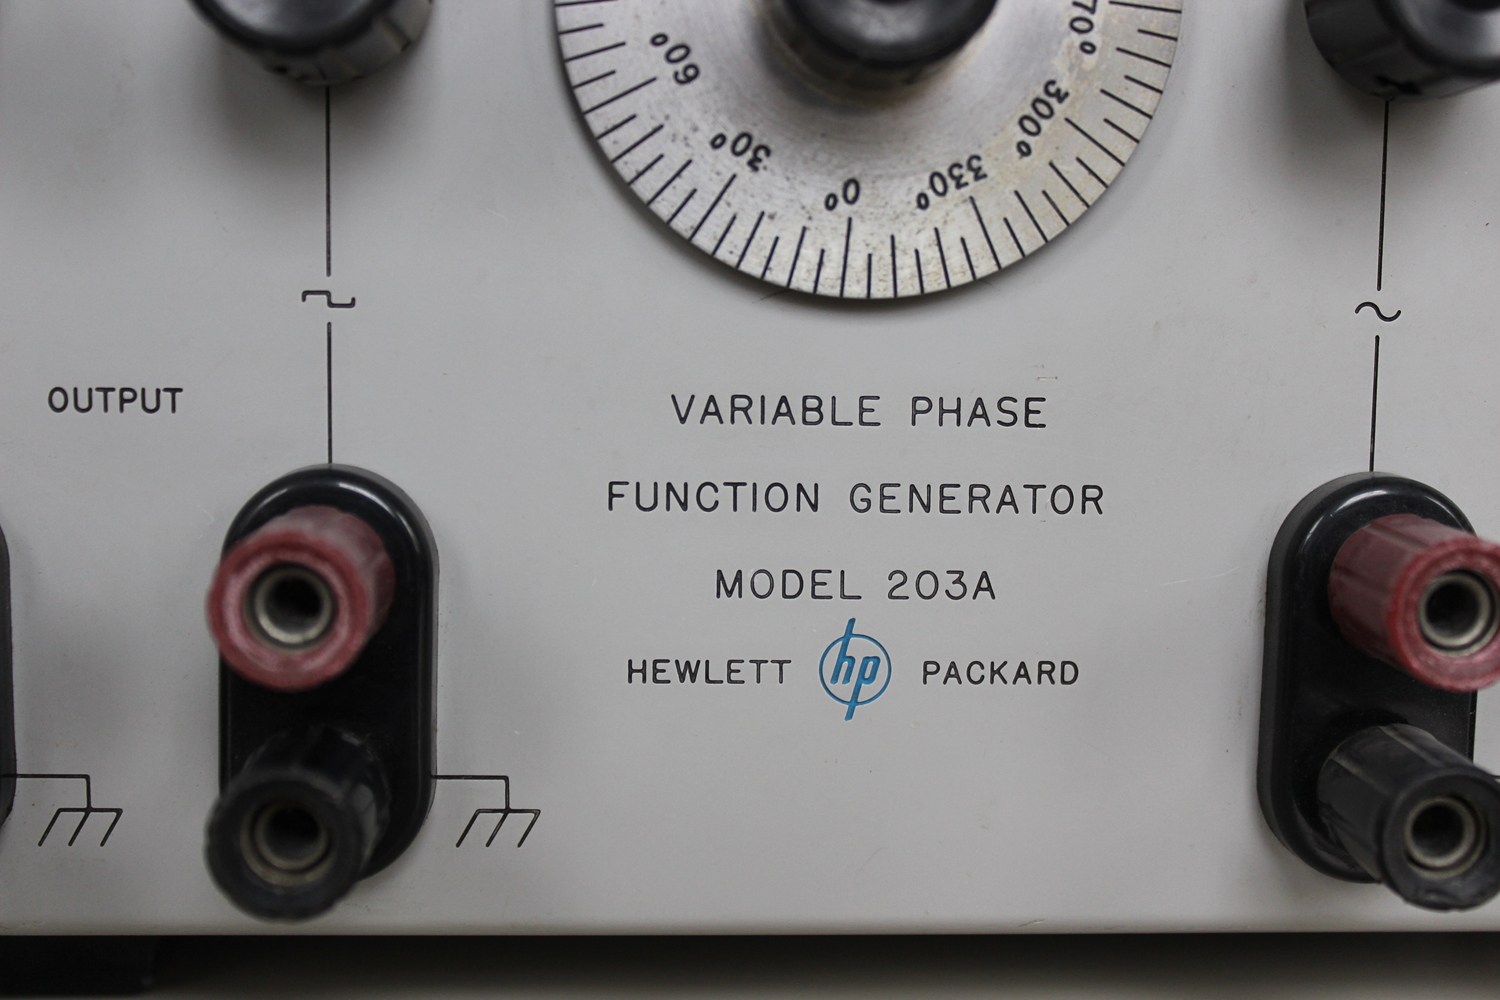
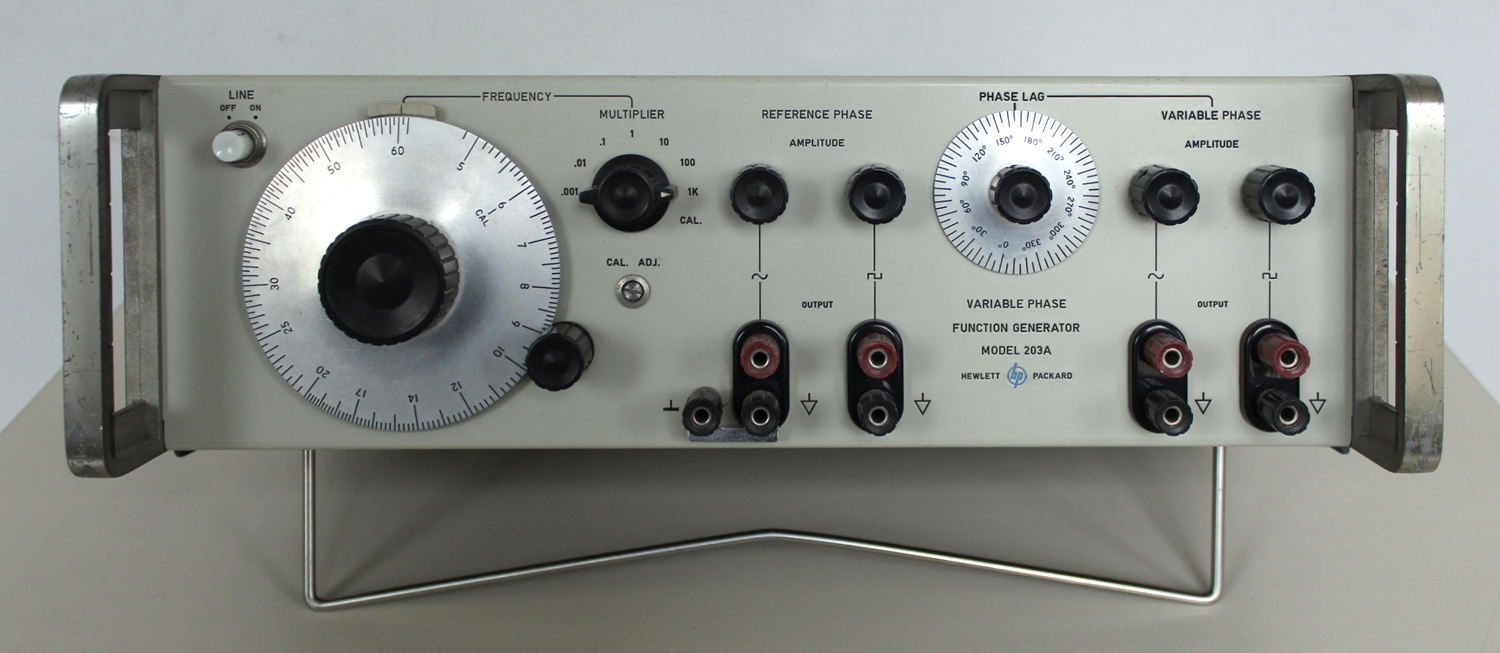
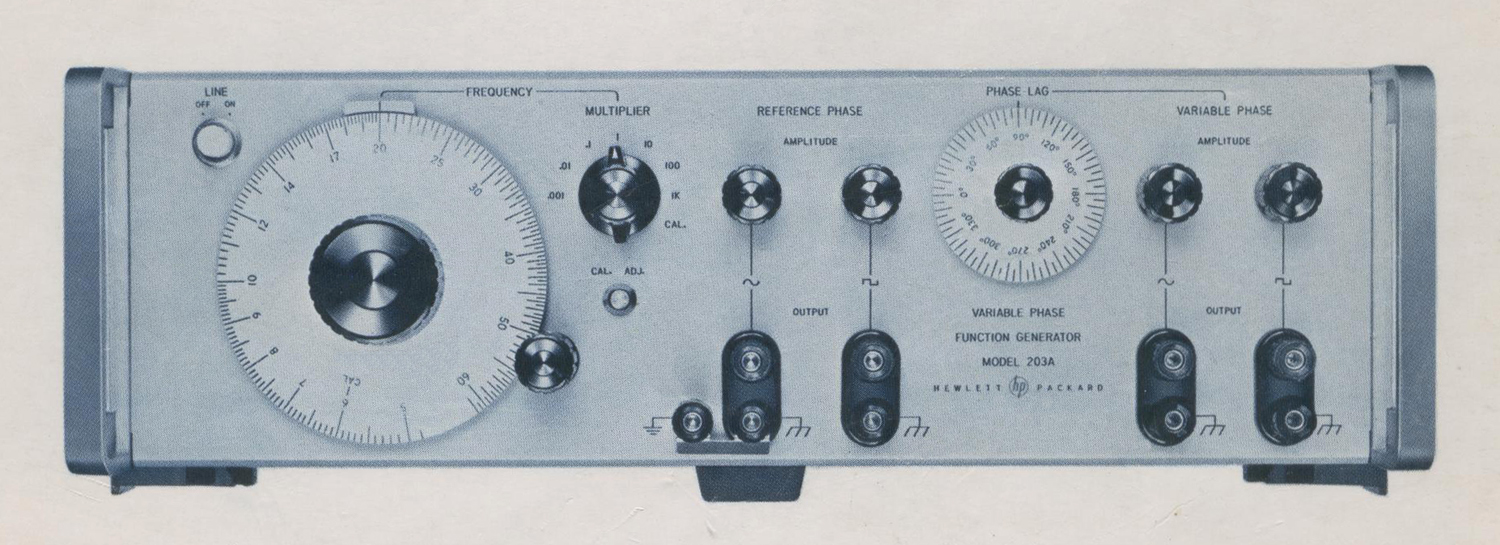
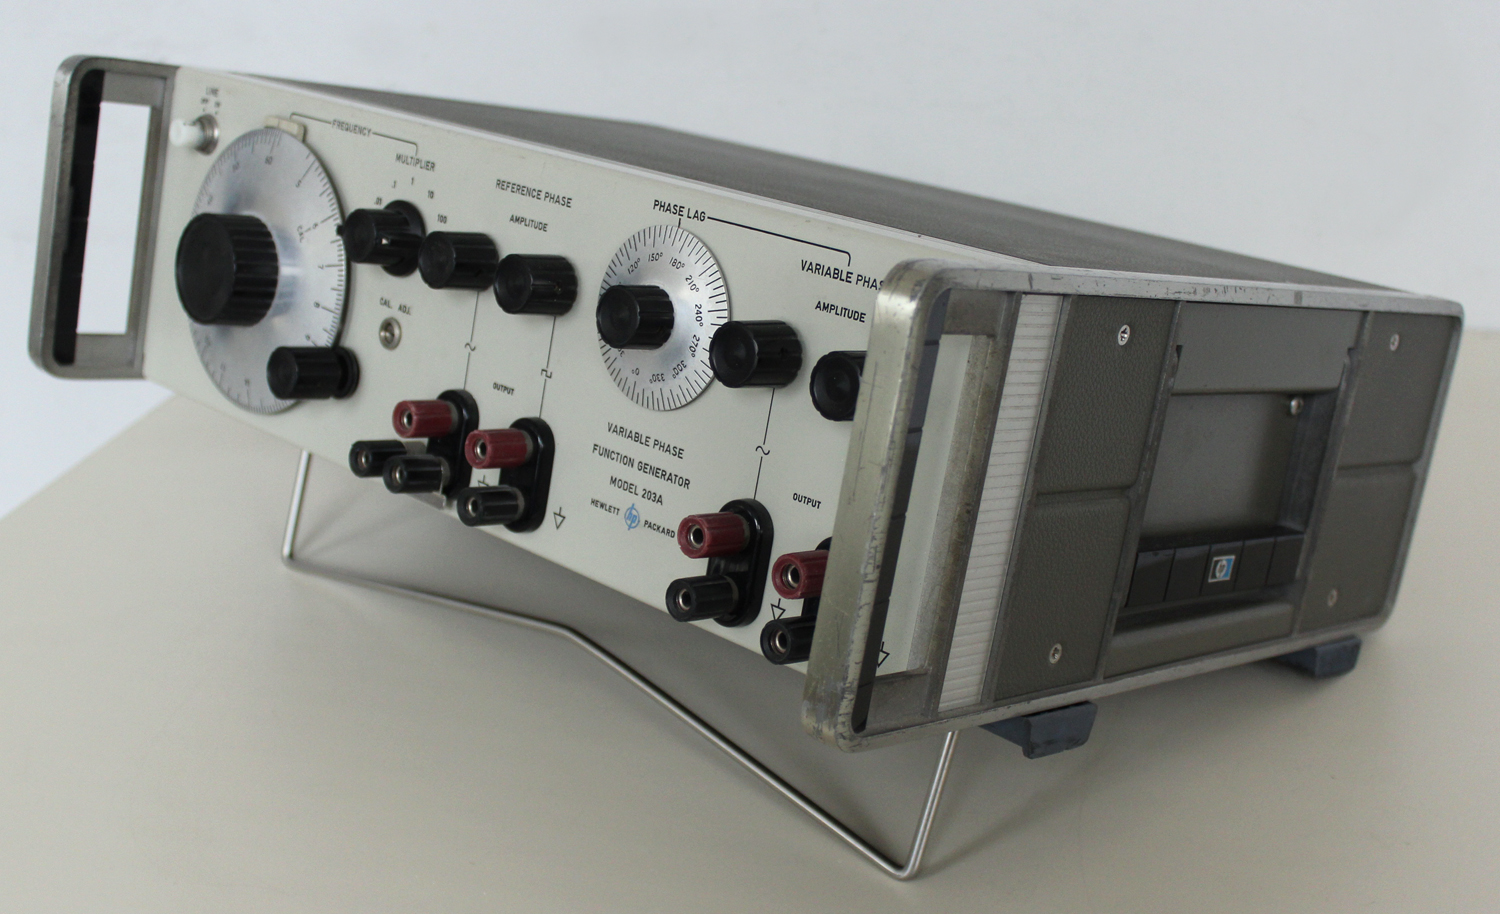
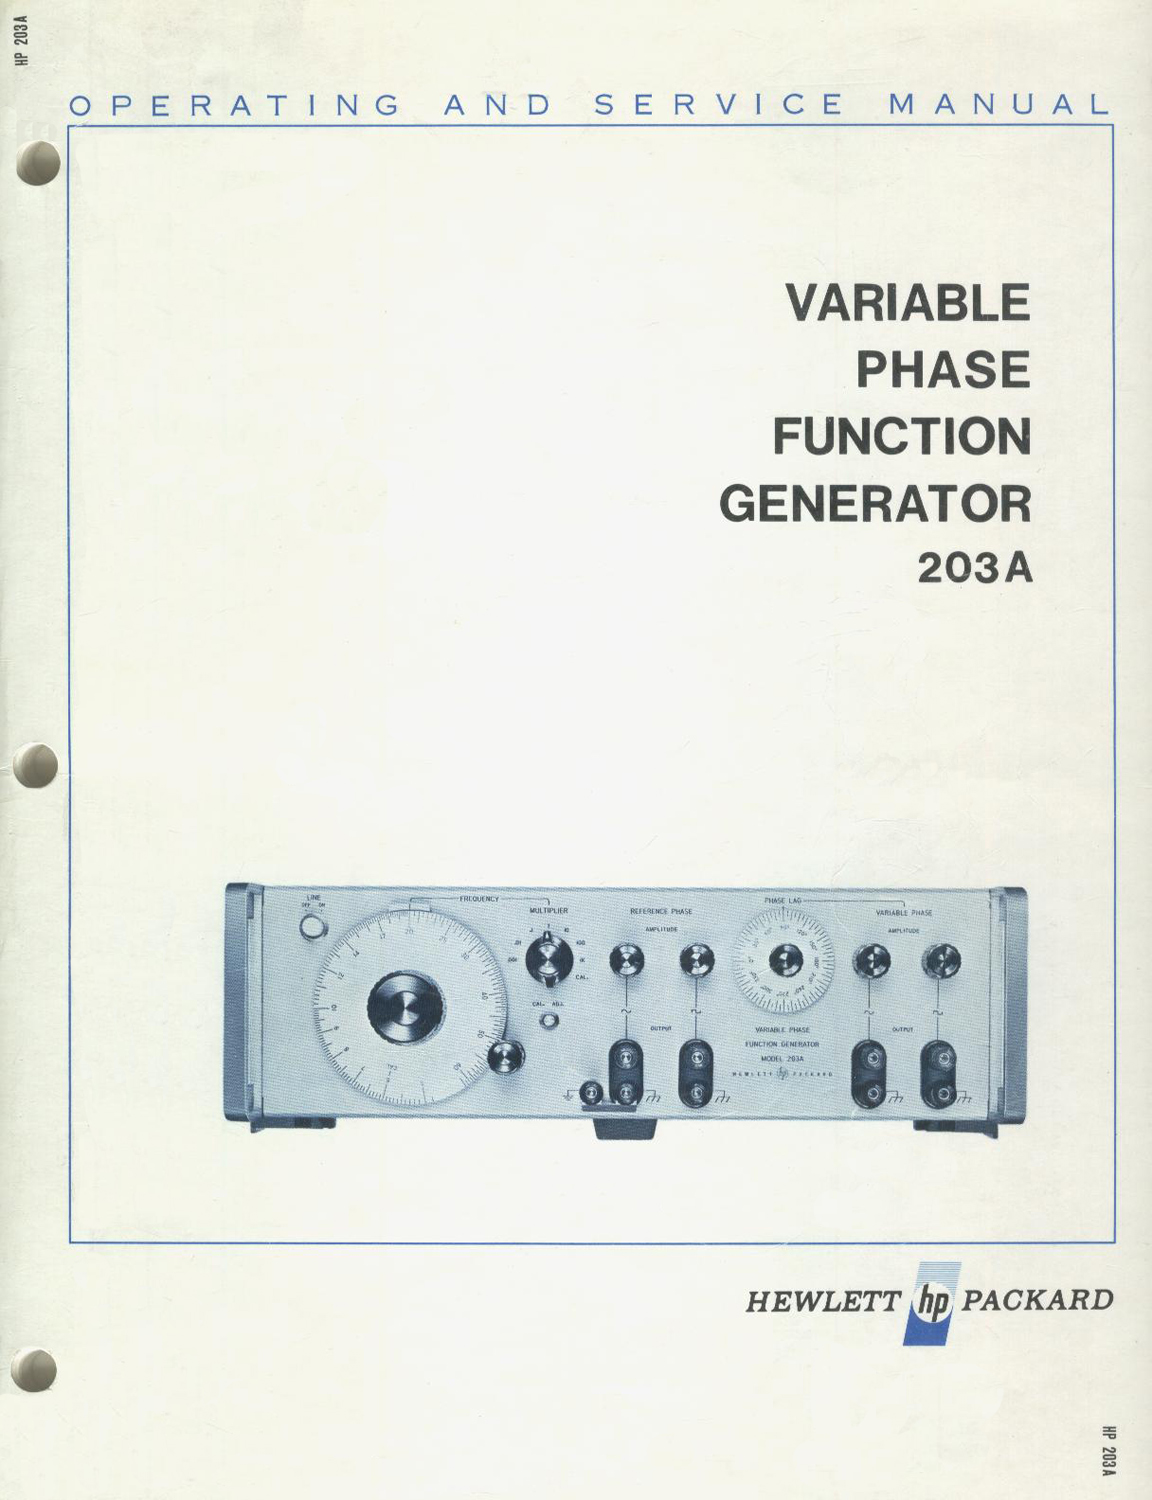
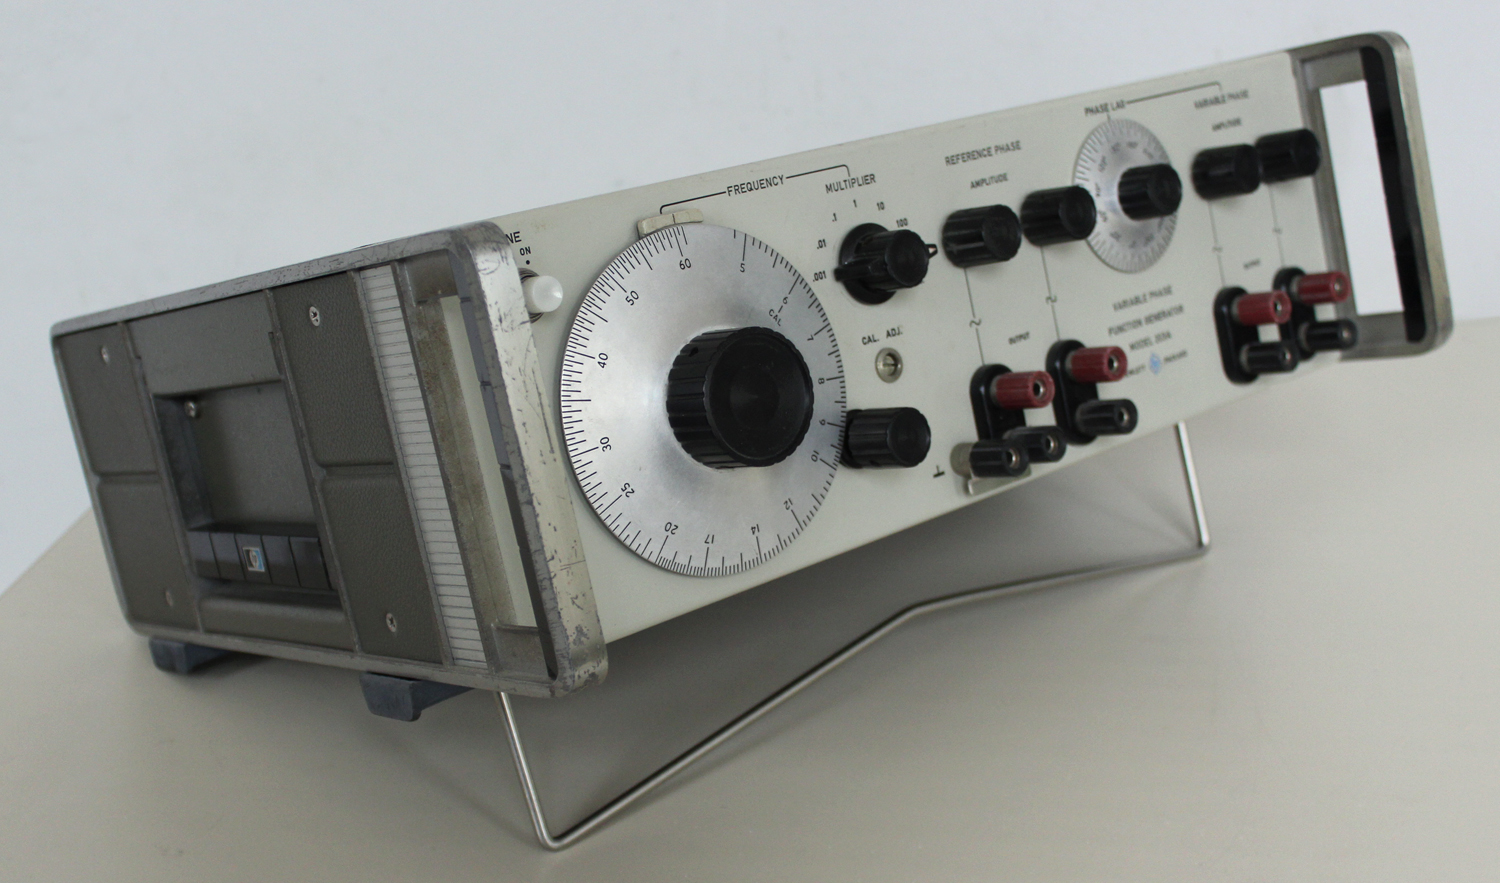
Variable Phase Function Generator Model 203A Hewlett Packard 2ª parte

Variable Phase Function Generator, Model 203A, Yokogawa Hewlett Packard. Seconda parte.
Per cause indipendenti dalla nostra volontà non disponiamo dell’inventario generale dell’epoca.
Nell’inventario per reparto  N° 7 di Elettronica, in data febbraio 1968, al n° D 4224 si legge: “Function Generator 203/A”.
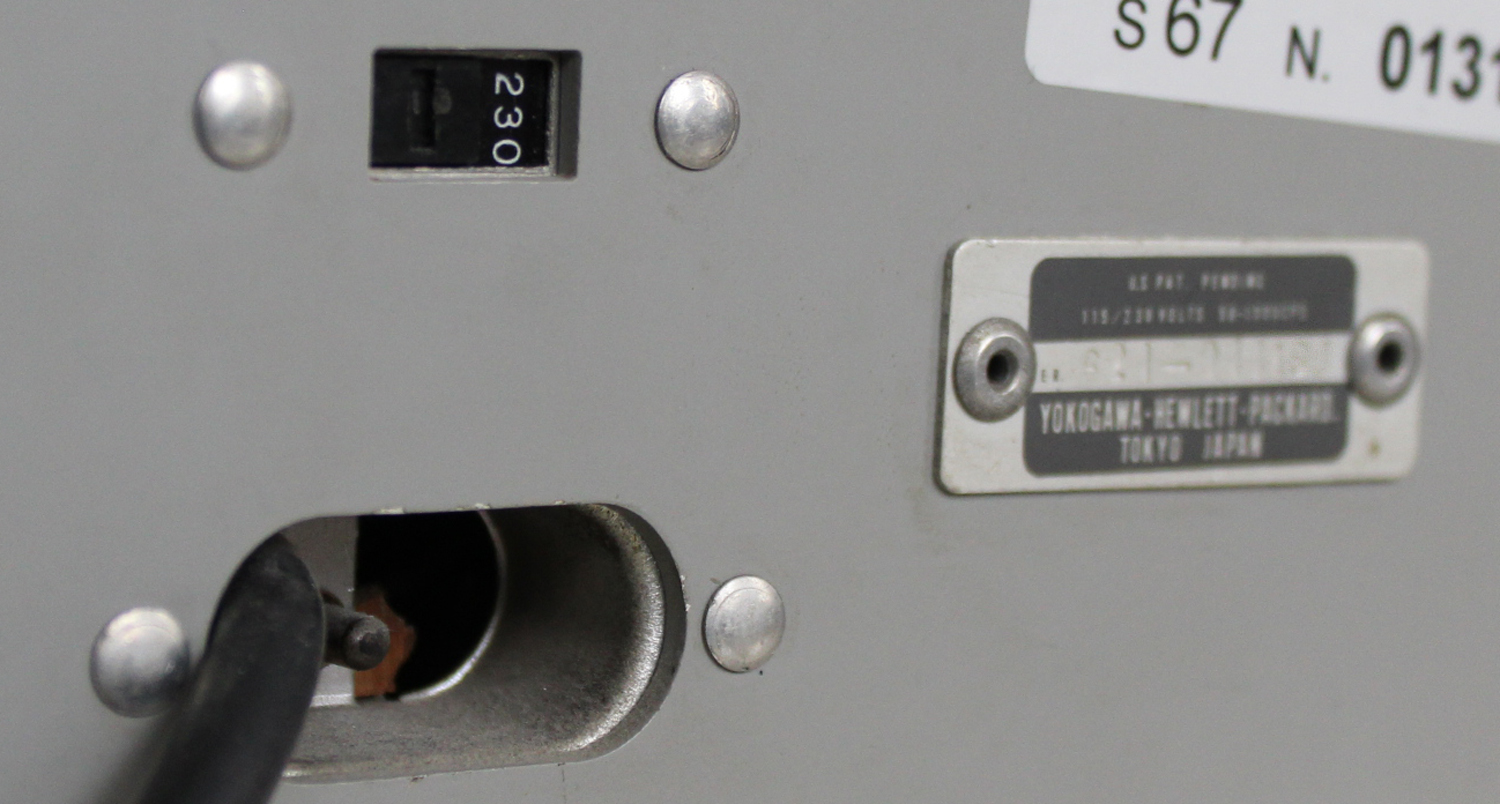
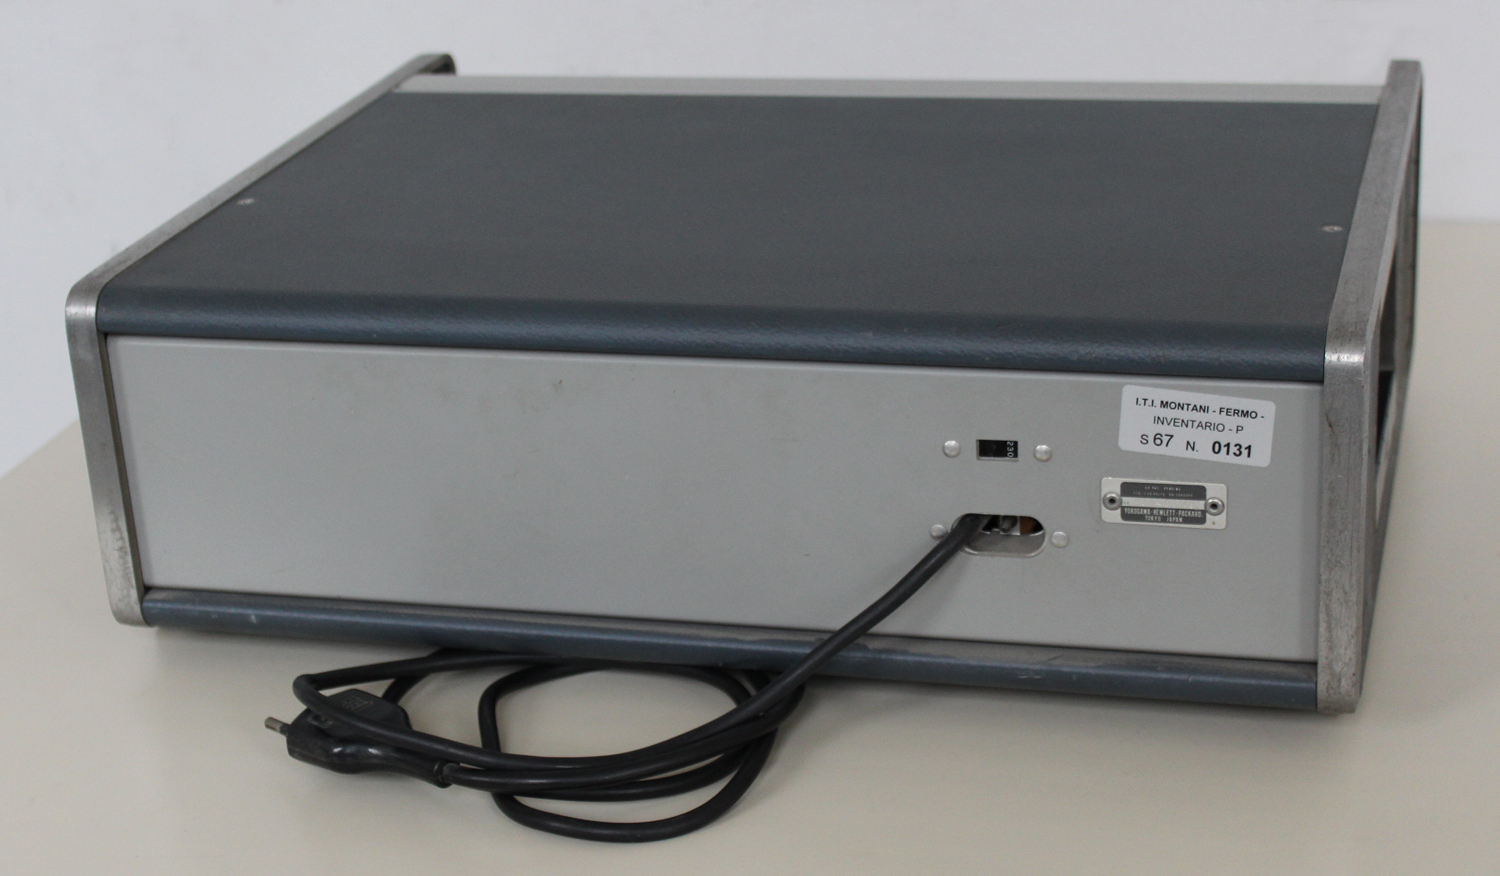
Ma ce ne sono due esemplari: questo è stato costruito dalla Yokogawa Electric alleata della Hewlett Packard, Tokyo.
In rete si trovano vari documenti, manuali di istruzioni e altre informazioni ai seguenti indirizzi:
http://hparchive.com/Manuals/HP-203A-Manual-sn425.pdf
http://www.hpl.hp.com/hpjournal/pdfs/IssuePDFs/1965-07.pdf
Presso la Sezione Elettronica è conservato il manuale di istruzioni nel quale si trovano note e disegni aggiunti a matita delle riparazioni fatte negli  anni. Noi le abbiamo tolte per ridare ai disegni l’aspetto originale.
Il testo delle istruzioni prosegue dalla prima parte.
§§§

«4-16. VARIABLE PHASE SHIFTER ASSEMBLY.
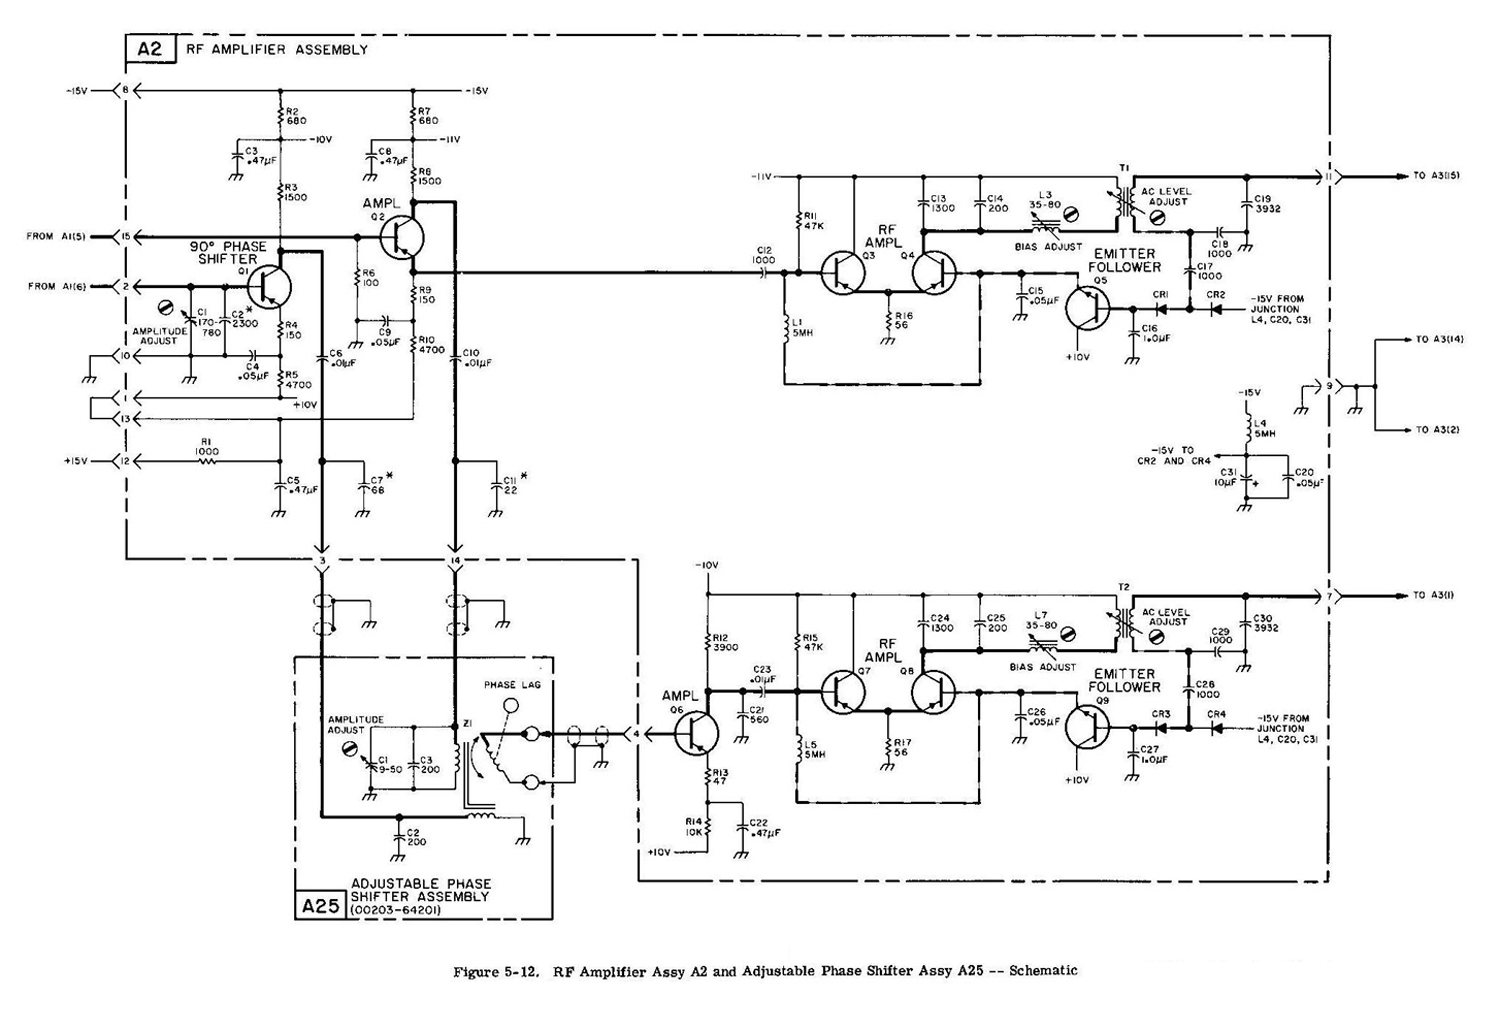
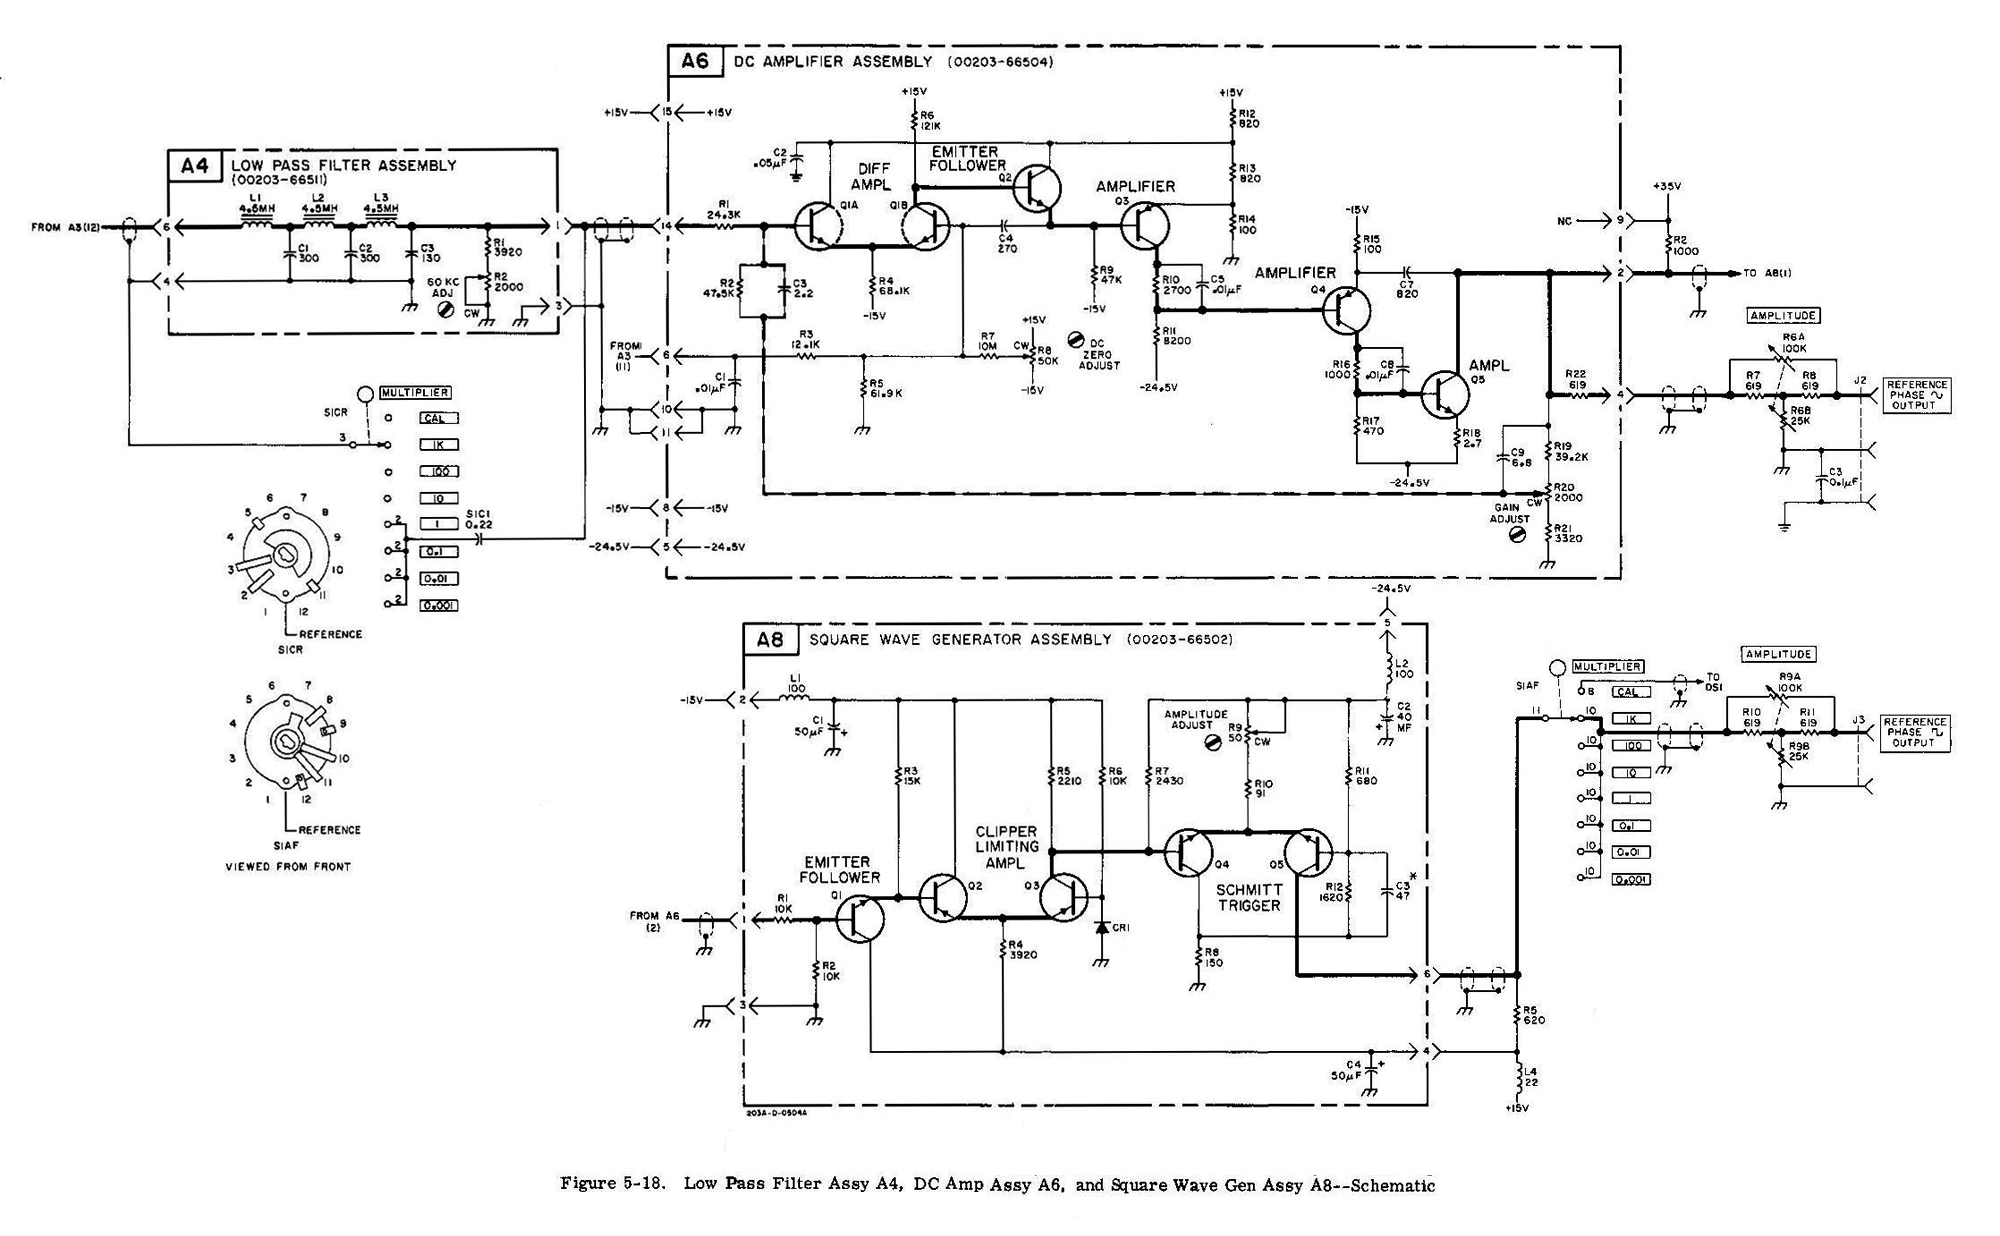
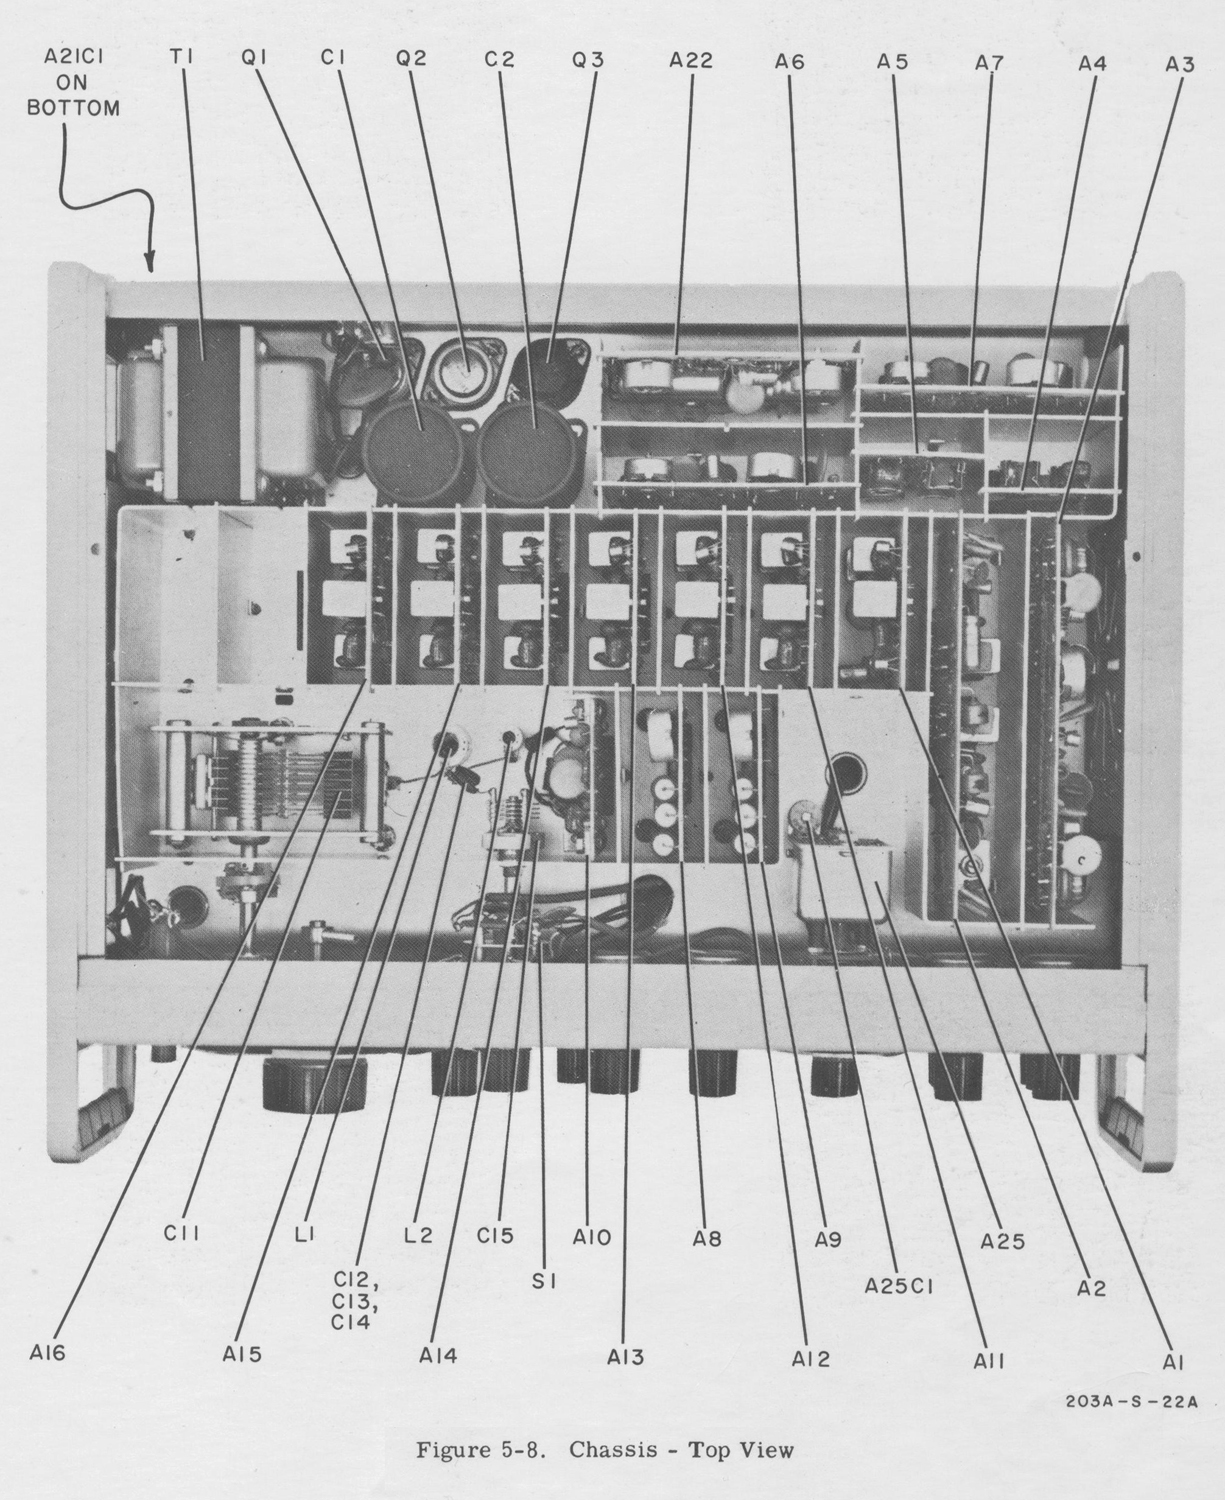
4-17. The variable phase shifter assembly A25 (figure 5-12) is a goniometer consisting of two stator windings, a rotor winding, and associated circuits. The goniometer requires two 555 kc input signals; one from A2Q2 to one of the stator windings, and the other from A2Q1 and the 90° phase shift network to the other stator winding. The output phase corresponds to the angle of the rotor winding (PHASE LAG control). The phase can be continuously adjusted from 0° through 360° with respect to the reference signal while maintaining a constant amplitude. The adjustable phase shifter output is applied to the RF amplifier assembly A2 (figure 5-12).

 4-18. RF AMPLIFIERS (A2].
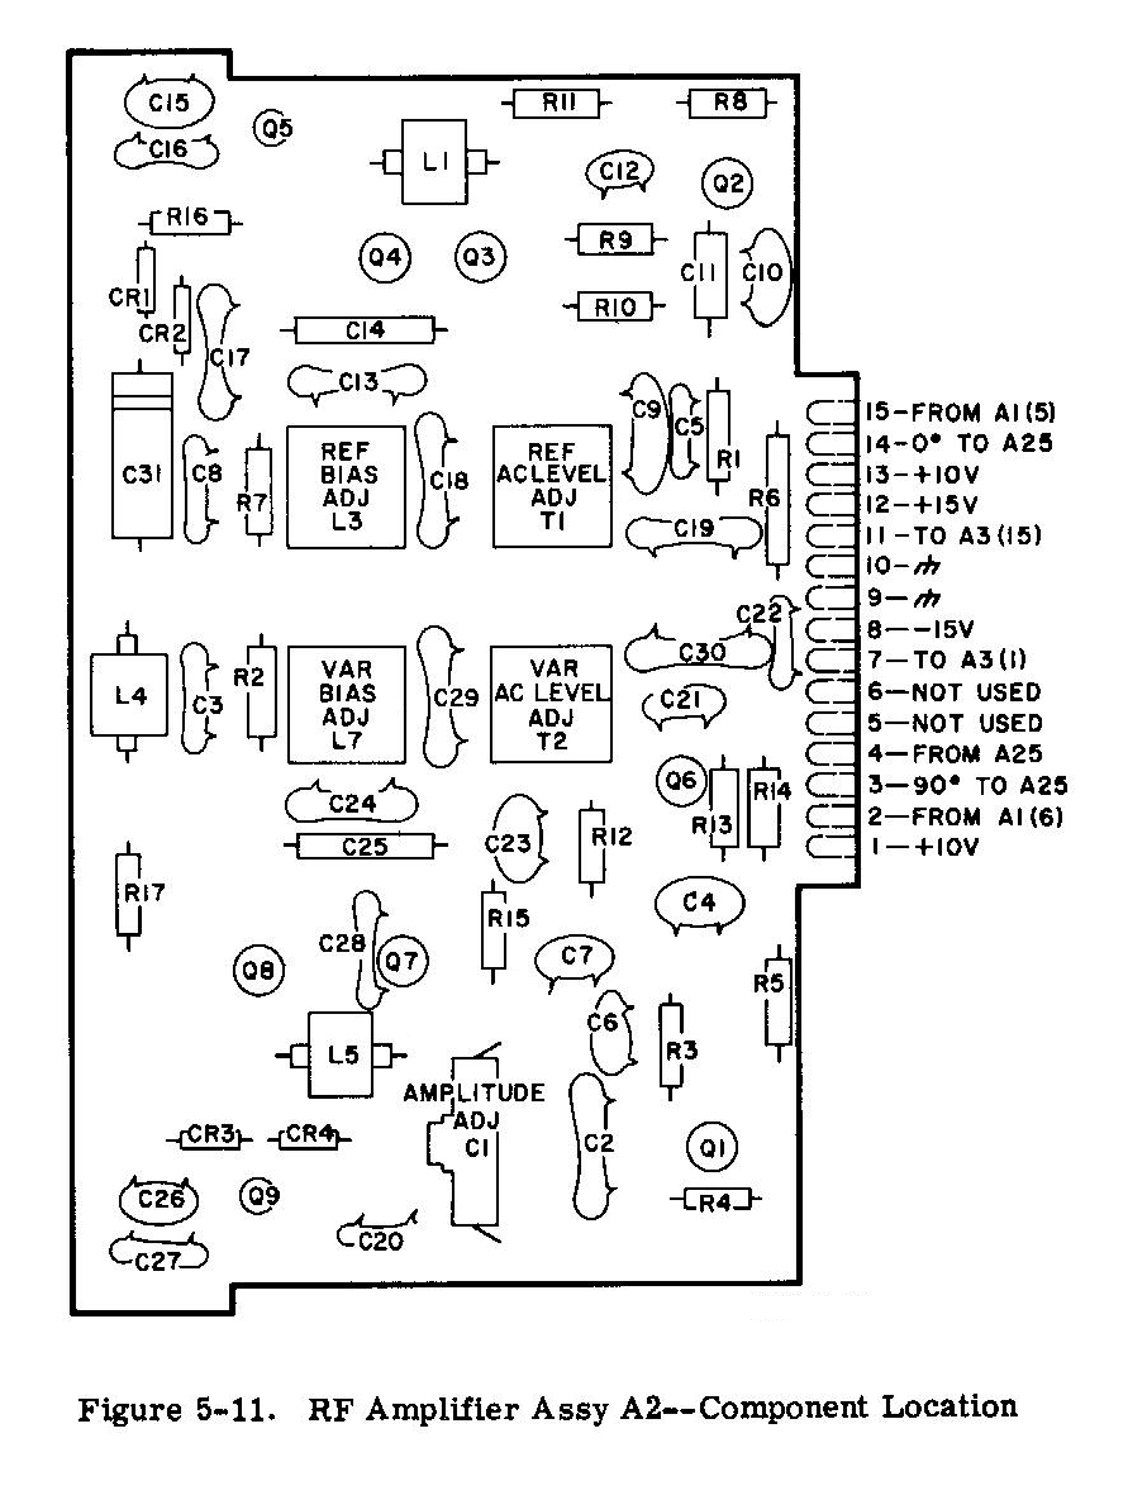
4-19. The RF amplifier assembly A2 consists of two RF amplifiers; A2Q3, A2Q4, and A2Q5 for the reference phase channel and A2Q6 through A2Q9 for the variable phase channel. Refer to the schematic diagram (figure 5-12) for circuit details.

4-20. VARIABLE PHASE CHANNEL RF AMPLIFIER.
4-21. The signal from the variable phase shifter is amplified by A2Q6,then applied to the base of A2Q7. A2Q7 and A2Q8 act as an over-driven amplifier which amplifies and clips the signal applied to the base of A2Q7; this operation produces a square wave of current at the collector of A2Q8. The zero crossing of the square wave of current coincides with the zero crossing of the sine wave signal applied to the base of A2Q7 so that the phase of the applied signal is preserved. A tuned network, formed by A2C24, A2C25, A2C29. A2C30, A2L7, and A2T2 filters the 555 kc square-current waveform to a nearly pure sine wave.

4-22. The output  of the RF amplifier circuit, which is taken across A2C30, is maintained at a constant amplitude by the level controlling circuit. If the output should increase, the voltage at A2C27 increases, resulting in a voltage increase at the base of A2Q9. This increase is applied to the bases of A2Q7 and A2Q8 which then conduct less average current. When A2Q8 conducts less the signal at its collector decreases and the output voltage decreases, opposing the original change. The result is that the amplitude of the output remains nearly constant despite variations in the amplitude of the input signal. The output signal is then applied to ABT4 in the modulator assembly A3 (figure 5-16).

4-23. REFERENCE PHASE CHANNEL RF AMPLIFIER.
4-24. The signal present at the emitter of A2Q2 is applied to the reference phase channel RF amplifier section, A2Q3 through A2Q5. This stage operates the same as the variable phase channel RF amplifier described in paragraph 4-20. The output signal is then applied to A3T3 in the modulator assembly A3.

4-25. VARIABLE FREQUENCY OSCILLATOR (A10)
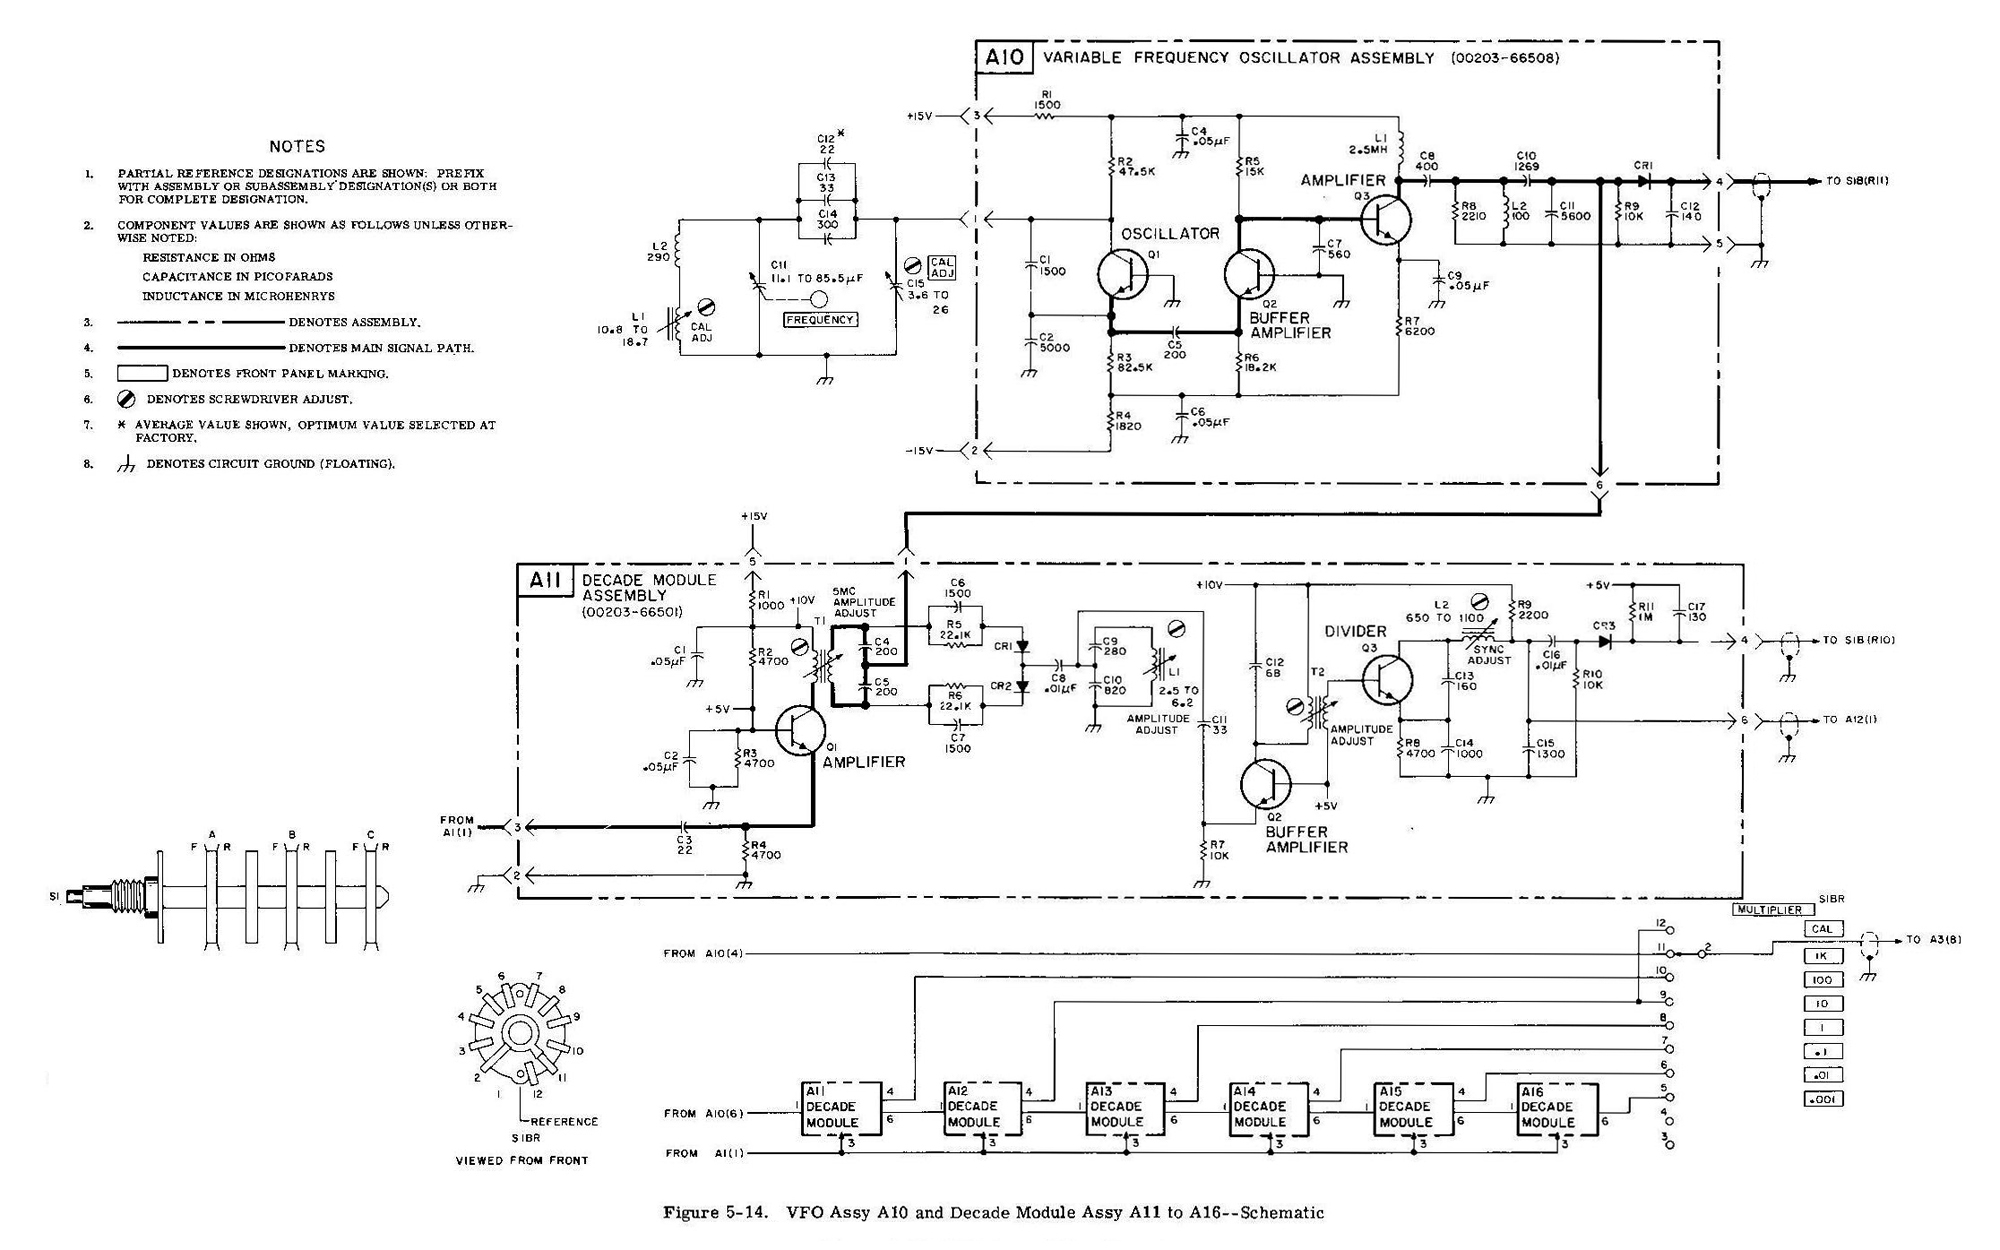
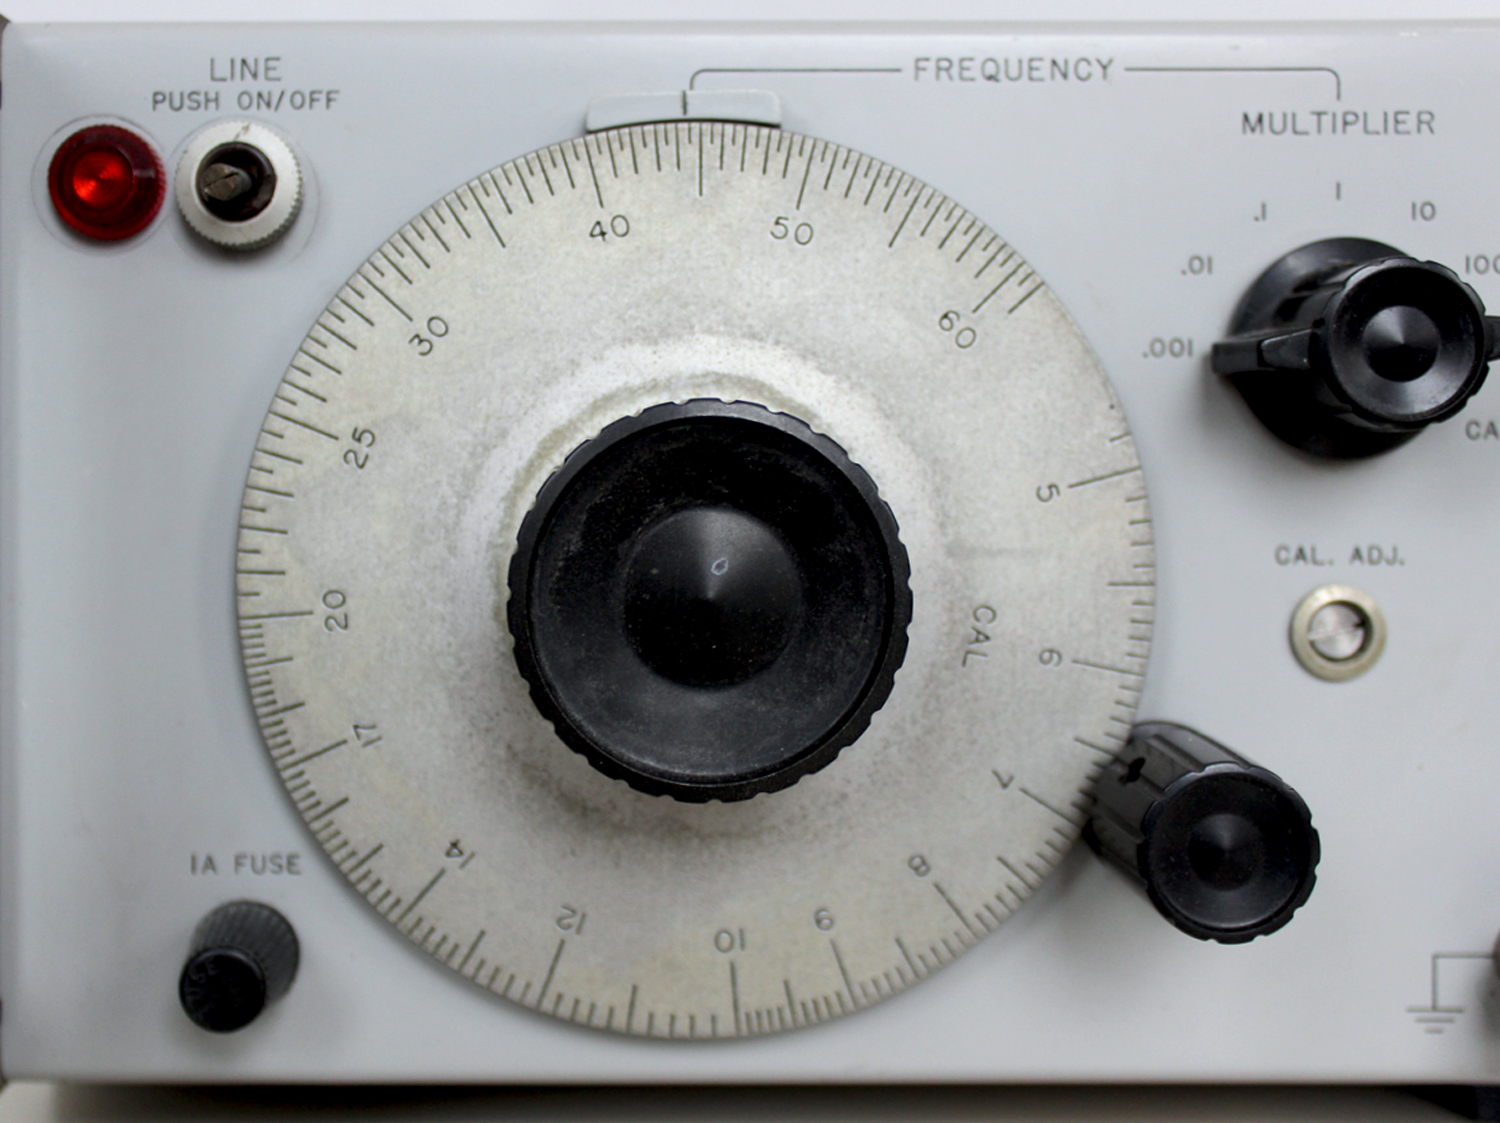
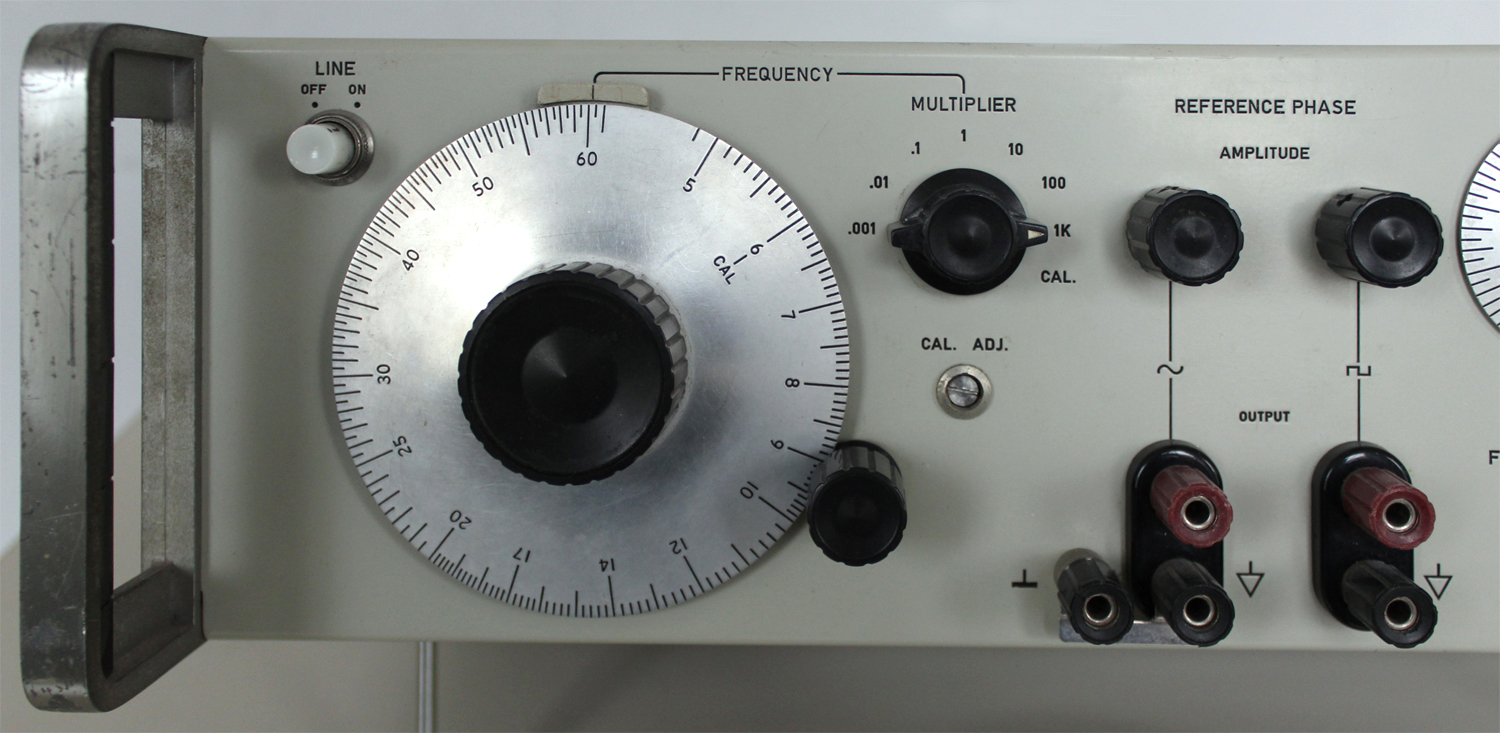
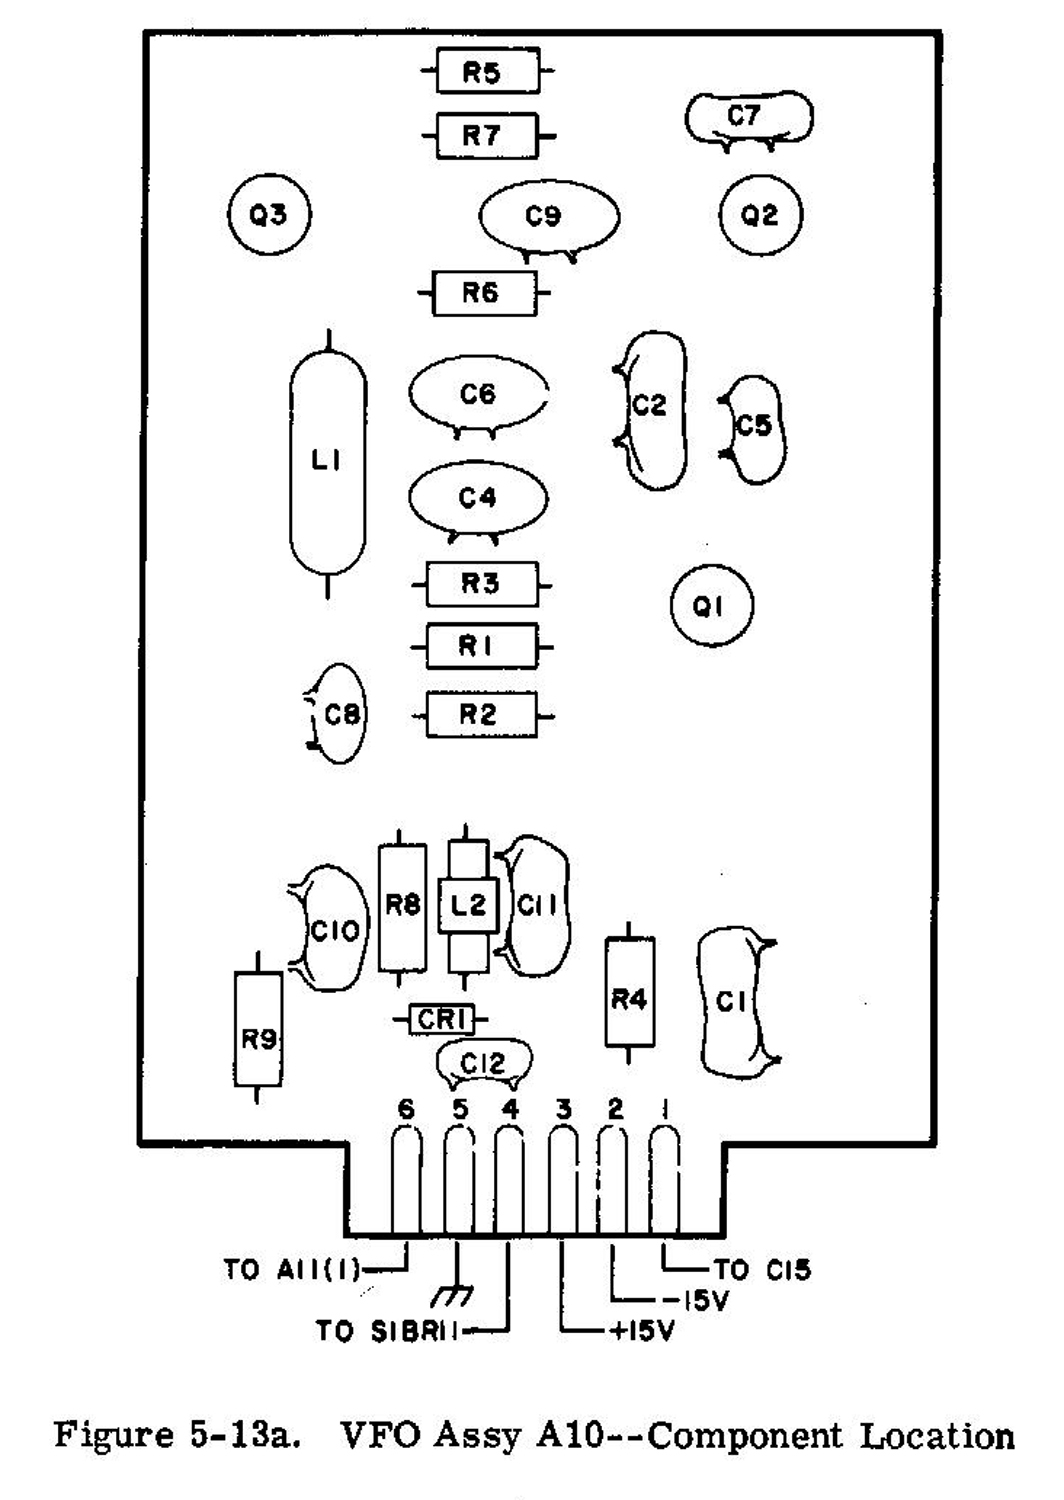
4-26. The variable frequency oscillator assembly A10 generates a signal that is variable from 495 kc to 550 kc by rotation of the front panel FREQUENCY dial. The FREQUENCY dial is calibrated so that with the dial set at 5 the VFO is oscillating at 550 kc and with the dial set at 60 the VFO is oscillating at 495 kc. The output signal from the variable frequency oscillator is applied to the 1 K position of the MULTIPLIER (frequency range) switch and also to the 1st decade module. Refer to the schematic diagram, figure 5-14, for circuit details.


4-27. DECADE MODULES (A11-A16).
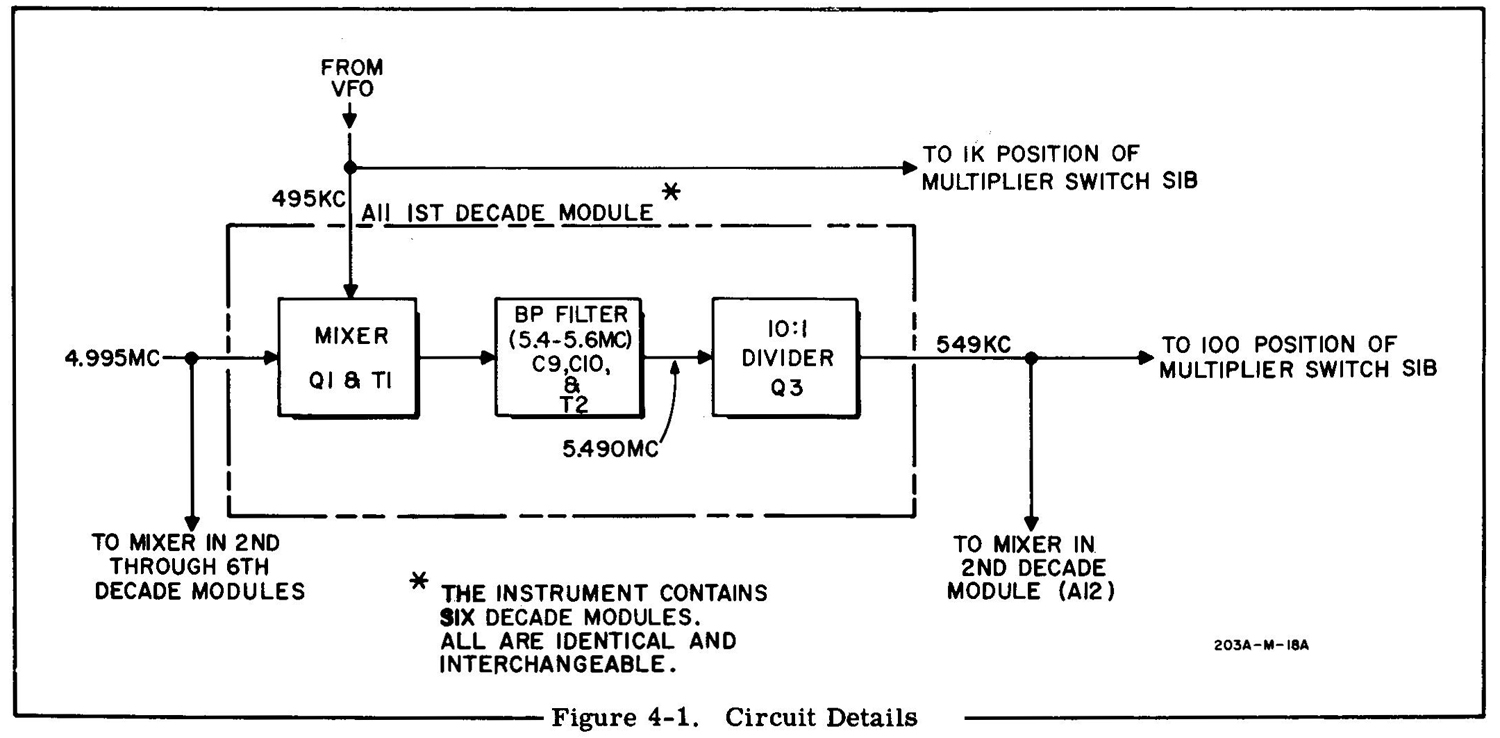
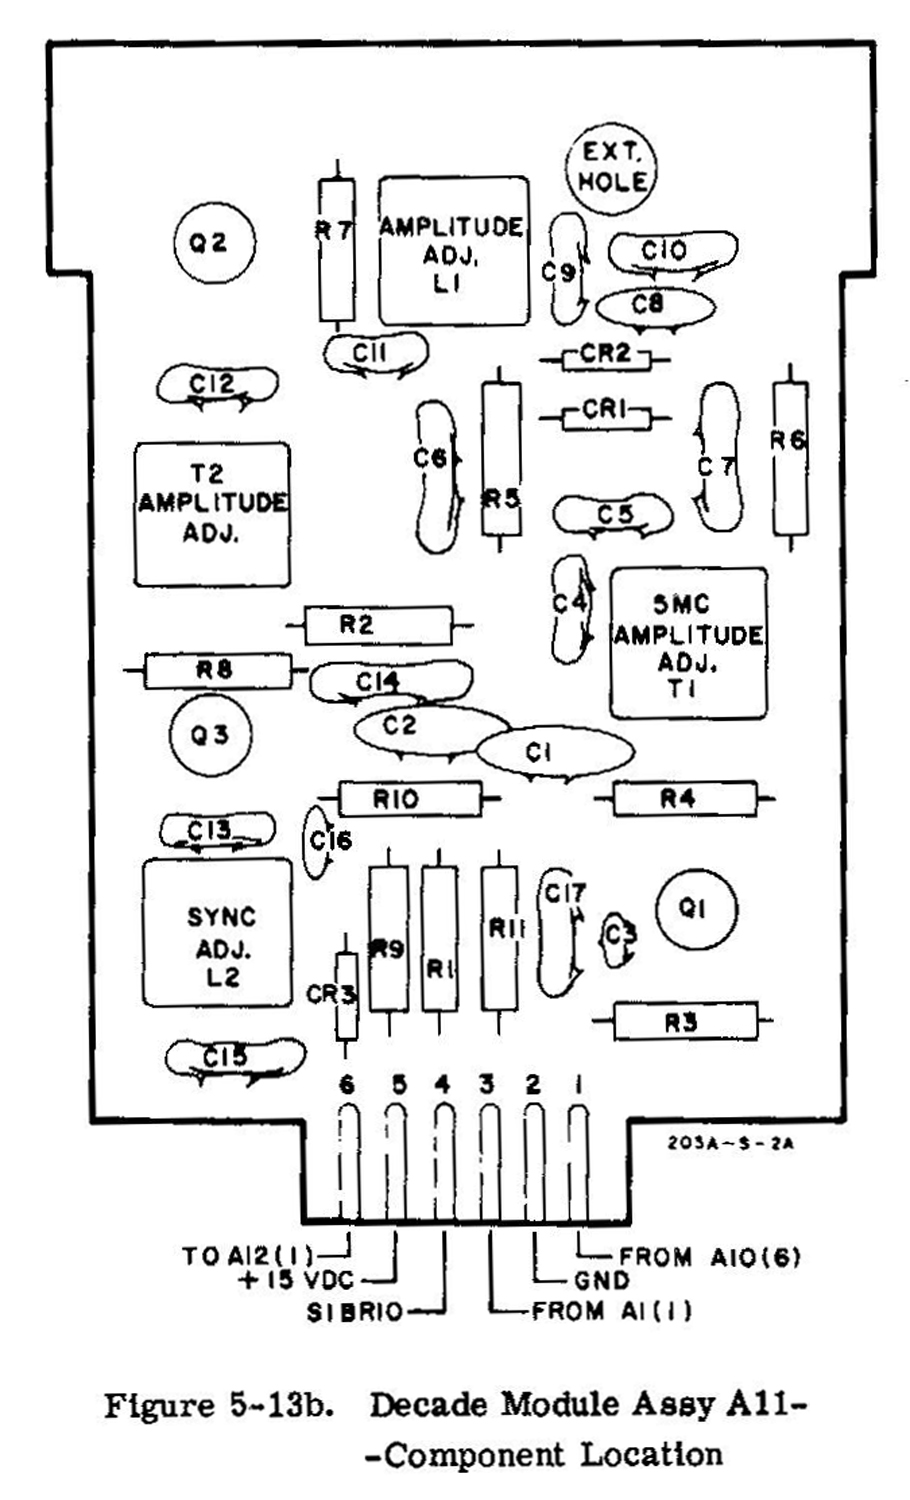
4-28. The six decade module assemblies A11 thru A16 each consist of a mixer, a bandpass filter, and a 10:1 divider. These decades produce a band of high frequency signals that are mixed in the modulators (A3) with the 555 kc fixed frequency signal from the RF amplifiers to produce a signal in the 0.005 cps to 60 kc range (refer to paragraph 1-5 for options]. Refer to the schematic diagram, figure 5-14 and figure 4-1 for circuit details.

4-29. DECADE MODULE (A11). 4-30. The 4. 995 Me signal from the crystal oscillator is applied to the emitter of A11Q1 isolation stage, and subsequently appears across the primary of A11T1. The signal from A11T1 is applied to a suppressed carrier, balanced modulator. The 495 kc VFO signal (assume that the FREQUENCY dial is at 60 and the VFO signal is 495 kc) is applied to the other input of the balanced modulator. Both signals are mixed, and the sum and difference of these two frequencies will appear at the output. The signal from the balanced modulator is passed through an LC filter network which is tuned for a band-pass of from 5. 4 Me to 5. 6 Mc, which only allows the sum frequency to pass on to the 10:1 divider A11Q3. The 10:1 divider is similar to the 9:1 divider described in paragraph 4- 9; the main difference being that the tuned tank circuit in the 10:1 divider is adjusted so that the stage provides an exact 10:1 division of the input frequency. The resultant frequency is fed to the 100 position of the FREQUENCY MULTIPLIER switch and to the mixer in the second decade module A12.
4-31. DECADE MODULES, A12 THROUGH A16.
4-32. The action within the succeeding decade  modules is the same as that described for the first decade module A11. The output of each module is applied to a position of the FREQUENCY MULTIPLIER switch and to the mixer in the following decade module. Thus a set of variable frequency signals are produced and when mixed with the
constant high-frequency signal in the modulator (A3) a beat frequency is produced. The beat frequency is decreased by a factor of 10 for each lower range of the FREQUENCY MULTIPLIER switch.
4-33. MODULATOR ASSEMBLY, A3.
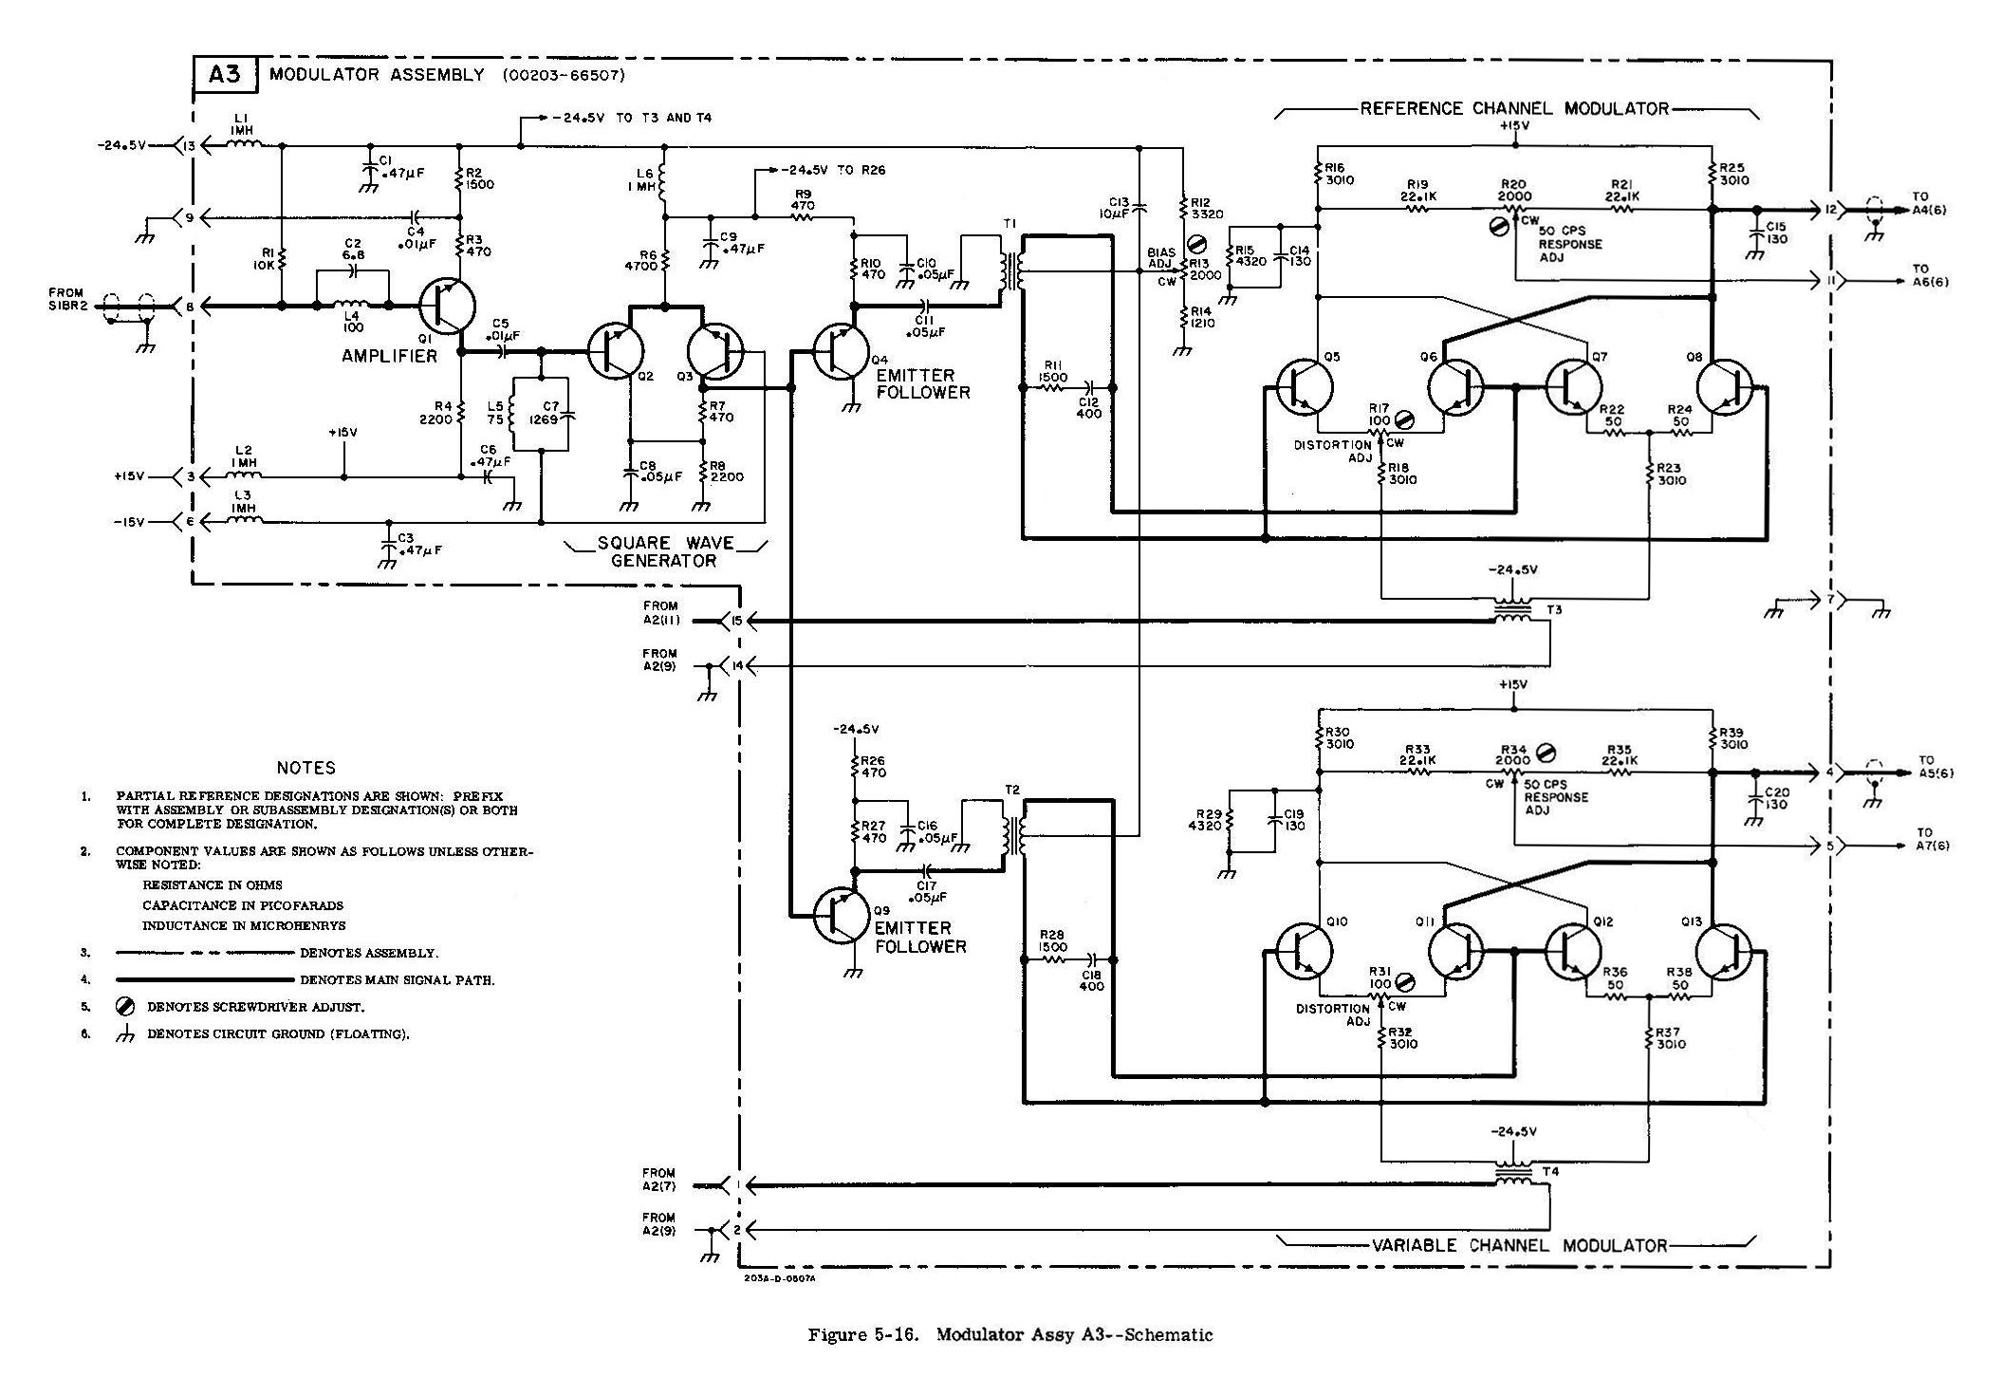
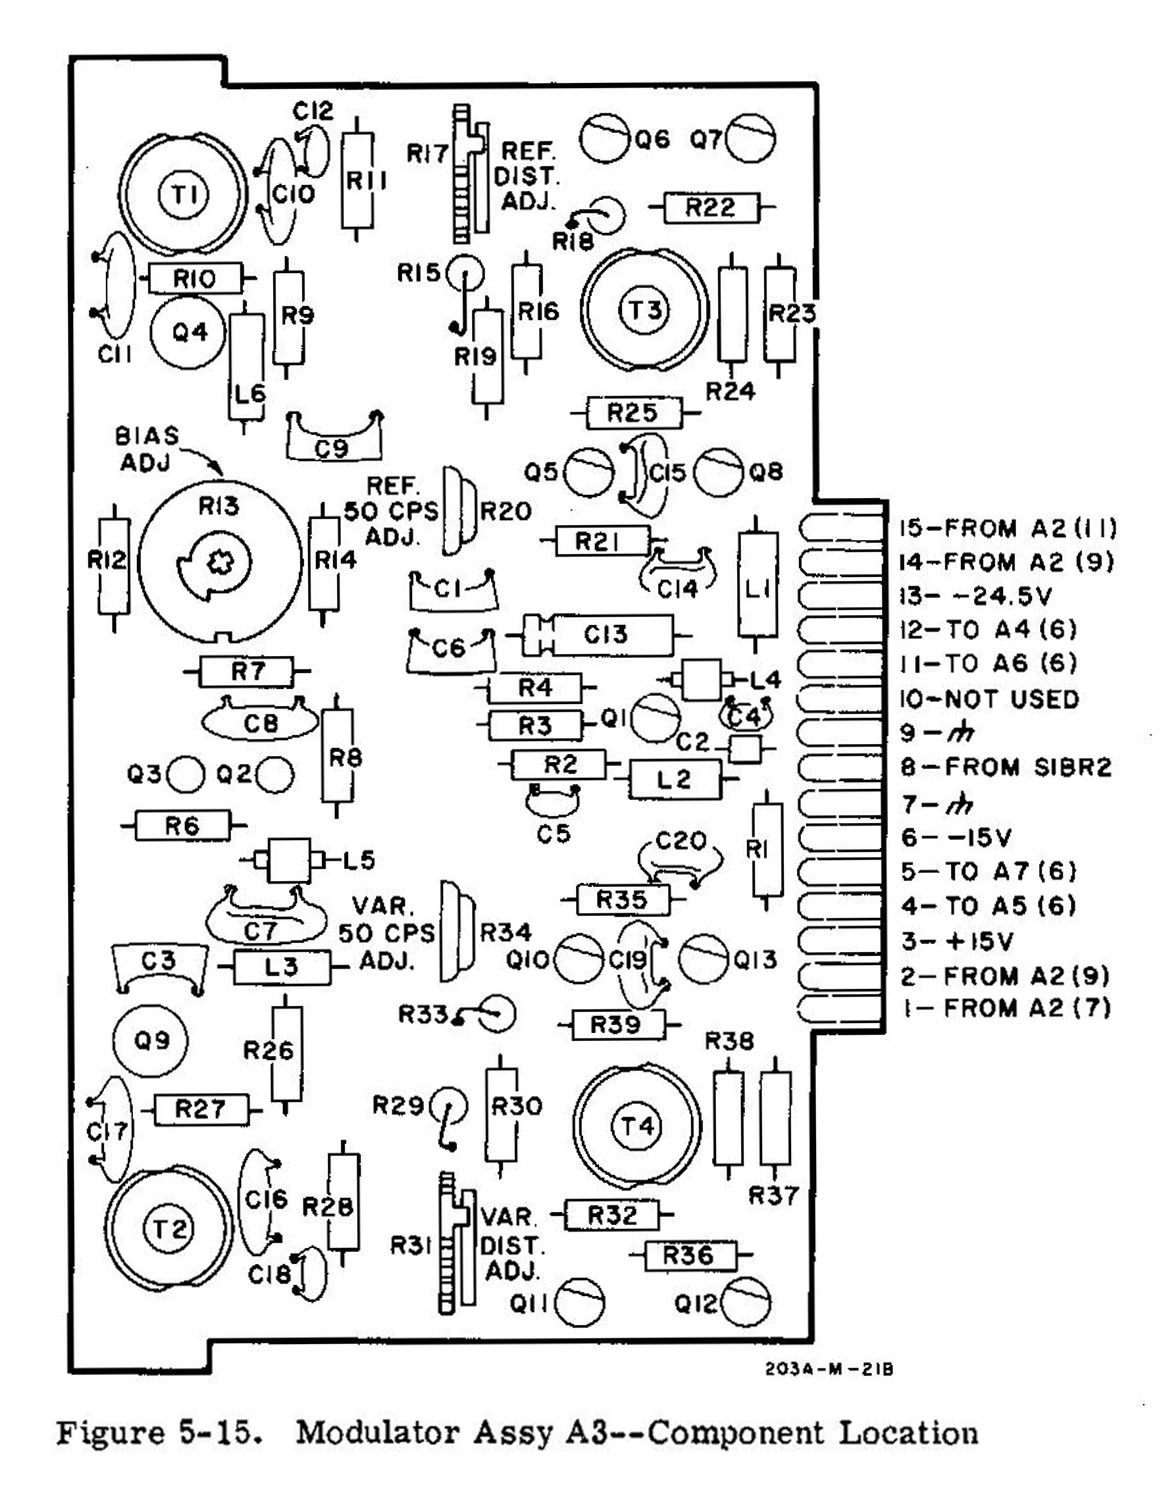
4-34. The Modulator assembly A3 consists of a modulator drive amplifier and two balanced switching type modulators; one for the REFERENCE PHASE channel, and the other for the VARIABLE PHASE channel. Refer to the schematic diagram, figure 5-16, for details.
4-35. MODULATOR DRIVER AMPLIFIER.
4-36. The frequency selected by the FREQUENCY dial and the FREQUENCY MULTIPLIER is applied to the input of the modulator driver amplifier A3Q1 where it is amplified and applied to A3Q2 and A3Q3. A3Q2 and A3Q3 act as an over driven amplifier which amplifies  and clips the signal applied to the base of A3Q2. This operation produces a square wave output at the collector of A3Q3 which is applied to the modulator section as a switching signal.
4-37. REFERENCE PHASE CHANNEL MODULATOR.
4-38. The modulator driving signal (VFO) and decade output is applied to the bases of the switching transistors (A3Q5 thru A3Q8). The fixed frequency, a 555 kc sine wave, is applied through series resistors to the emitters of the switching transistors. The output at the collectors is sine wave of the sum and difference frequencies. This signal is applied to the low pass filter assembly A4 (figure 5-18), The filter passes only the difference frequency, the output is a sine wave having a frequency that is between 0.005 cps and 60 kc depending on the position of the FREQUENCY MULTIPLIER switch and the FREQUENCY dial setting (refer to paragraph 1-5 for Options). The output signal is applied to the dc amplifier A6.
4-39. A dc reference voltage is derived by summing the signals at the collectors of A3Q5 and A3Q6. This dc reference voltage is used as a reference voltage for the differential amplifier in the dc amplifier  assembly A6.
4-40. VARIABLE PHASE CHANNEL MODULATOR.
4-41. The variable phase channel modulator operates the same as the reference phase channel described in paragraph 4-37, except that the output is applied to the Low Pass Filter A5 and then to the dc amplifier A7.
4-42. DC AMPLIFIER ASSEMBLIES A6 AND A7.
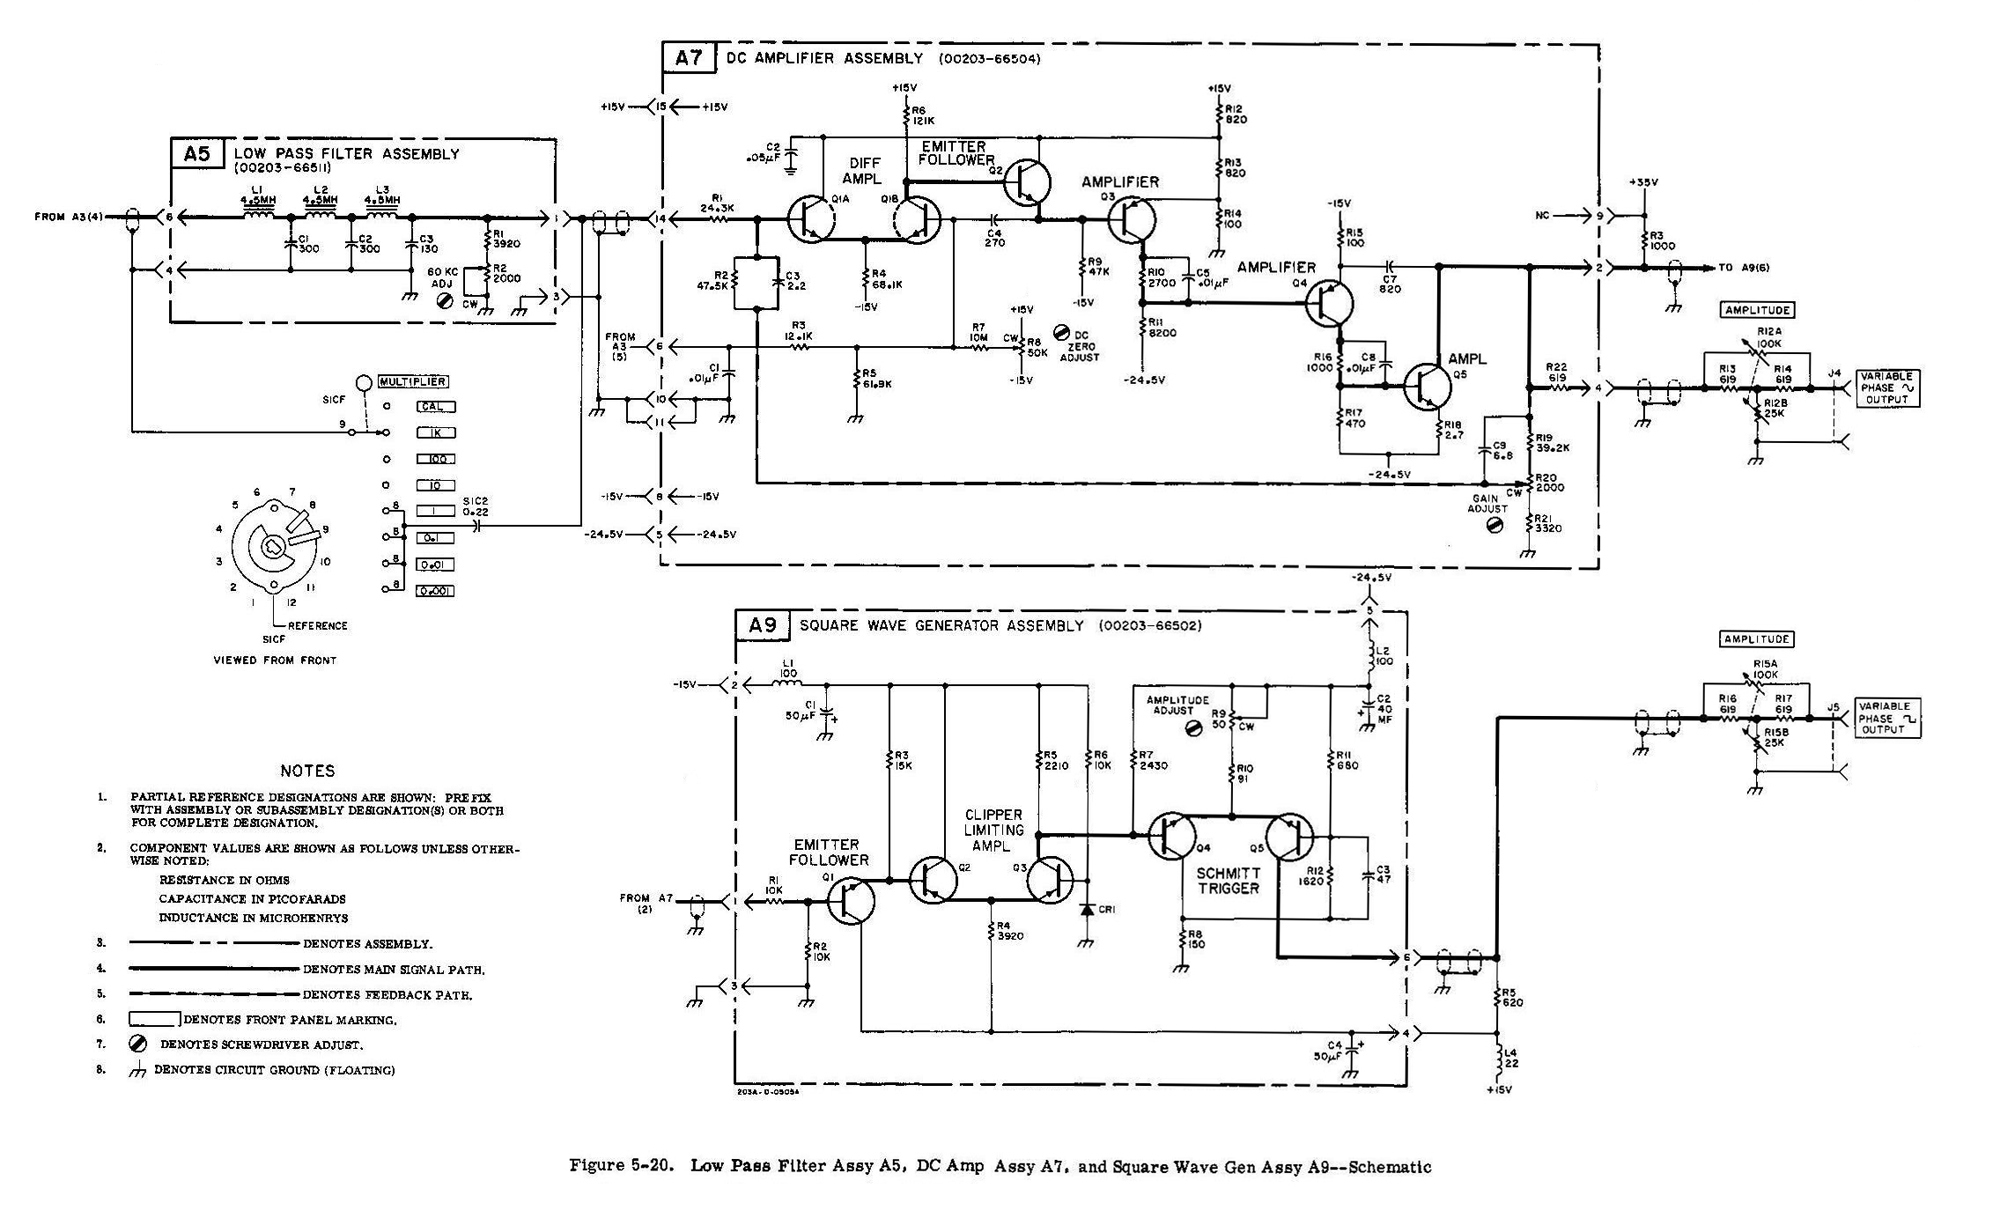
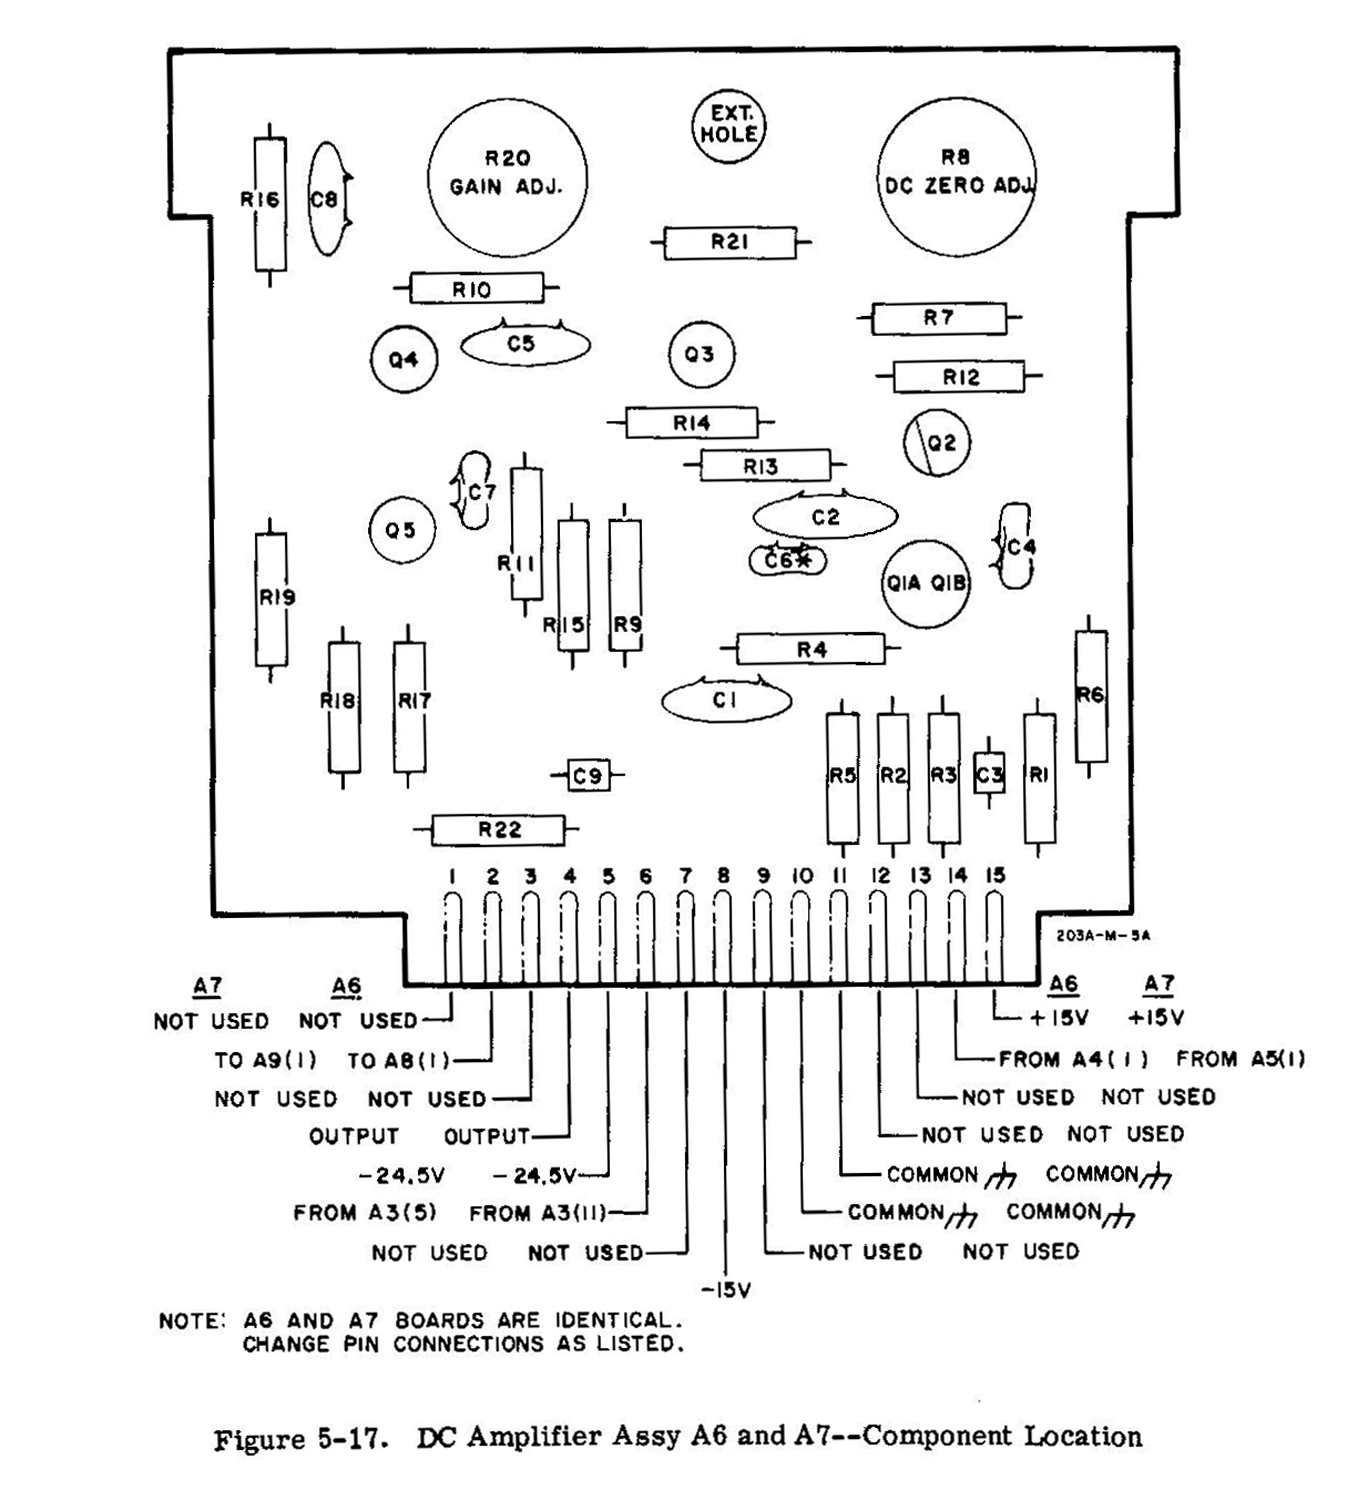
4-43. After passing through the low pass filter the signal is fed to the direct coupled amplifiers; A6 for the reference phase channel, and A7 for the variable phase channel. Refer to the schematic diagrams figures 5-18 and 5-20 for circuit details.
4-44. REFERENCES PHASE CHANNEL DC AMPLIFIER ASSEMBLY.
4-45. The dc amplifier uses a differential amplifier for the input stage. The dc reference voltage from the modulator section is used as the reference input for the differential amplifier. This configuration minimizes any tendency of dc drift due to power supply temperature variations. The dc amplifier circuit uses negative feedback to provide for low  distortion amplification. The output is applied to a bridged-T type attenuator and the square wave generator A8. 4-46. VARIABLE PHASE CHANNEL DC AMPLIFIER ASSEMBLY. 4-47. The variable phase channel dc amplifier operates  the same as the reference phase channel described  in paragraph 4-44, except that the output is applied to bridged-T type attenuator and the square wave generator, A9.
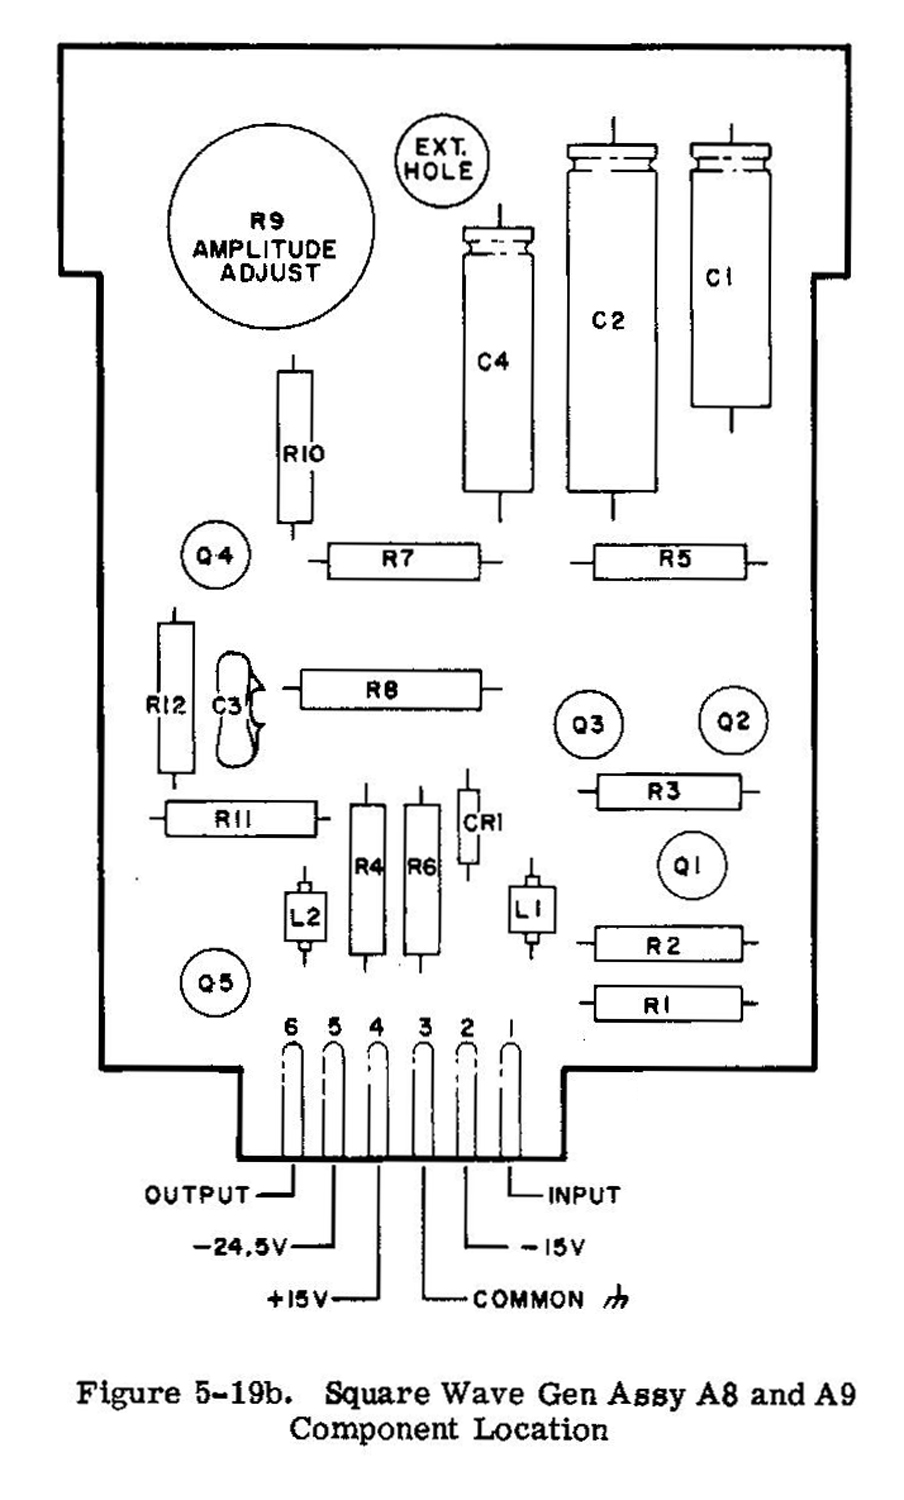
4-48. SQUARE WAVE AMPLIHER ASSEMBLIES A8 AND A9.
4-49. The output sine wave from the dc amplifier is applied to a square wave generator section, AB, for the REFERENCE PHASE channel, and A9 for the VARIABLE PHASE channel. Refer to the schematic diagrams, figures 5-18 and 5-20, for circuit details.

4-50. REFERENCE PHASE CHANNEL  SQUARE WAVE GENERATOR.
4-51. The sine wave from the dc amplifier is amplified  by A8Q1 then applied to the base of A8Q2. A8Q2 and A8Q3 act as an over driven amplifier which amplifies and clips the signal applied to the base of A8Q2, and produces a square wave at the collector of A8Q3. This square wave is applied to A8Q4 and A8Q5 which form a Schmitt trigger circuit. The Schmitt trigger is a regenerative circuit which changes states abruptly when the input signal crosses a specific dc triggering level. The output from this stage is a square wave having a rise time of less than 0.2 microsecond with the same frequency and phase as the sine wave signal applied to the circuit. The output is applied to a bridged-T attenuator.
4-52. VARIABLE PHASE CHANNEL SQUARE WAVE GENERATOR.
4-53. The variable phase channel square wave generator operates the same as the reference phase channel described in paragraph 4-50.
4-54. DC POWER SUPPLY A21. A22.
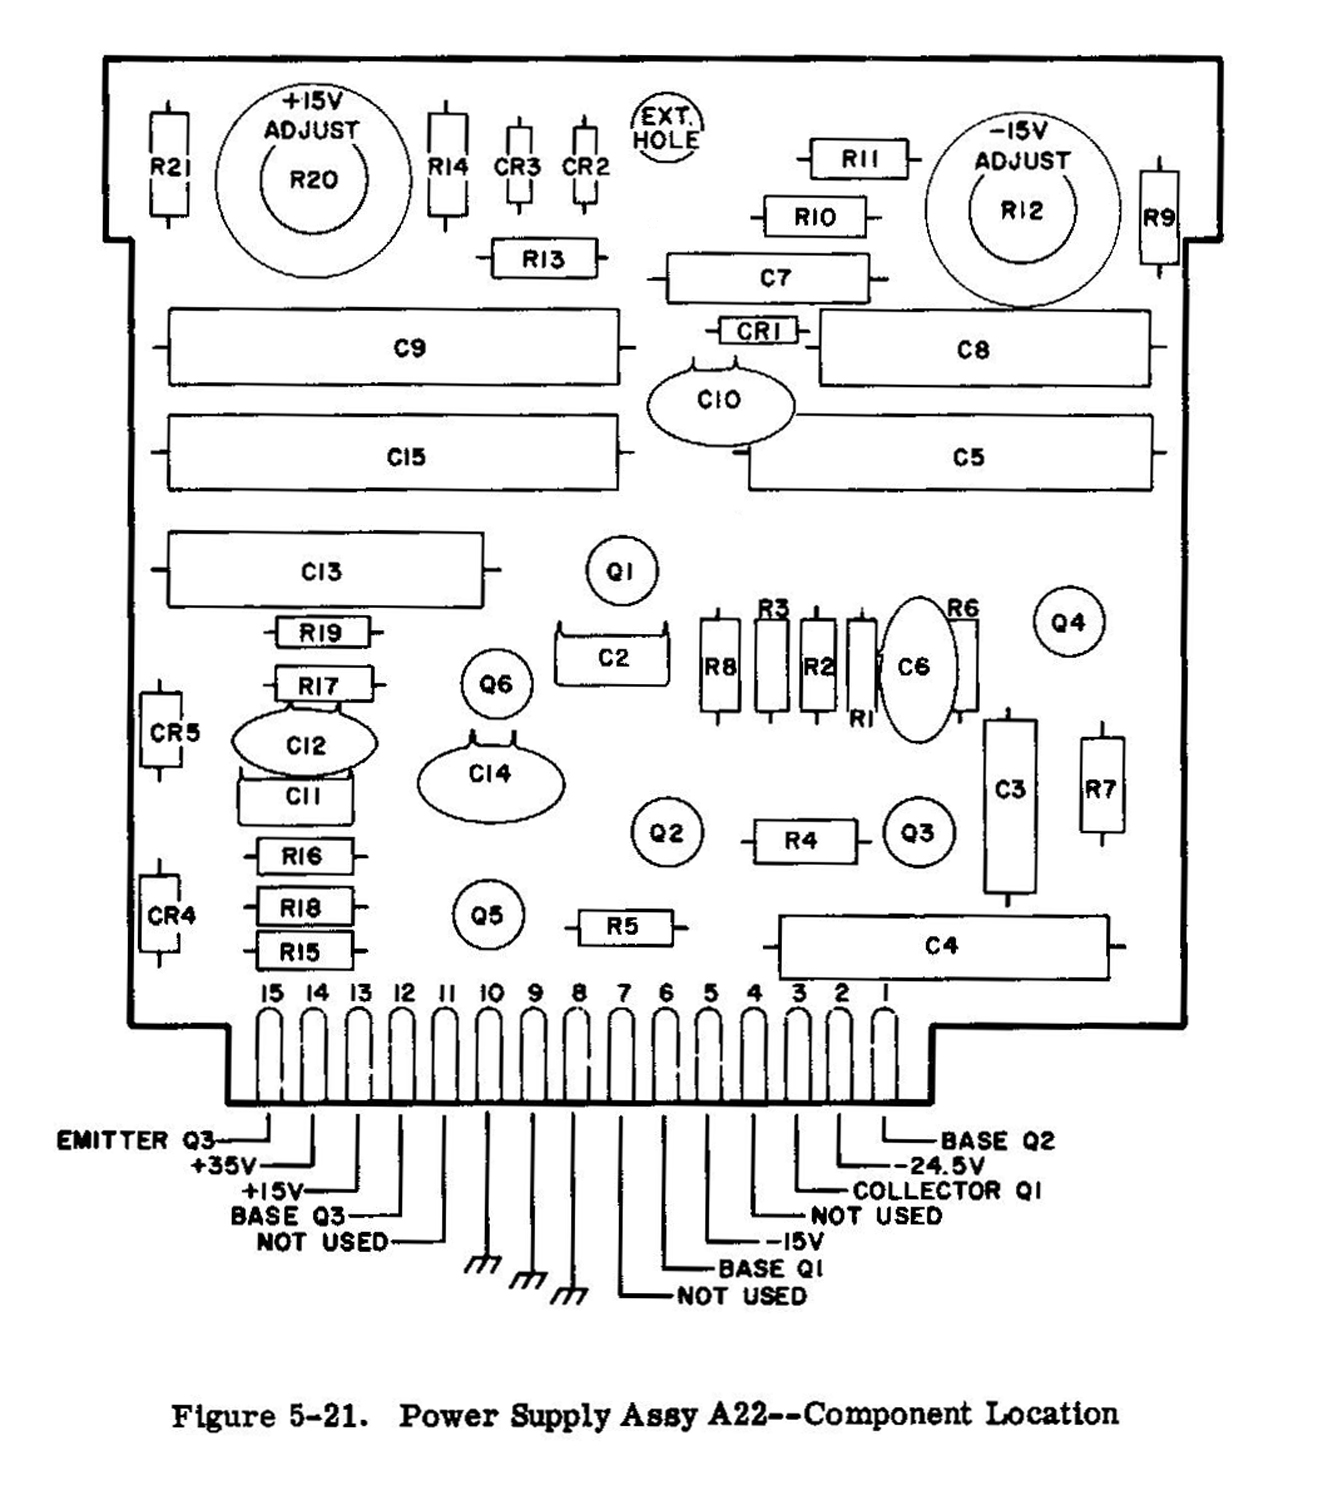
4-55. The dc power supply provides regulated +15, -15, and -24.5 volts and unregulated +35 volts.
4-56. CALIBRATION FEATURE.
4-57. A quick check for calibration of the frequency dial is a comparison between instrument and line  frequency. The FREQUENCY dial is set to 6 (CAL) and the FREQUENCY MULTIPLIER is set to the CAL  position. Through S1BR a 60 cycle output from A11 is applied to the pilot light which will mix with the 60 cycle line frequency. The pilot light will flicker at the difference or beat rate. This rate may be adjusted to minimum by the CAL ADJ control which slightly affects the VFO frequency. At a minimum rate of flicker the instrument’s 60 cycle frequency will be most nearly like the 60 cycle line frequency. For checking the exact frequencies throughout the ranges see paragraph 5-5 Frequency Dial Calibration».
§§§
Per consultare la prima parte scrivere “203A” su Cerca.
Foto di Claudio Profumieri, elaborazioni e ricerche di Fabio Panfili.
Per ingrandire le immagini cliccare su di esse col tasto destro del mouse e scegliere tra le opzioni.

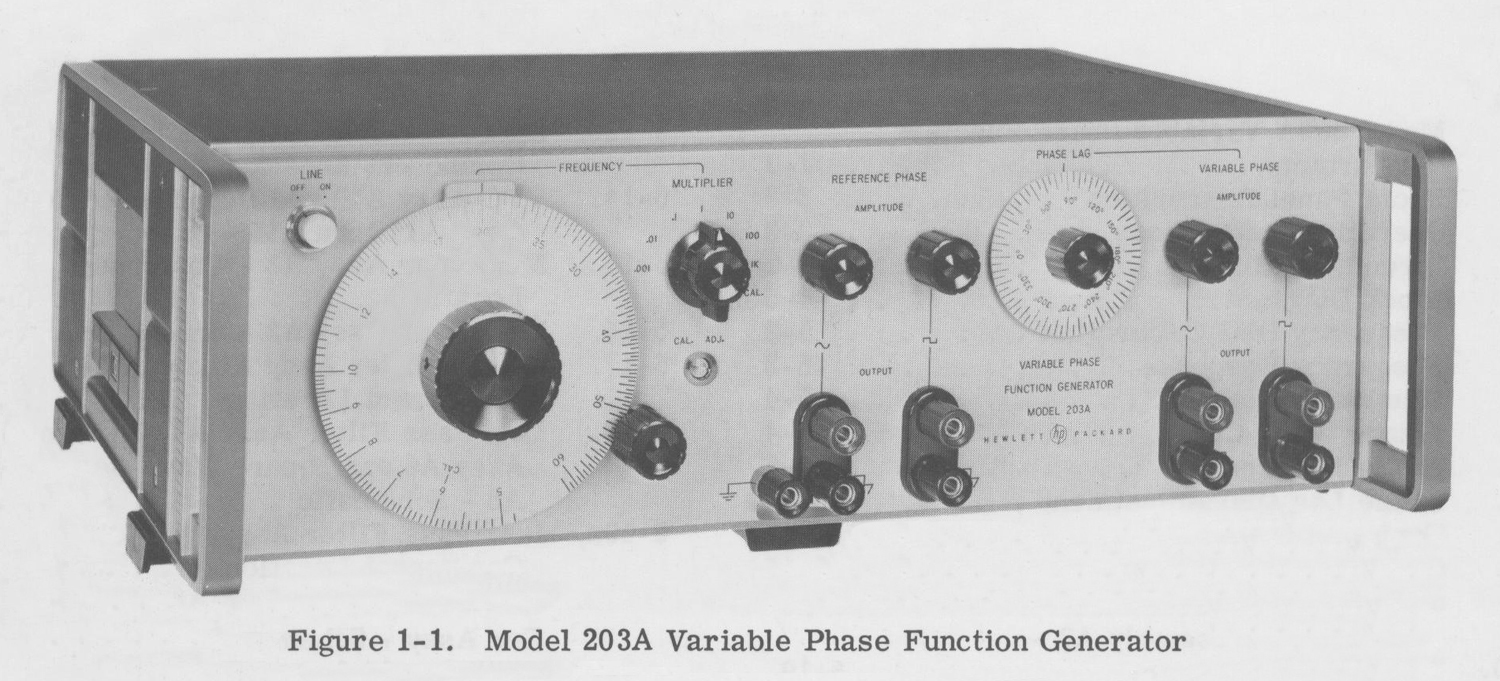
Variable Phase Function Generator Model 203A Hewlett Packard 1ª parte.

Variable Phase Function Generator, Model 203A, Hewlett Packard.  Prima parte.
Per cause indipendenti dalla nostra volontà non disponiamo dell’inventario generale dell’epoca.
Nell’inventario per reparto  N° 7 di Elettronica, in data febbraio 1968, al n° D 4224 si legge: “Function Generator 203/A”. Ma ce ne sono due esemplari; l’altro costruito dalla Yokogawa Hewlett Packard viene presentato nella seconda parte.
In rete si trovano vari documenti,  manuali di istruzioni e altre informazioni ai seguenti indirizzi:
http://hparchive.com/Manuals/HP-203A-Manual-sn425.pdf
http://www.hpl.hp.com/hpjournal/pdfs/IssuePDFs/1965-07.pdf
Presso la Sezione Elettronica è conservato il manuale di istruzioni nel quale si trovano note e disegni aggiunti a matita delle riparazioni fatte negli  anni.
Noi le abbiamo tolte per ridare ai disegni l’aspetto originale.
Quel che segue è parte delle istruzioni.
Abbiamo omesso il capitolo MAINTENANCE, pur pubblicandone alcune figure che riteniamo significative, ed altre parti.
§§§«SECTION I
GENERAL INFORMATION

1-1. DESCRIPTION.
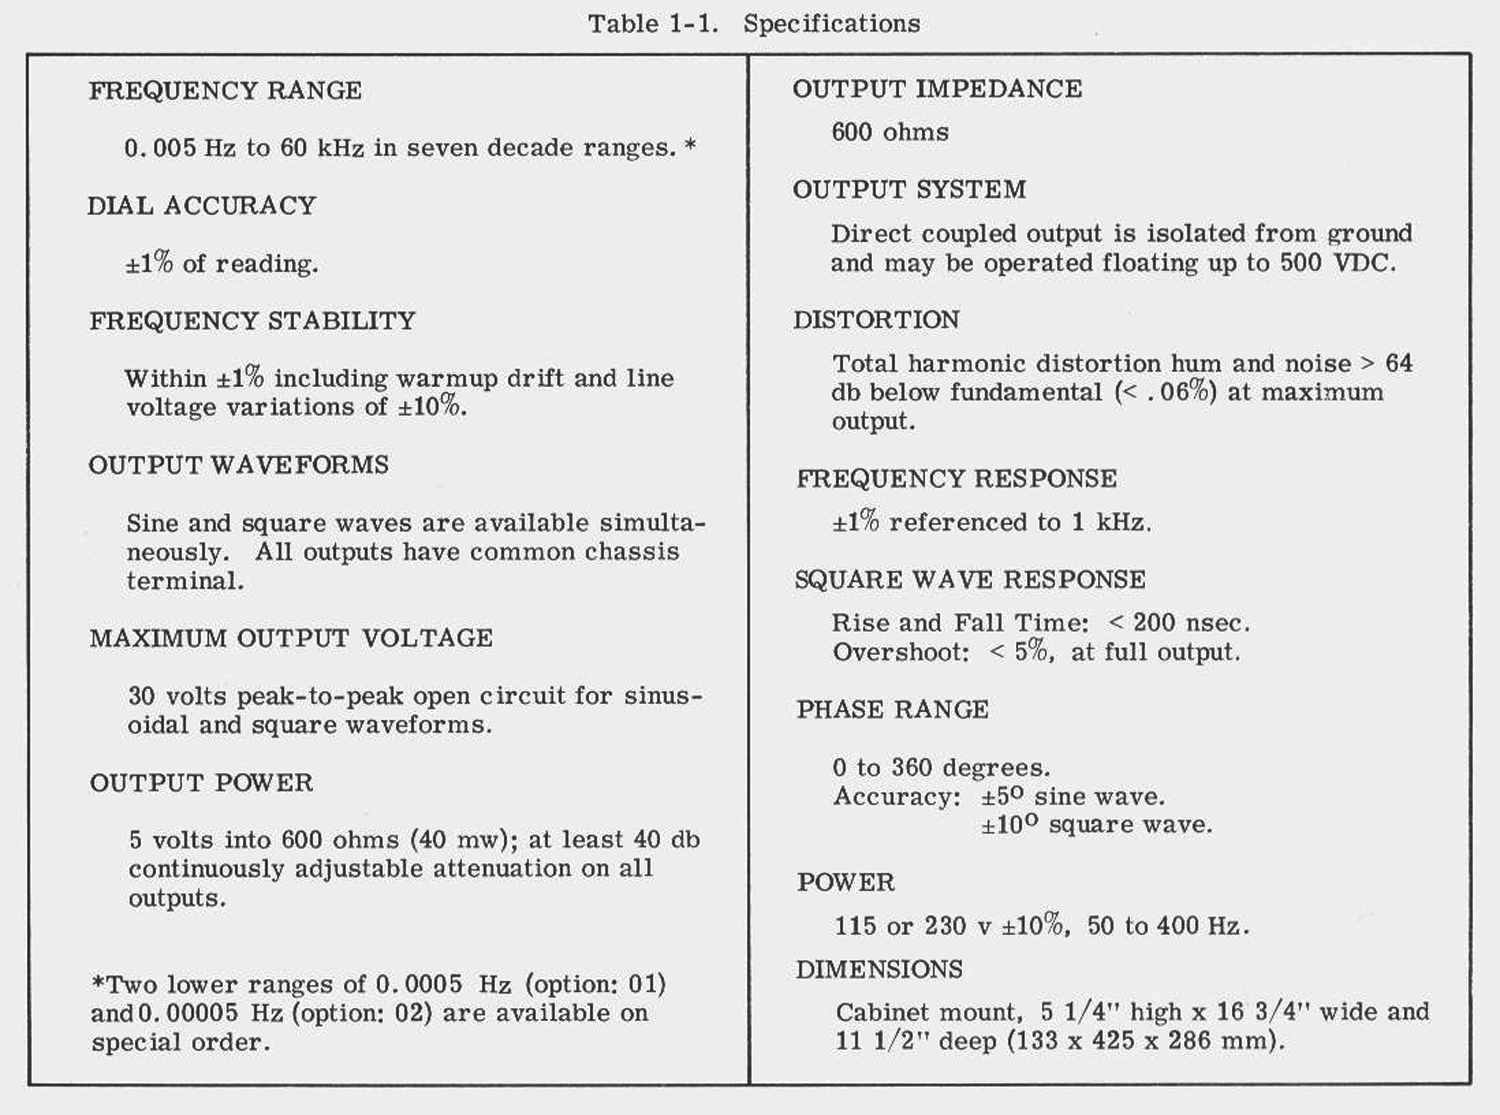
1-2. The Hewlett-Packard Model 203A Variable Phase Function Generator is a low frequency function generator which provides two sine wave and two square wave test signals at frequencies from 0.005 cps to 60 kc. (Refer to paragraph 1-5, Options Available).

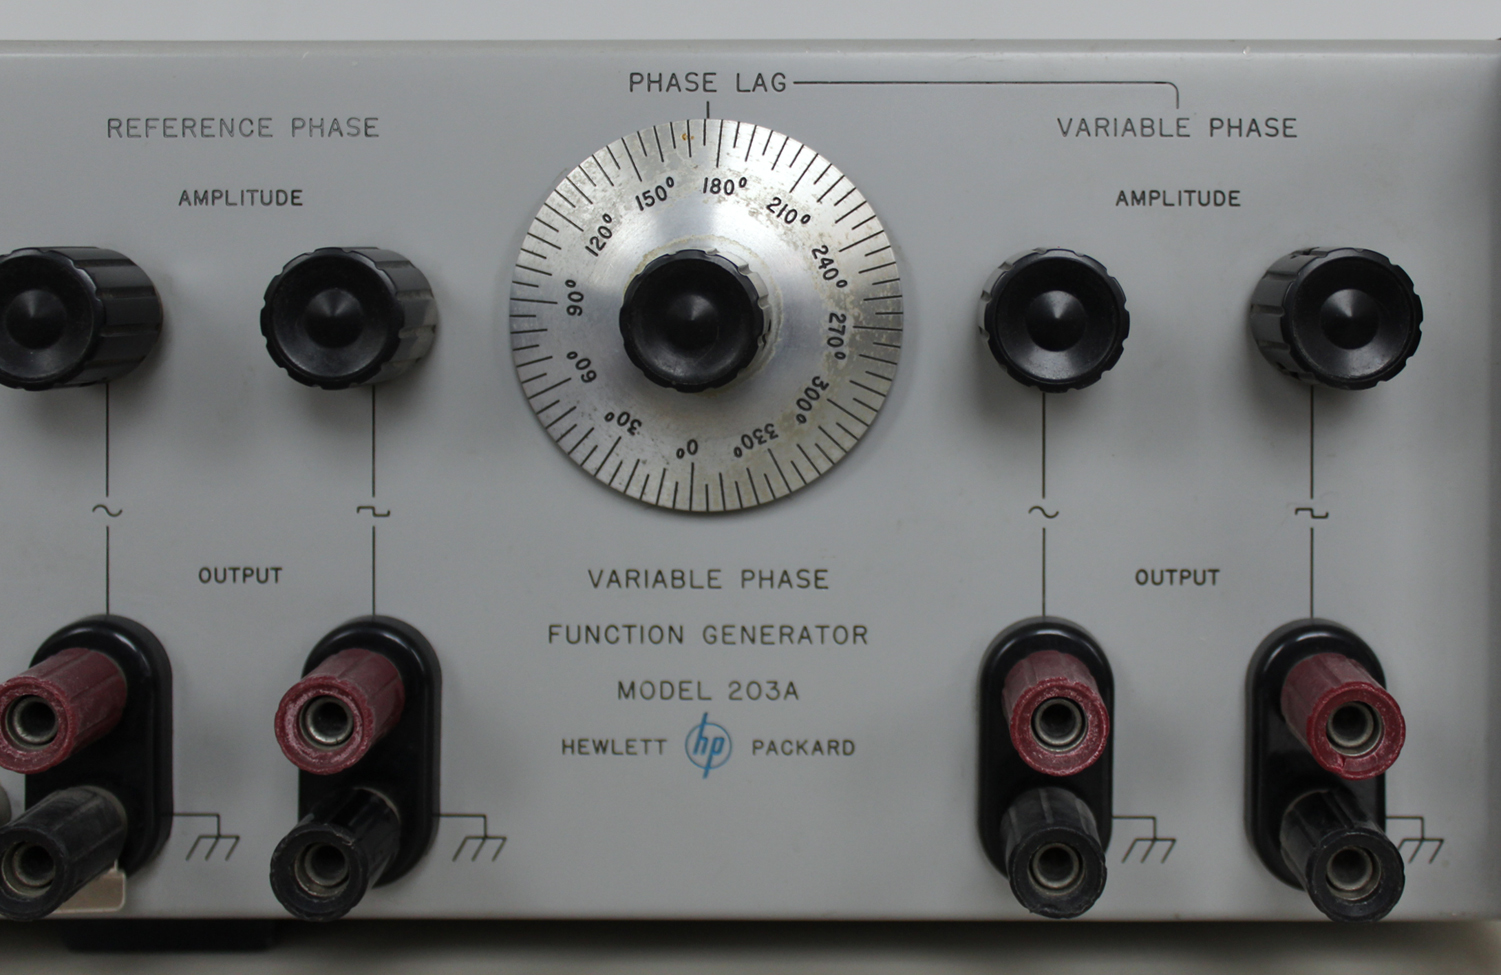
1-3. The four test signals are provided at the front panel OUTPUT connectors at an open circuit signal level of 30 volts peak-to-peak. The sine wave and square wave test signals provided at the REFERENCE PHASE OUTPUT connectors are fixed in phase and provide a reference phase for the test signals at the VARIABLE PHASE OUTPUT connectors. The variable phase test signals are continuously variable from 0° to 360° lag with respect to the phase of the reference test signals. The amplitude of the four output signals can be varied with individual continuously variable  40 db attenuators (AMPLITUDE controls).
1-4. The output terminals are floating with respect to ground and can be used to supply an output voltage with the common terminal grounded or can be floated up to 500 volts dc above chassis ground. The output impedance for all four test signal outputs is 600 ohms.
1-5. OPTIONS AVAILABLE.
1-6. Options 01 and 02 are available to provide two additional frequency ranges to the Model 203A. Option 01 includes one additional Decade Module Board Assembly which extends the lower limit of the frequency range from 0.005 cps to 0. 0005 cps. Option 02 includes two additional Decade Module Board Assemblies which extend the lower limit of the frequency range from 0. 005 cps to 0. 00005 cps. These two options can also be installed as a field modification (see Section VI for stock number of Decade Module Board Assemblies).
1-7. APPLICATIONS.
1-8. The Model 203A can be used for phase shift measurements, vibration studies, servo applications, medical research, distortion measurements, geophysical problems, subsonic and audio testing.

1-9. INSTRUMENT IDENTIFICATION.
1-10. Hewlett-Packard uses a two-section nine character (0000A00000) or eight character (000-00000 or 000A00000) serial number. The first three or four digits (serial prefix) identify a series of instrument; the last five digits identify a particular instrument in that series. A letter placed between the two sections identifies the country where the instrument was manufactured. The serial number appears on a plate located on the rear panel. All correspondence with Hewlett-Packard Sales/Service Offices with regard to an instrument should refer to the complete serial number.

1-11. If the serial prefix does not agree with the serial prefix on the title page of this manual, a “Manual Changes” sheet supplied will describe changes which will adapt this manual to an instrument with a different  serial prefix. Technical corrections (if any) to this manual, due to known errors in print, are called Errata and are shown on the change sheet. For information on manual coverage of any hp instrument, contact the nearest hp Sales/Service Office (addresses are listed at the rear of this manual).
SECTION II
INSTALLATION

2-1. INSPECTION.
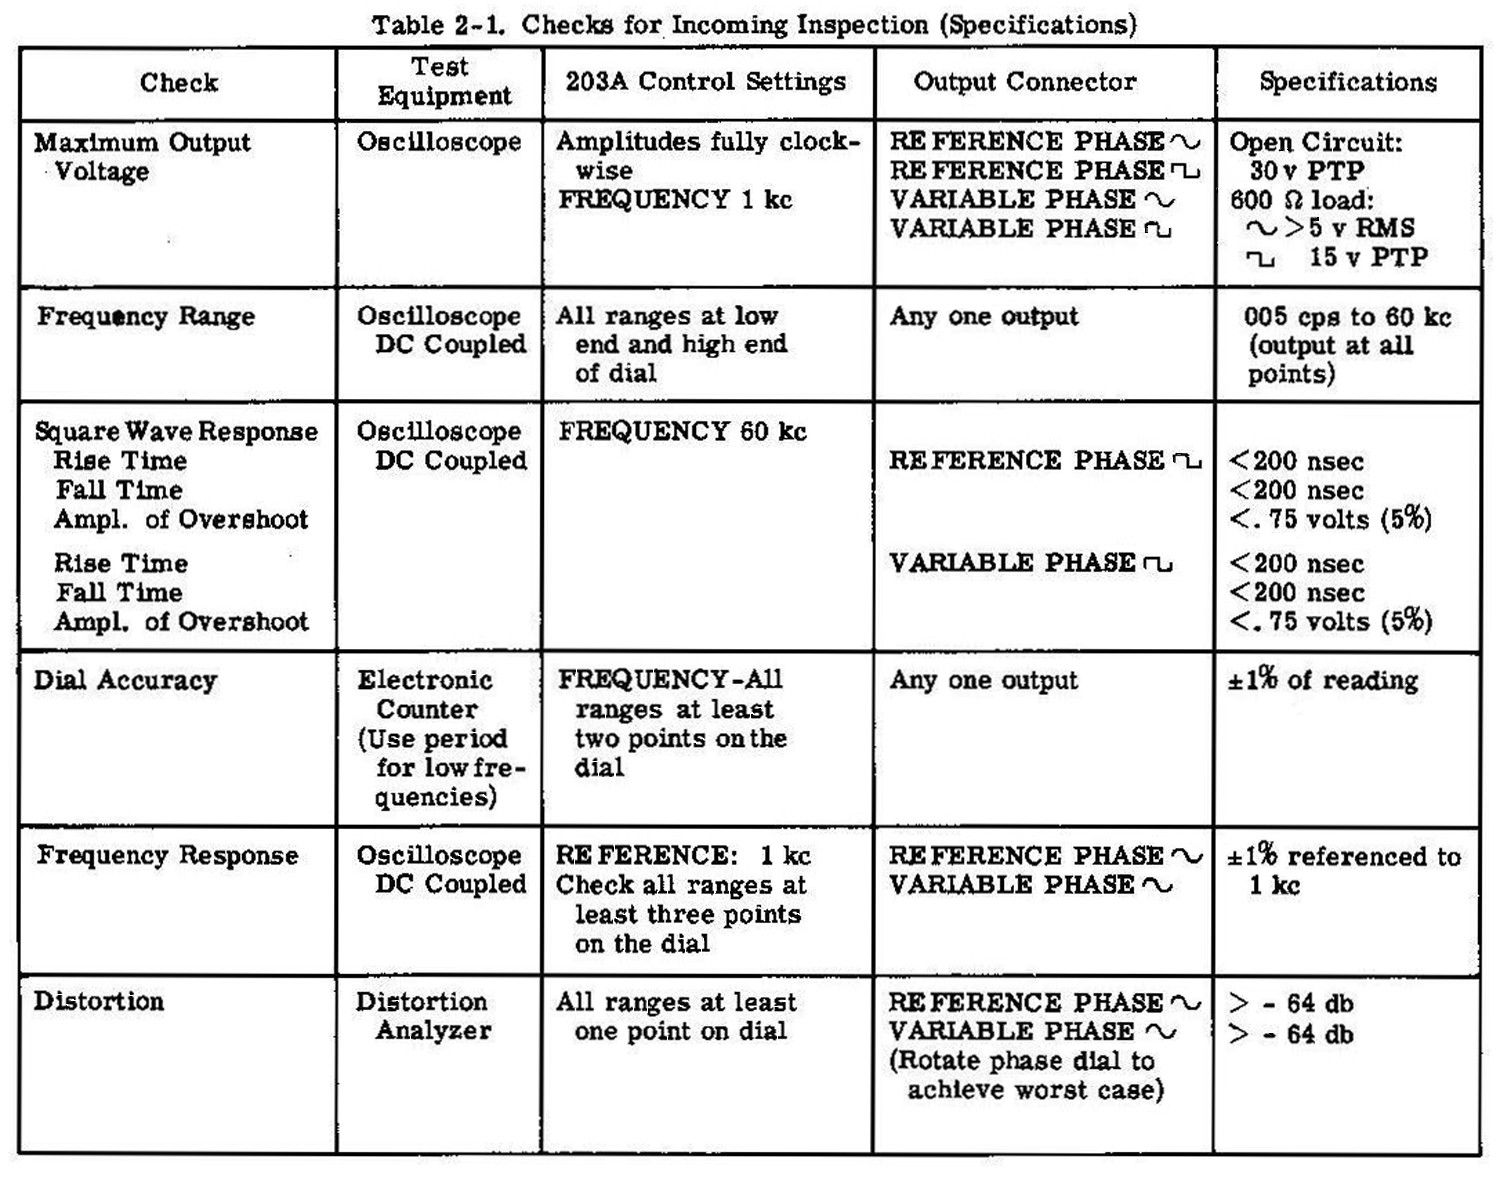
2-2. This instrument was carefully inspected both mechanically and electrically before shipment. It should be physically free of mars or scratches and in perfect electrical order upon receipt. To confirm this, the instrument should be inspected for physical damage in transit. Also check for supplied accessories, and test the electrical performance of the instrument using Table 2-1 or the procedure outlined in paragraph 5-3.  If there is any apparent damage, file a claim with the carrier and refer to the warranty on the inside front cover of this manual.

2-3. POWER REQUIREMENTS.
2-4. The Model 203A will operate from either 115 or 230 vac, 50 – 400 Hz. The instrument can be easily converted from 115 to 230 volt operation by changing the position of the slide switch, located on rear panel, so that the designation appearing on the switch matches the nominal voltage of the power source.
2-5. THREE-CONDUCTOR POWER CABLE.
2-6. To protect operating personnel, the National Electrical Manufacturers Association (NEMA) recommends that the instrument panel and cabinet be grounded. All Hewlett-Packard instruments are equipped with a three-conductor power cable which, when plugged into an appropriate receptacle, grounds the instrument. The offset pin on the power cable three-prong connector is the ground wire.

2-7. To preserve the protection feature when operating the instrument from a two-contact outlet. use a three-prong to two-prong adapter and connect the green pigtail on the adapter to ground.
2-8. INSTALLATION.
2-9. The Model 203A is fully transistorized; therefore no special cooling is required. However, the instrument should not be operated where the ambient temperature exceeds 55 °C (131 °F).

OMISSION: from par. 2.10 at par. 2.13 (editor’s note).SECTION III OPERATION
3-1. INTRODUCTION.
3-2. The Model 203A generates two sine wave and two square wave signals which are available simultaneously at the front panel OUTPUT connectors. The output signal frequency is determined by the position of the FREQUENCY dial and FREQUENCY MULTIPLIER switch. By the use of the PHASE LAG control, the phase of the VARIABLE PHASE OUTPUT signals (one sine wave and one square wave) can be continuously adjusted from 0° to 360° with respect to the REFERENCE PHASE OUTPUT Signals. The OUTPUT terminals provide an open-circuit signal level of 30 volts peak-to-peak. The individual AMPLITUDE controls provide 40 db of attenuation for each output signal. The CAL ADJ control provides a means of calibrating the FREQUENCY dial with the line frequency.

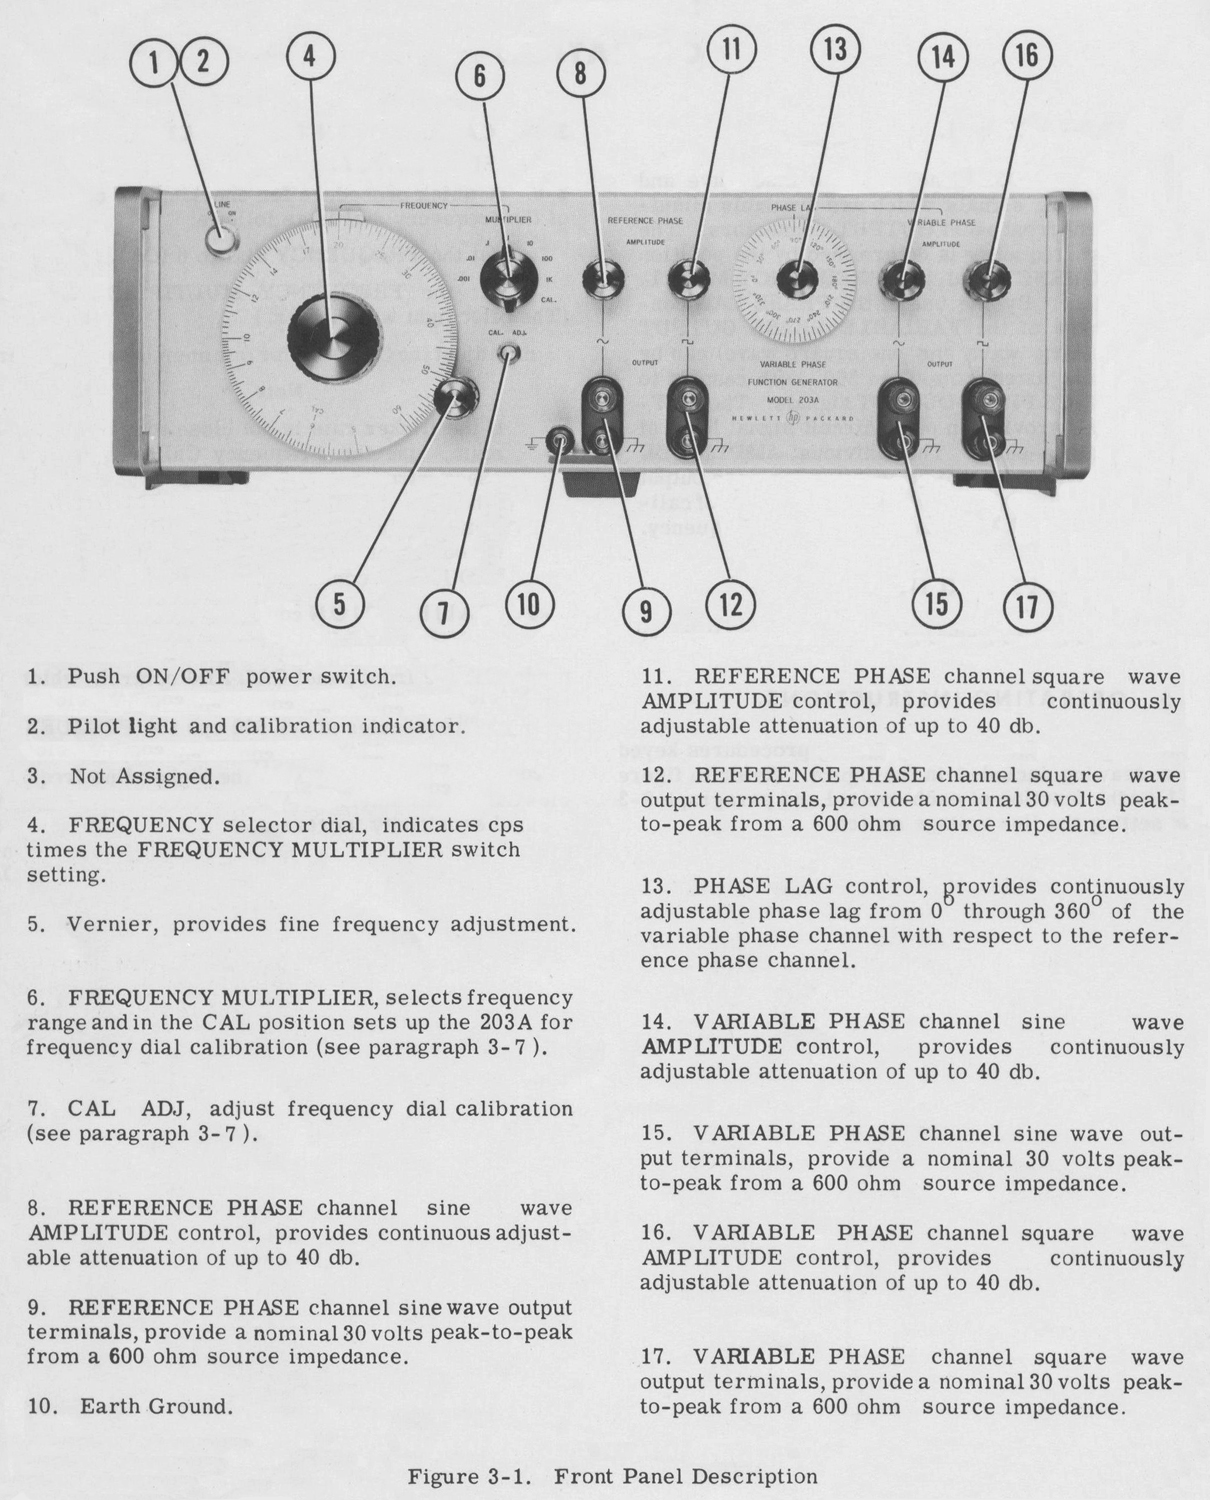
3-3. CONTROLS AND INDICATORS. 3-4. Figure 3-1 describes the function of all front panel controls, connectors, and indicators. The description of each component is keyed to a drawing  which is included within the figure.
3-5. OPERATING INSTRUCTIONS.
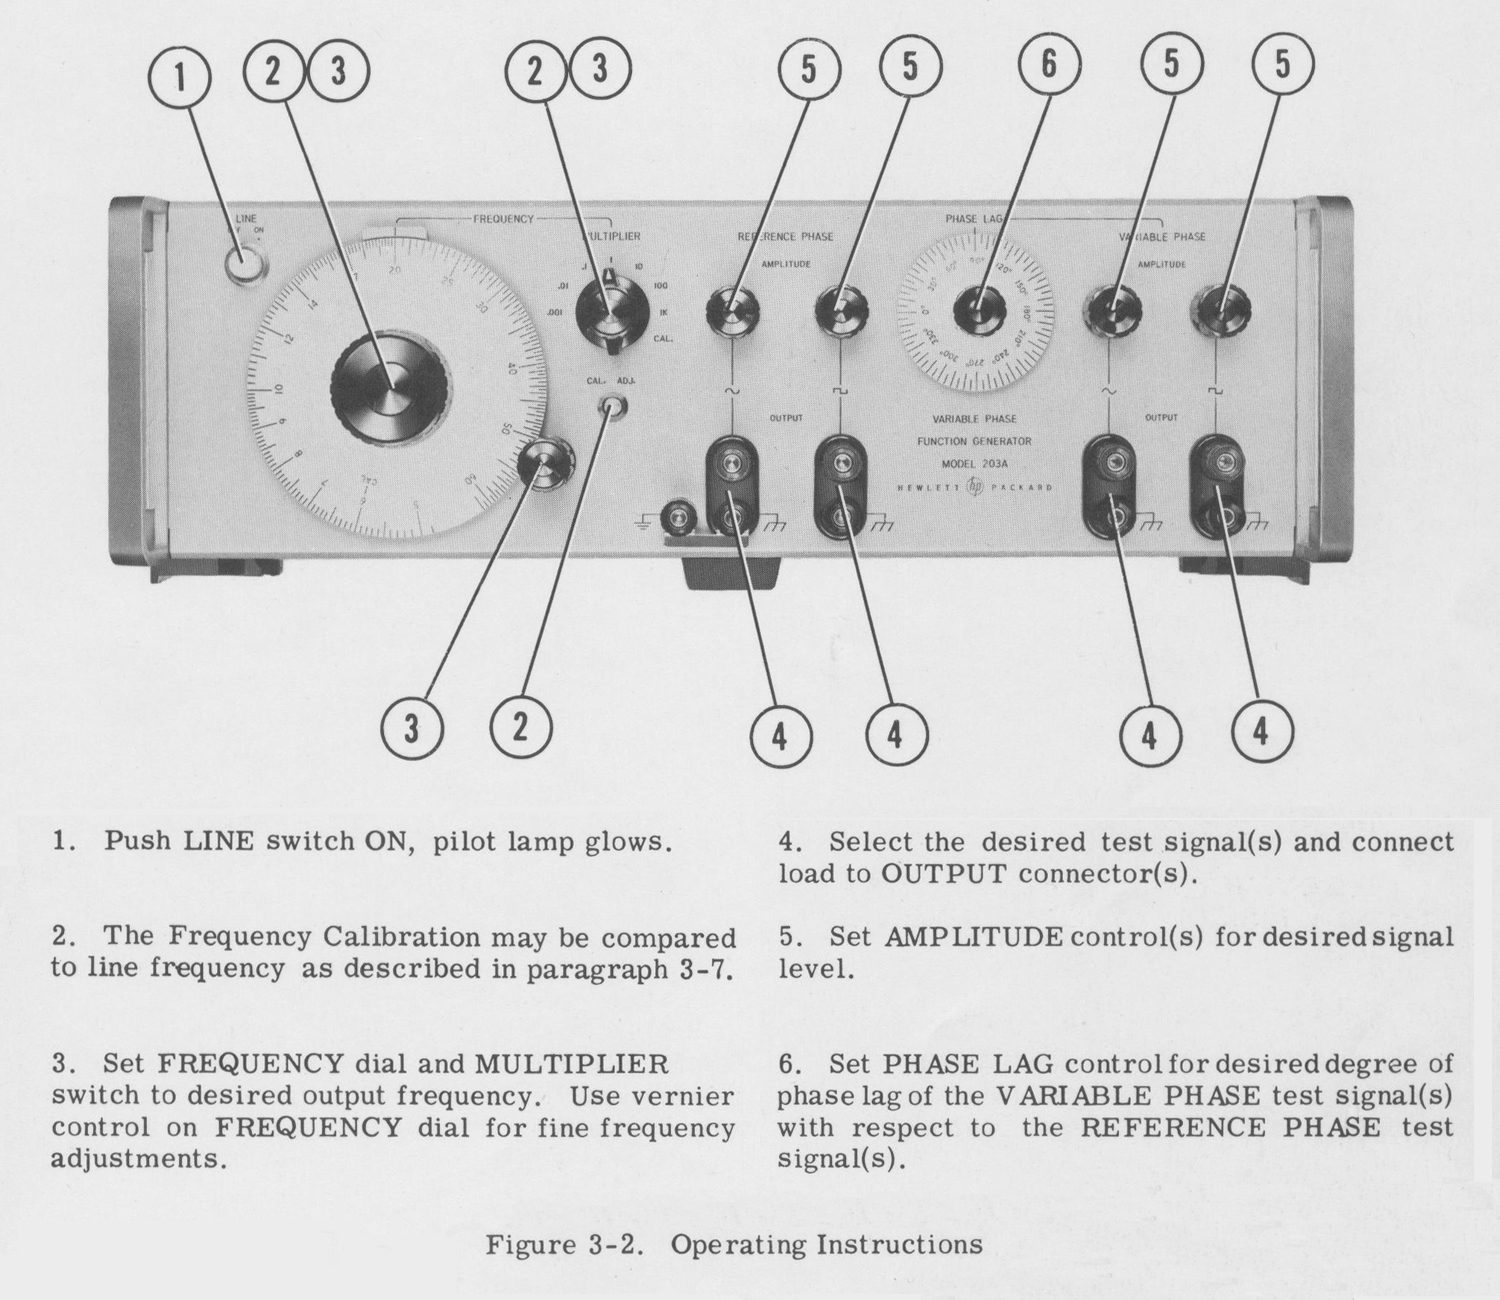
3-6. Figure 3-2 contains operating procedures keyed to a drawing included in the figure. Refer to figure 3-1 for the function of each control and paragraph 2-3 for setting the line voltage switch.
3-7. CALIBRATION FOR 60 CYCLE LINE FREQUENCY.
3-8. A quick procedure for checking the calibration of the frequency dial is as follows:

a. Set the FREQUENCY dial to 6 (CAL).
b. Set the FREQUENCY MULTIPLIER to CAL. (The pilot light will flicker. ).
c. Adjust the CAL ADJ for minimum rate of flicker.
                                   Note
If the flicker rate is not close to minimum, use the Frequency Calibration check paragraph 5- 5. When the FREQUENCY MULTIPLIER switch is in the CAL position, there is no output at the REFERENCE PHASE OUTPUT connector.
3-9. CALIBRATION FOR LINE FREQUENCIES OTHER THAN 60 CYCLES.
3-10. For line frequencies other than 60 cps the FREQUENCY dial is set to 1/10 of the line frequency (40 to 400 cps line frequency). Again the calibration is made with the front panel CAL ADJ control, which is adjusted for a minimum flicker rate of the pilot lamp. For line frequencies above 600 cps the FREQUENCY dial is set to 1/30 of the line frequency (33.3 for a 1000 cps line frequency). At the higher line frequencies the flicker intensity decreases and the CAL ADJ control sensitivity increases.
SECTION IV
PRINCIPLES OF OPERATION

4-1. OVERALL DESCRIPTION.
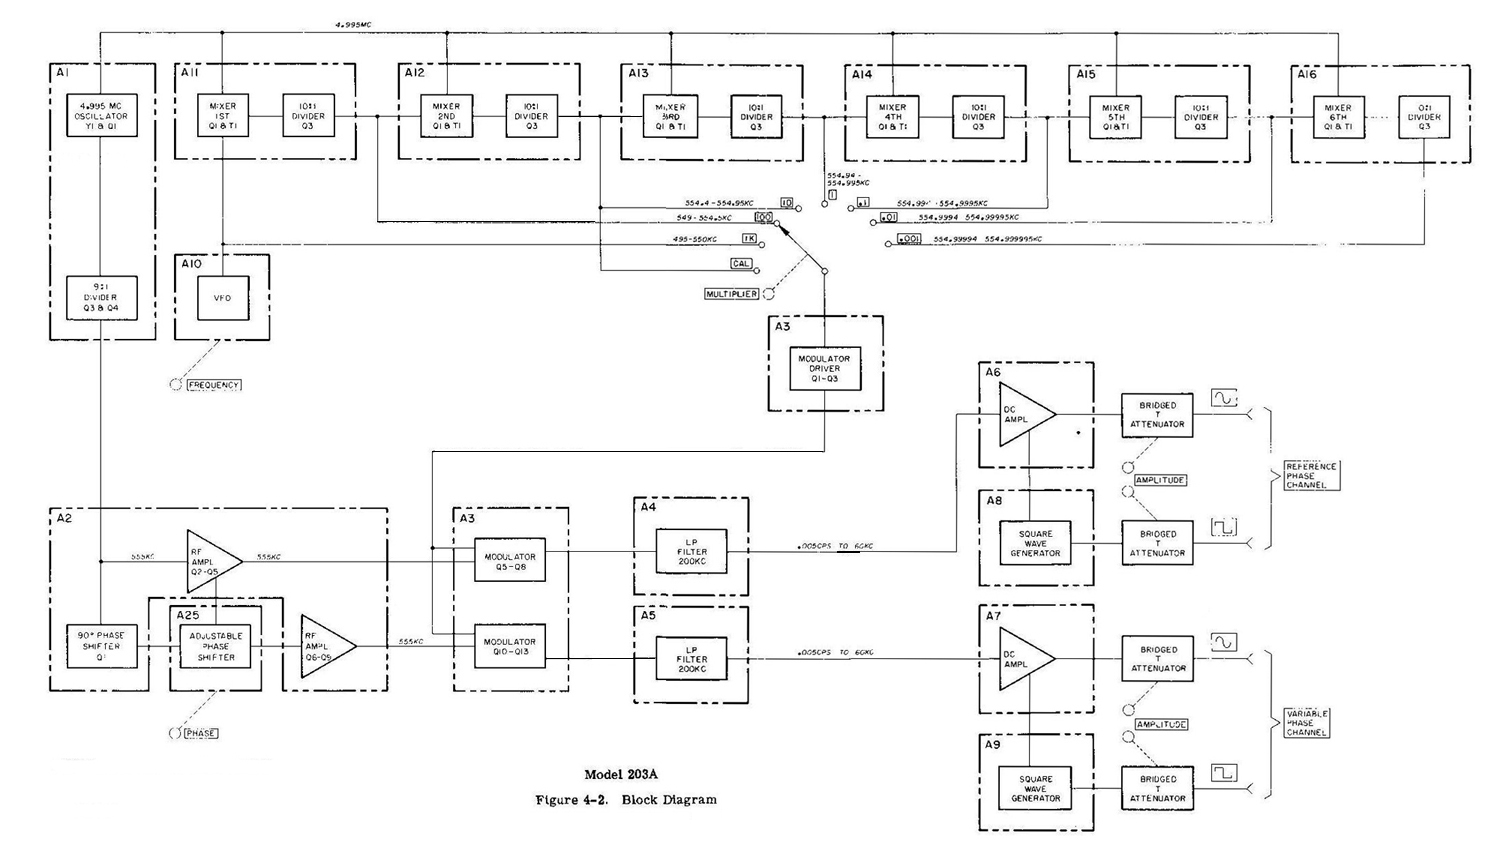
4-2. This section describes how the Model 203A Variable Phase Function Generator operates. The block diagram, figure 4-2, shows the main sections and the signal flow within the Model 203A.

4-3. The Model 203A is a beat-frequency oscillator which, by mixing two high-frequency signals, generates signals in the frequency range of 0.005 cps to 60 kc (refer to paragraph 1-5 for options). One of the high-frequency signals is a fixed frequency; the other is variable. The Model 203A has two signal channels, REFERENCE PHASE and VARIABLE PHASE, each of which produces a sine-wave signal and a square-wave signal. The two channels are electrically similar except that the VARIABLE PHASE channel contains a continuously adjustable phase-shifting circuit which changes the phase relationship of the VARIABLE PHASE OUTPUT with respect to the REFERENCE PHASE OUTPUT. The four signals (two reference phase and two variable phase) are available simultaneously at the OUTPUT connectors.
4-4. The fixed frequency signal, which is generated by a crystal oscillator, is applied to both channels and routed to a modulator through an RF Amplifier within each channel. The variable frequency signal is applied directly to the modulator of each channel. The frequency of the variable frequency signal is controlled by the position of the FREQUENCY dial and the setting of the FREQUENCY MULTIPLIER switch.  These two signals are mixed in the modulator and the difference in frequency between the two signals is the output frequency of the Model 203A.
4-5. CRYSTAL OSCILLATOR AND DIVIDER ASSEMBLY (A1).
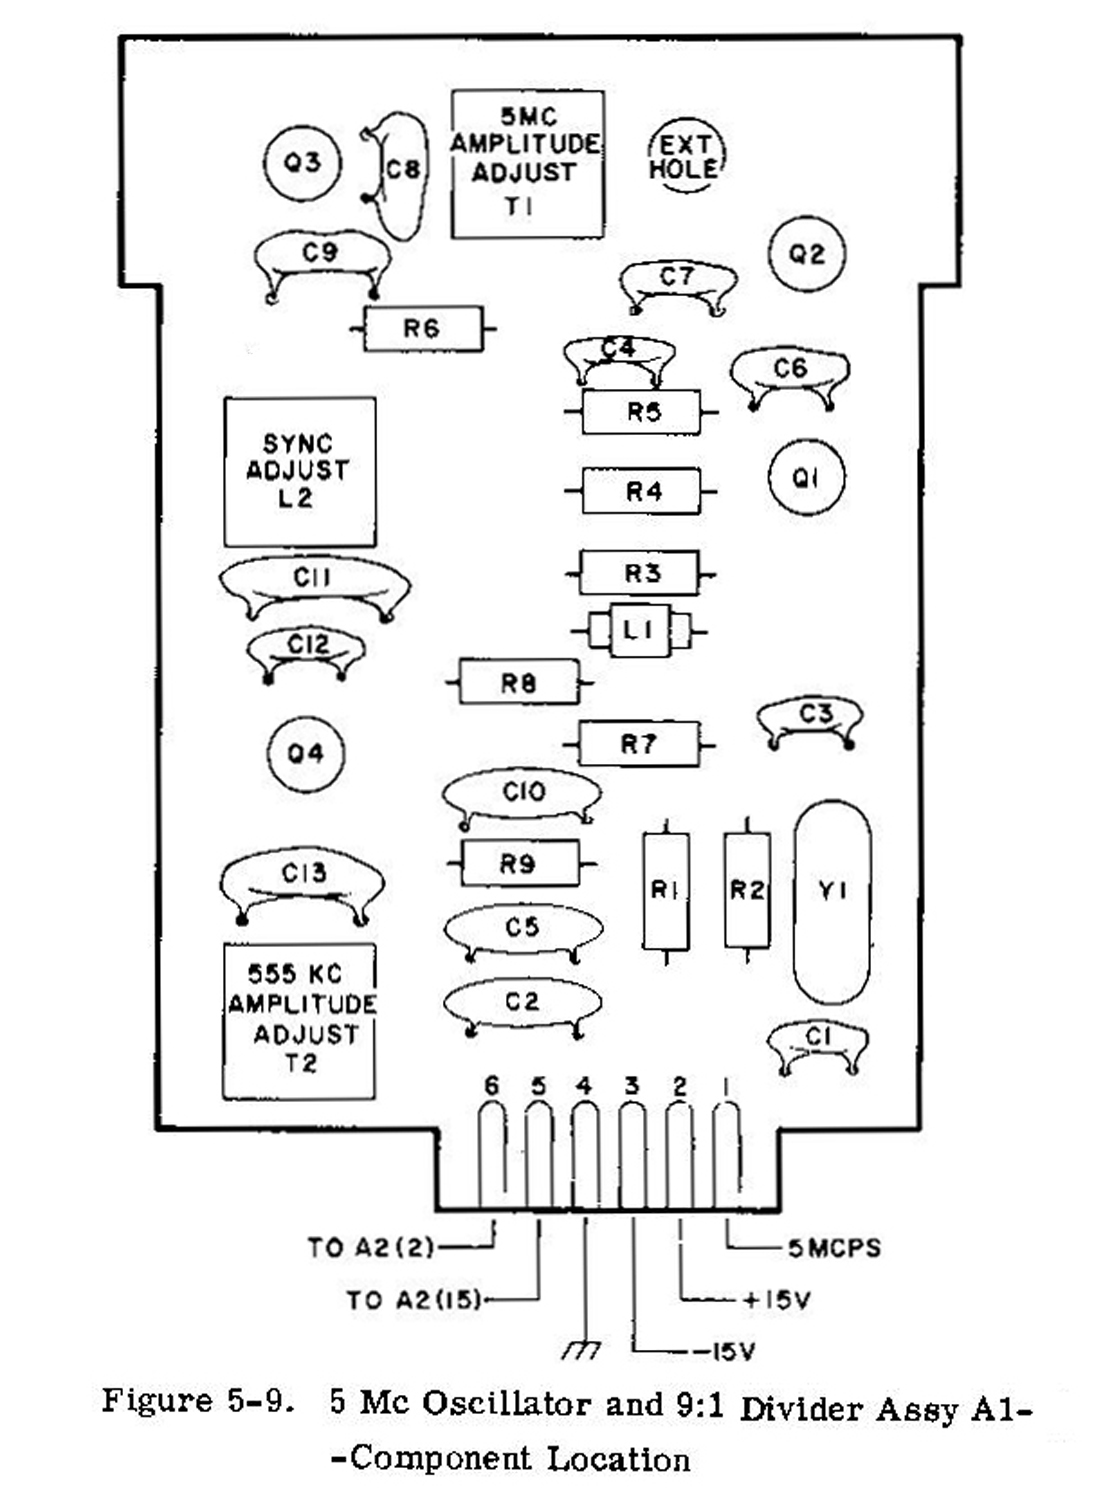
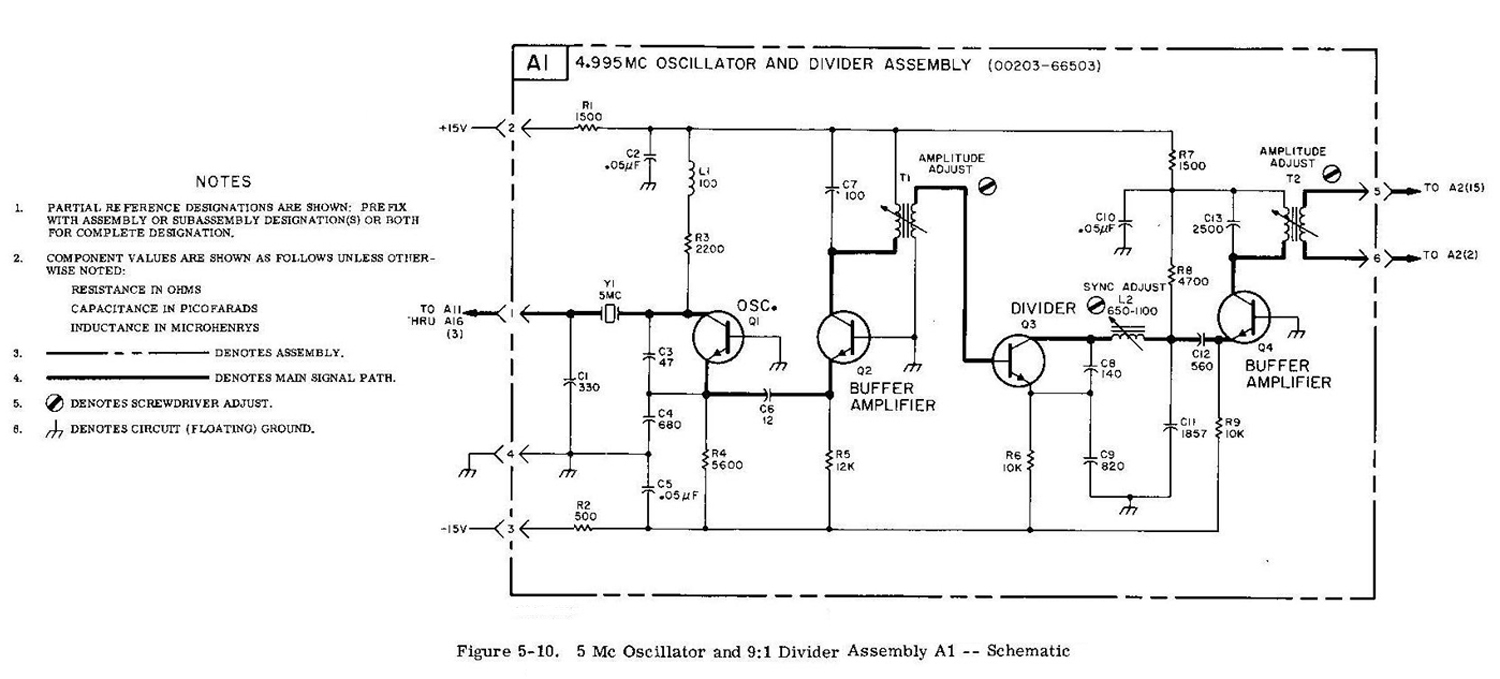
4-6. Assembly A1 consists of a crystal controlled oscillator and a 9:1 frequency divider. Refer to the schematic diagram, figure 5-10, for circuit details.
4-7. CRYSTAL OSCILLATOR.
4-8. The oscillator (A1Y1 and A1Q1) is a crystal controlled grounded base Colpitts oscillator. The 5 Mc output is applied through buffer amplifier A1Q2, for isolation, to the base of the 9:1 frequency divider.
4-9. 9:1 FREQUENCY DIVIDER.
4-10. The 9:1 divider consists of a divider A1Q3 and a tank circuit which consists of A1C8, A1C9, A1C11, and A1L2. The divider is basically a class C grounded base Colpitts oscillator.
4-11. Two things occur during each cycle of the divider operation. One is amplitude modulation of the signal applied to the base of A1Q3, and the second is a mixing action within A1Q3. Each function occurs at a different time during each cycle of oscillation and together tend to synchronize A1Q3 with a sub-multiple frequency of the frequency applied to the base of the divider.
4-12. Divider A1Q3 operates in the region of voltage saturation for a portion of each cycle. During the saturation period, the impedance between the base and collector of A1Q3 becomes very low; for the rest of cycle the impedance between the base and collector is relatively high. The variation in impedance between base and collector of A1Q3 results in amplitude modulation (about 10%) of the signal on the base of the divider. This amplitude modulation creates sidebands at the 8th and 10th harmonic of the divider oscillating frequency.
4-13. The signal applied to the base of A1Q3 is about 4.995 Mc which is generated by the crystal oscillator circuit. The tank circuit of the 9:1 divider is tuned so that A1Q3 is oscillating at the 9th sub-multiple frequency of 4.995 Mc (555 kc).
4-14. The mixing-process within A1Q3 occurs at the time during each cycle when the divider just starts to conduct. During this short time, the 8th and 10th harmonic of the 555 kc signal are mixed with the 9th harmonic resulting in a frequency component at 555 kc which influences the oscillations of A1Q3. The result is that A1Q3 stays synchronized to the 9th sub-harmonic of 4.995 Mc. 4-15. The pi type tank circuit filters out harmonic frequencies which may be present at the collector of A1Q3. A buffer amplifier A1Q4 provides further filtering, isolation, and power gain. The output of the 9:1 divider is a 555 kc signal and is coupled by A1T2 to A2Q1 and A2Q2 (see figures 5- 10 and 5-12)».
Per consultare la seconda parte scrivere “203A” su Cerca.
Foto di Claudio Profumieri, elaborazioni e ricerche di Fabio Panfili.
Per ingrandire le immagini cliccare su di esse col tasto destro del mouse e scegliere tra le opzioni.

Frequency Meter HP mod. 500B 2ª parte


Frequency Meter HP mod. 500B. Seconda parte.
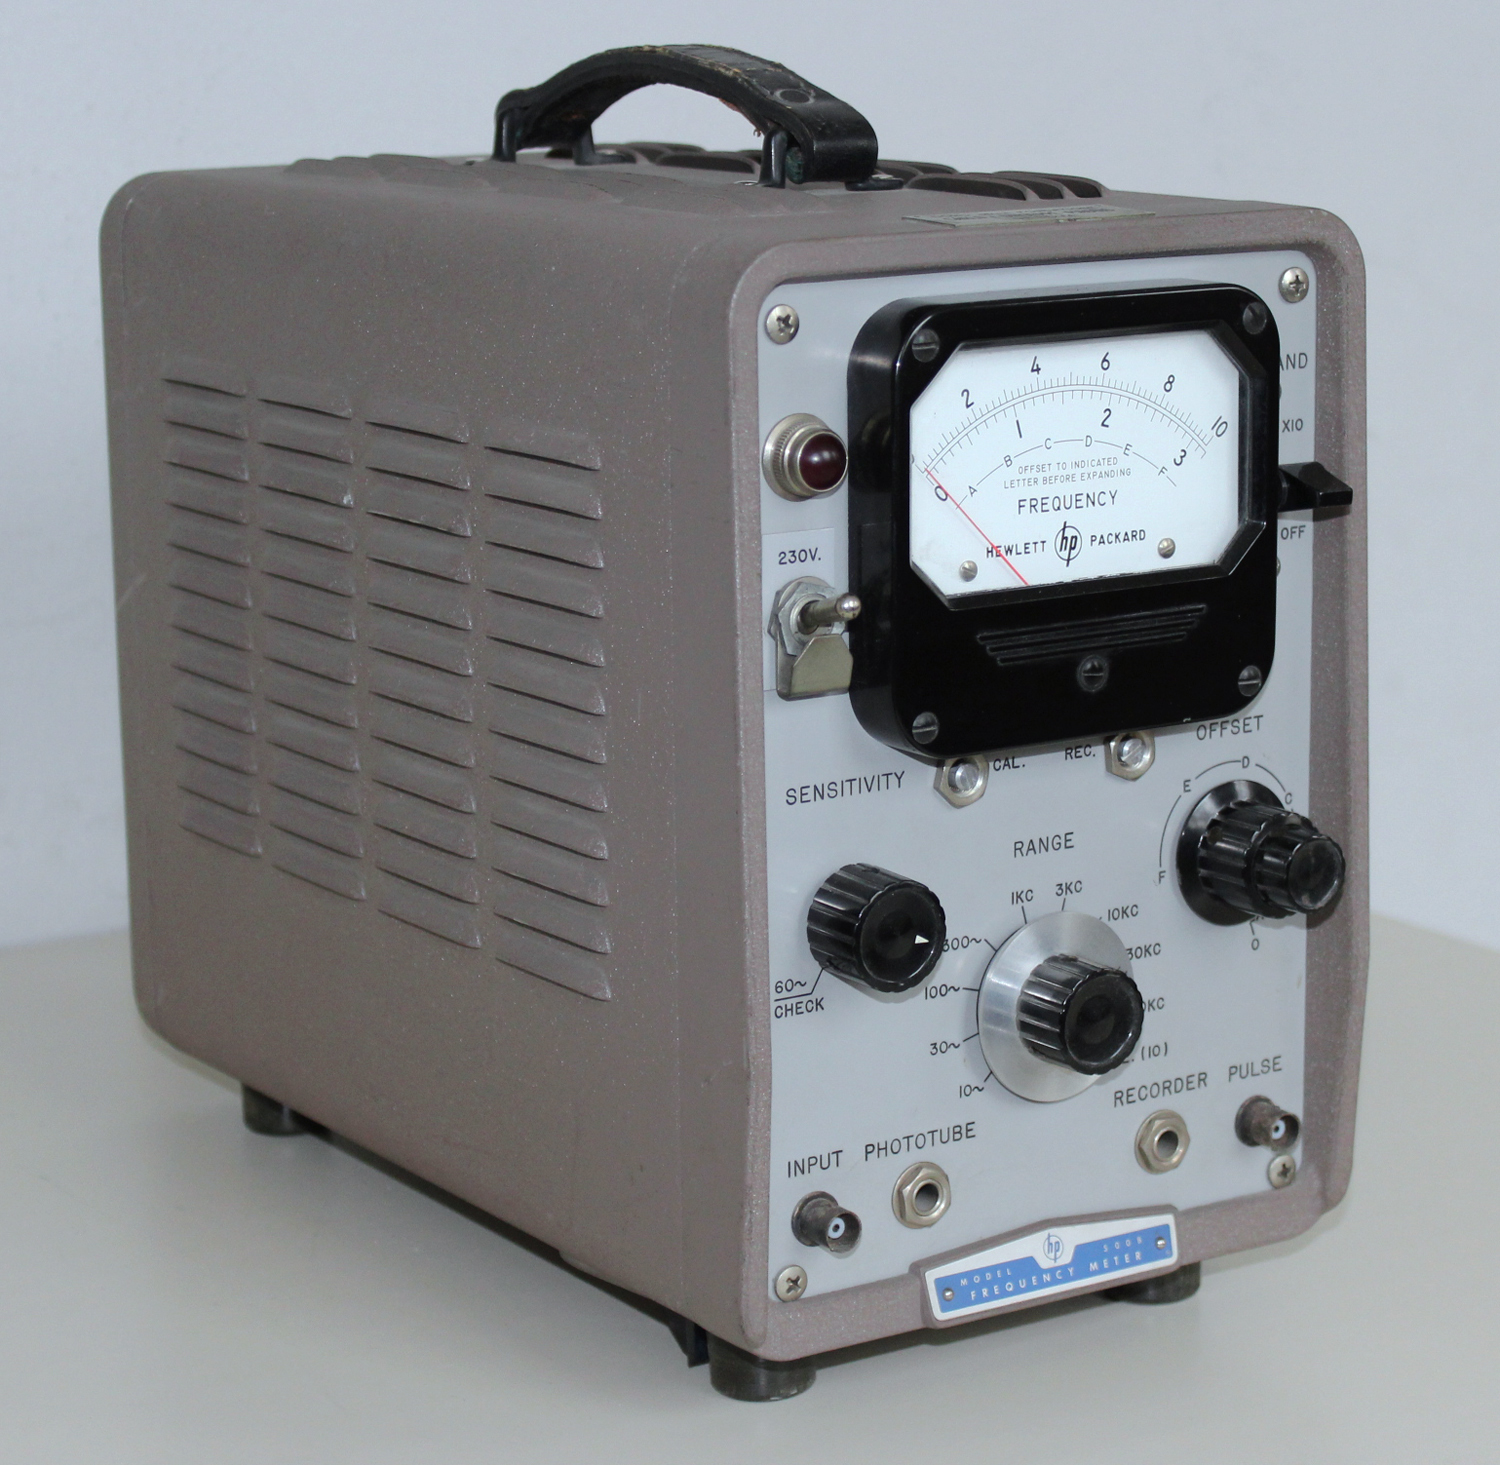
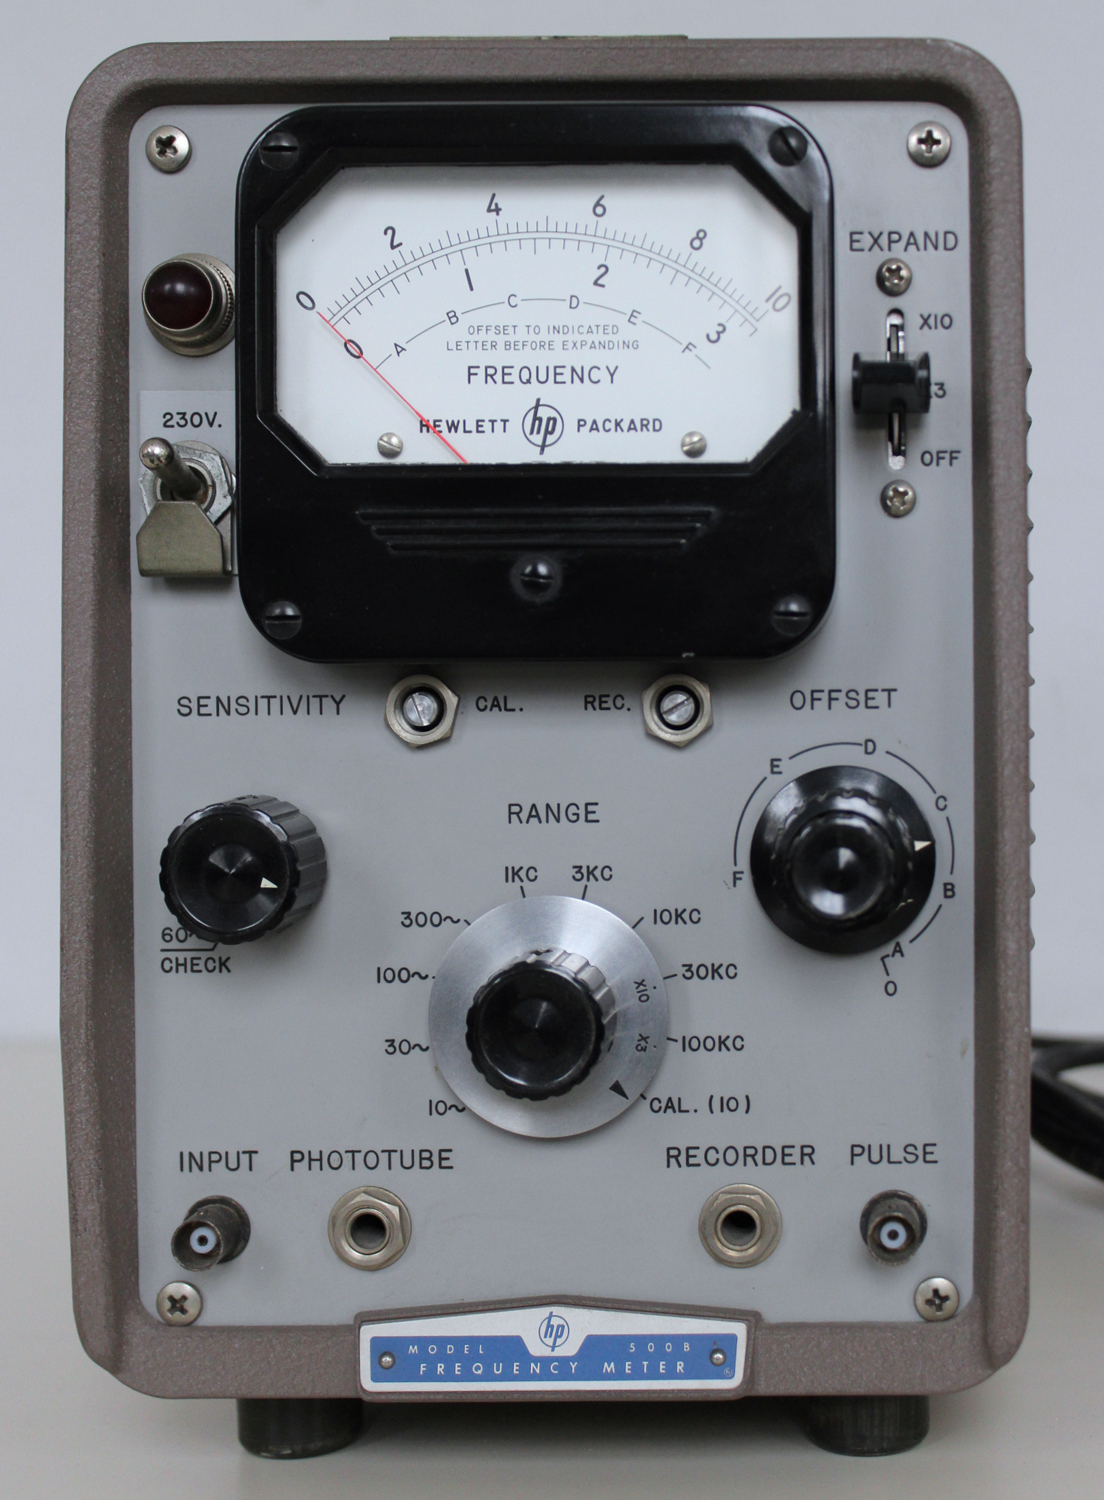
Nell’inventario D del 1956, in data 30 dicembre 1960, al n°  1858  si legge: “Piaggio- Genova.  Frequenzimetro -hp-, mod. 500B, destinazione Elettronica.”
Nell’Estratto dell’Inventario ad uso della Sezione Elettronica, al n° 1858, in data giugno 1961, si legge: “Frequenzimetro portatile mod. 500B 3 Hz 100 Hz. Destinazione Laboratorio”.
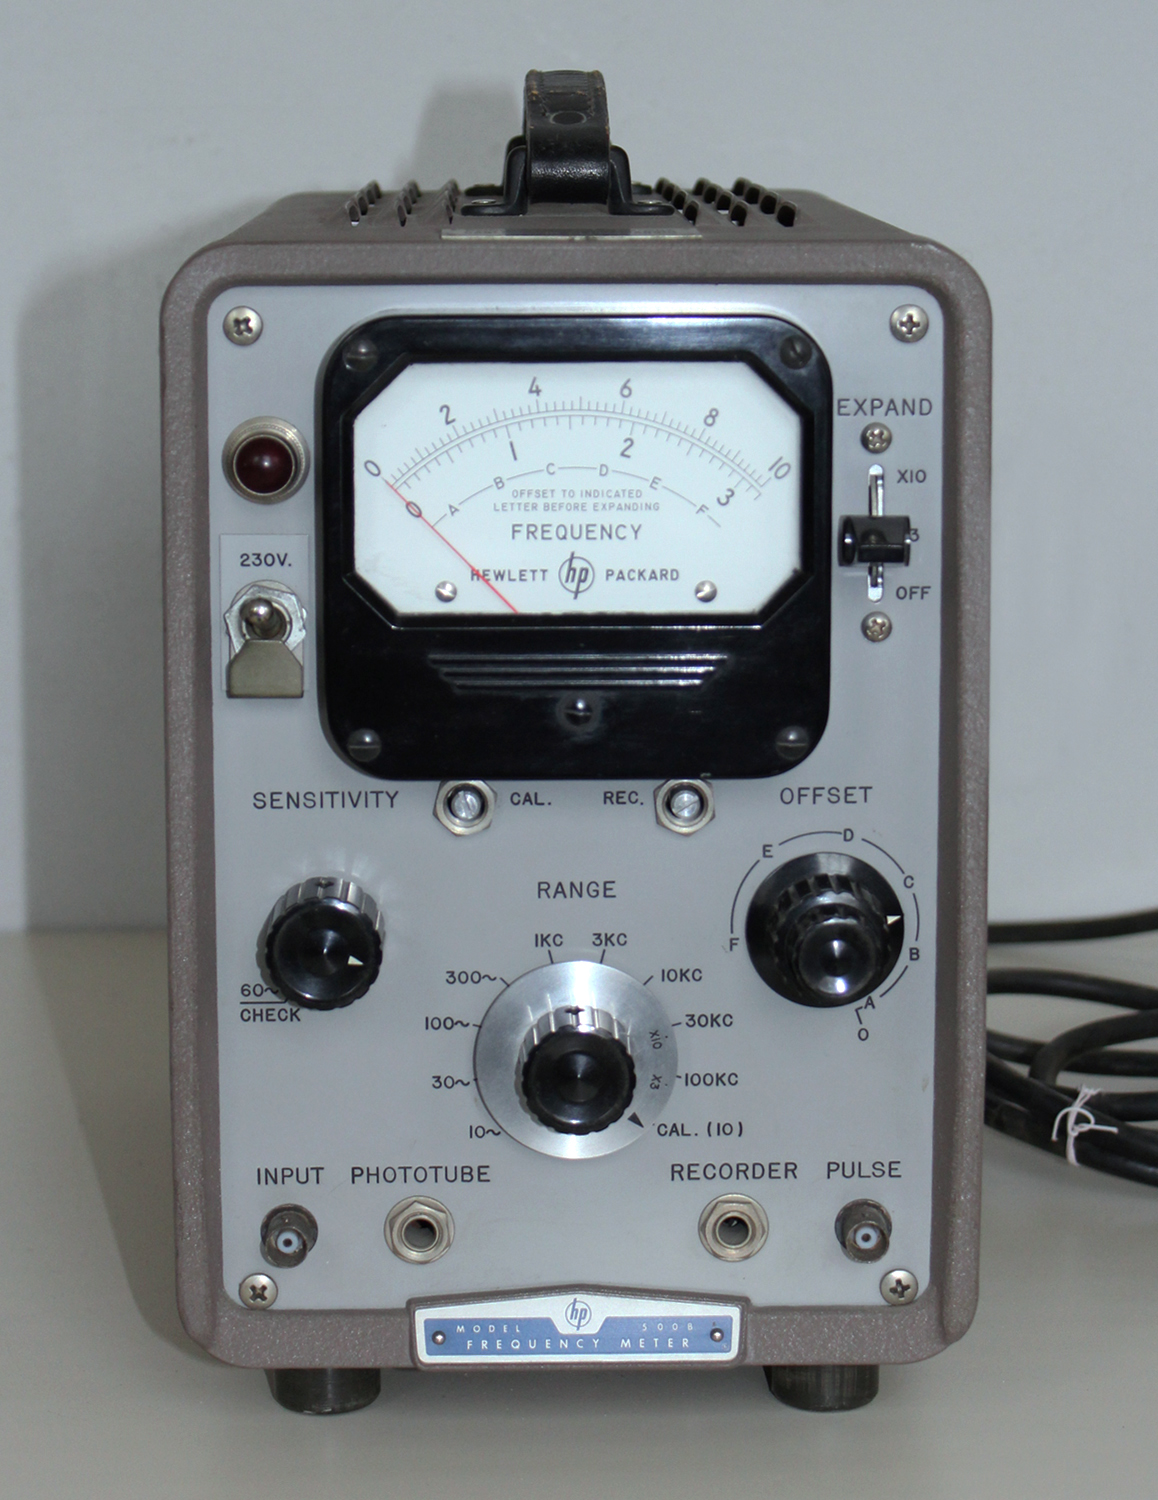
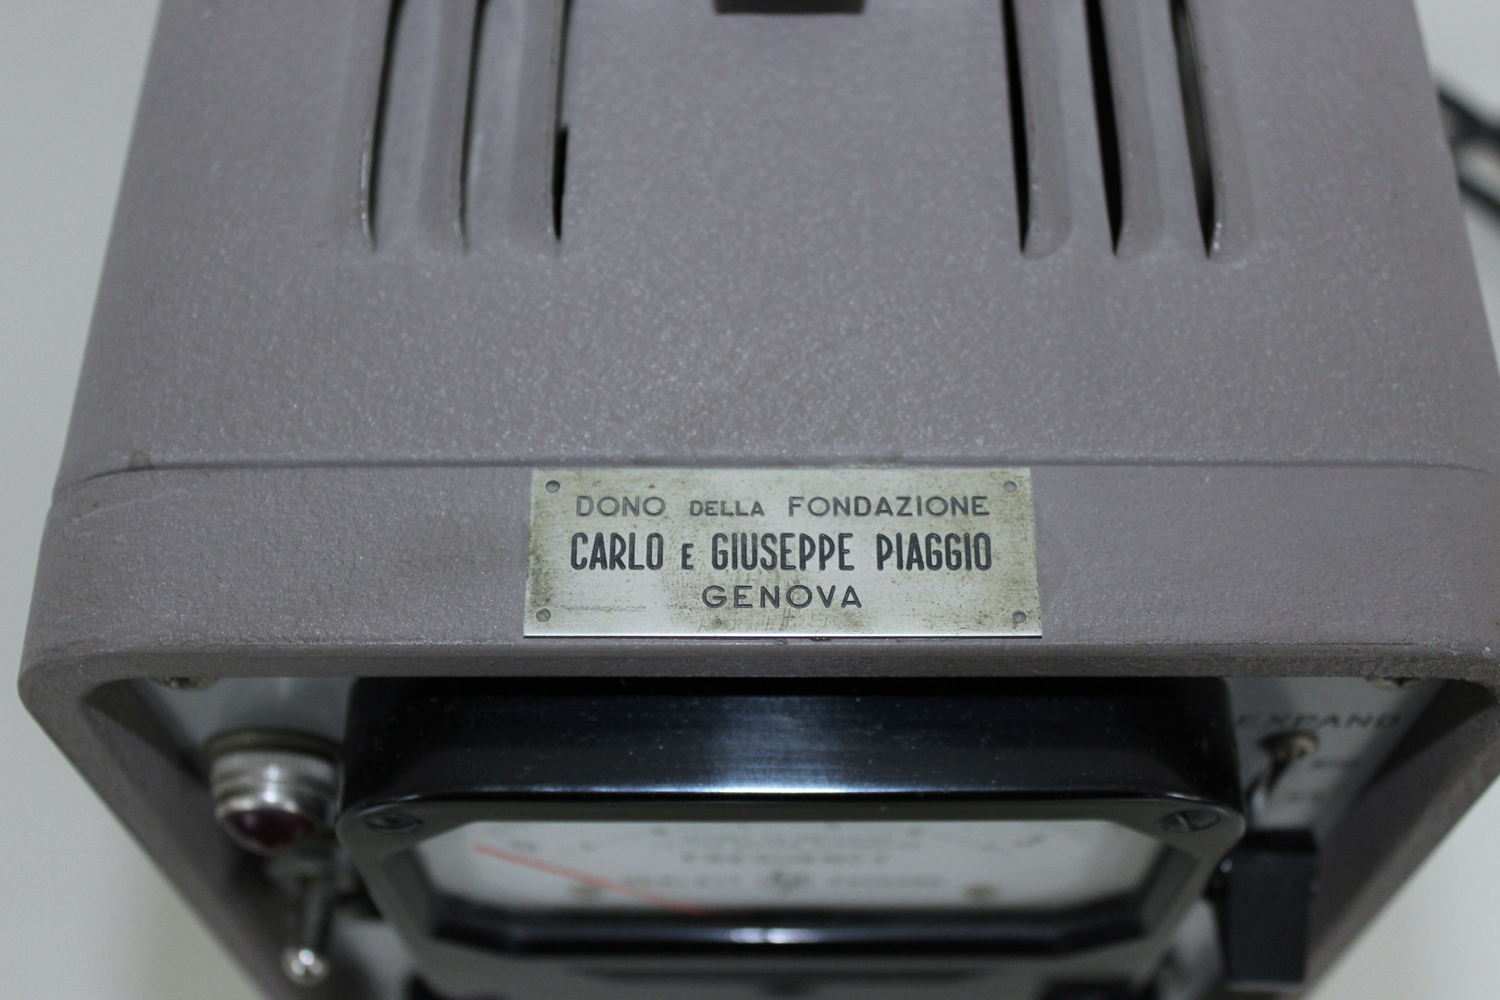
Dono della Fondazione Carlo e Giuseppe Piaggio di Genova, come si legge in una targhetta  qui visibile in una foto.
Un manuale di istruzioni si può trovare all’indirizzo:
http://hparchive.com/Manuals/HP-500B-C-Manual.pdf
Il testo prosegue dalla prima parte.
§§§
«2B-8 RANDOM COUNTING PROCEDURE
a.Place controls in the following positions:
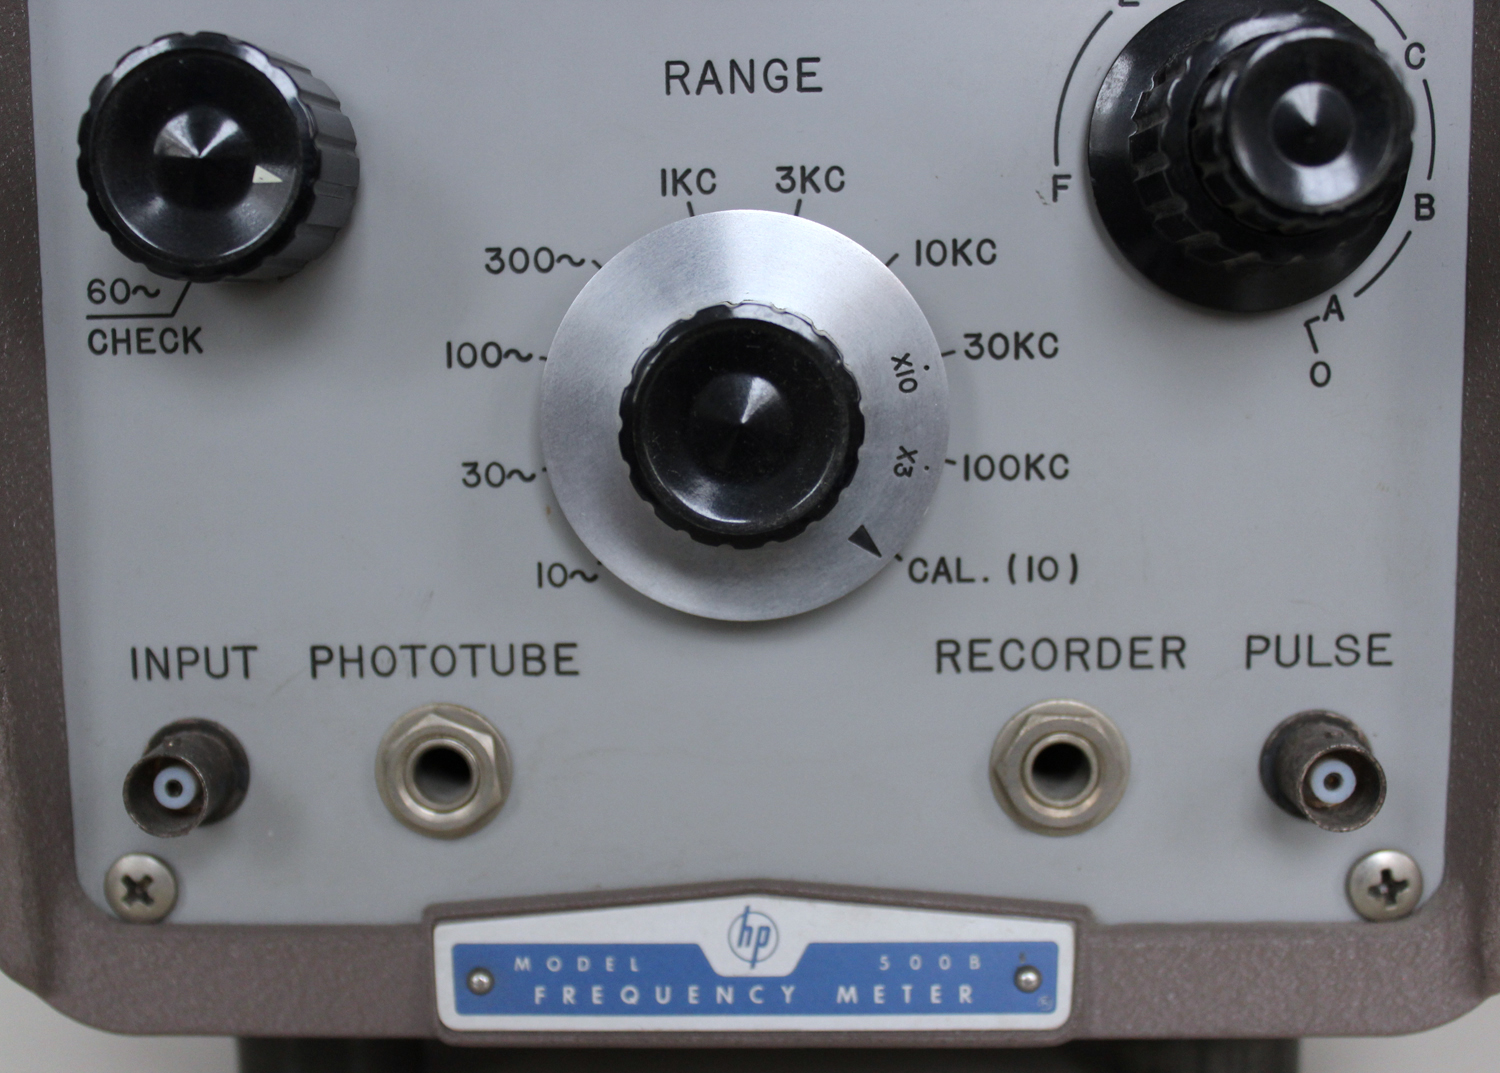
RANGE     – 100 KC
EXPAND    – X10
OFFSET    – both controls to zero, full clockwise.
Under these conditions the zero position of the OFFSET control calibrates zero on the meter (0-10 scale) so that an absolute reading may be obtained on the expanded scale from zero to 10 KC. The 10 KC range is not used because, as explained in paragraph 2B-7C, 60 percent of the period time of a basic range frequency is used to develop the current pulse and is not available for counting. Less time is used developing the shorter current pulses for the 100 KC range than is used for those developed on the 10 KC range. This means that by expanding you achieve a reading which is closer to the actual random count, since the probable counts missed during the development of the constant current pulses through the meter will be fewer. Thus the correction which is applied as the “predictable error” will be smaller in magnitude. However, unexpanded  ranges may be used. The disadvantage is that the readings will be further from the actual count, and the “predictable error” correction will be correspondingly larger.
b.Place the input signal across the INPUT terminals.
c.Note the reading on the meter and step down the RANGE switch as necessary to obtain a satisfactory meter reading. As the RANGE switch is stepped down, is in equations (1), (2), and (3) is reduced, and the “predictable error” correction increases. However, the basic meter accuracy -an  unpredictable quantity – improves because the meter pointer indicates further upscale as the RANGE switch is stepped down.
d.When the indicated reading has been obtained apply the applicable correction factor from equation (2) for X10 expansion, or equation (3) for X3 expansion.
                                ———EXAMPLE ———-
With the instrument set up as described in steps a. and b. above, a measurement is taken and the RANGE switch is stepped down to the 10 KC position.  This action places the X10 marking in the RANGE switch dial skirt at 1 KC. The meter reads 4.5. Therefore, it represents an uncorrected average count of 450 cps. Applying equation (2) for a random average count we have:
F = fi/[1 —.06fi/fs]
 = (450)/{[1-.06(450)]/1000}
 = 450/ .973
= 462 cps(±1 scale division)
                 ————————————–
2B-9 OPERATING CALIBRATION AND CHECK
Two performance checks are available for the operator in checking the accuracy of the instrument during operation. Perform CAL check first. If two checks cannot be made to agree, see paragraph 4- 10.
CALIBRATION (CAL)
This check permits amplitude of the pulse from the constant current source in the meter to be calibrated.  The procedure is as follows:
a.Turn on the instrument and permit it to reach a stable operating temperature.
b.Switch the RANGE control to CAL.
c.Adjust the CAL ADJ potentiometer with a screw-driver so that the meter indicates full scale (10) on the 0- 10 scale.
60 ∼  CHECK
This check places 6.3V at power line frequency across the input circuit of the meter.
To perform the check, switch the SENSITIVITY control to the 60 ∼ CHECK position and place the RANGE switch to a position which includes the known frequency of the power line. The line frequency  should be indicated on the meter.
2B-10 RECORDER OPERATION
The Model 500B will drive any 1 ma, 1400 ohm (±100 ohm) recorder. When a recorder is used with the instrument the REC ADJ compensating resistor in the instrument must be adjusted to match the resistance of the recorder to that of the meter circuit. The adjustment procedure is as follows:
a.Allow the 500B to reach a stable operating temperature, and place the SENSITIVITY control in the 60 ∼ CHECK position. Adjust the RANGE switch to
include the line frequency, and note reading on meter.
b.Plug recorder into the RECORDER jack and adjust the REC control on the front panel so that the meter indication on the Model 500B is identical to the reading obtained in step a., above.
c.Use mechanical adjustment on recorder to obtain reading, above, on recorder scale.
When the recorder is removed from the circuit the REC adjusting potentiometer is removed from the meter circuit so that the accuracy of the 500B is unimpaired. The external recorder is placed in series with the meter in the 500B, and it tracks with the meter in the 500B. Thus, expanding a scale on the 500B simultaneously expands the recorder scale.
2B-11 RECORDER JACK RESPONSE
The current at the 500B recorder jack is proportional to the frequency of the input signal. This current is derived from a succession of pulses
and is averaged by means of a simple R-C integrating circuit. On low frequency ranges, it is necessary that the integrating time constant be long enough to prevent excessive flutter of the meter or recorder. This integrating also slows down the response of the meter and recorder current to sudden changes in frequency on the low ranges.
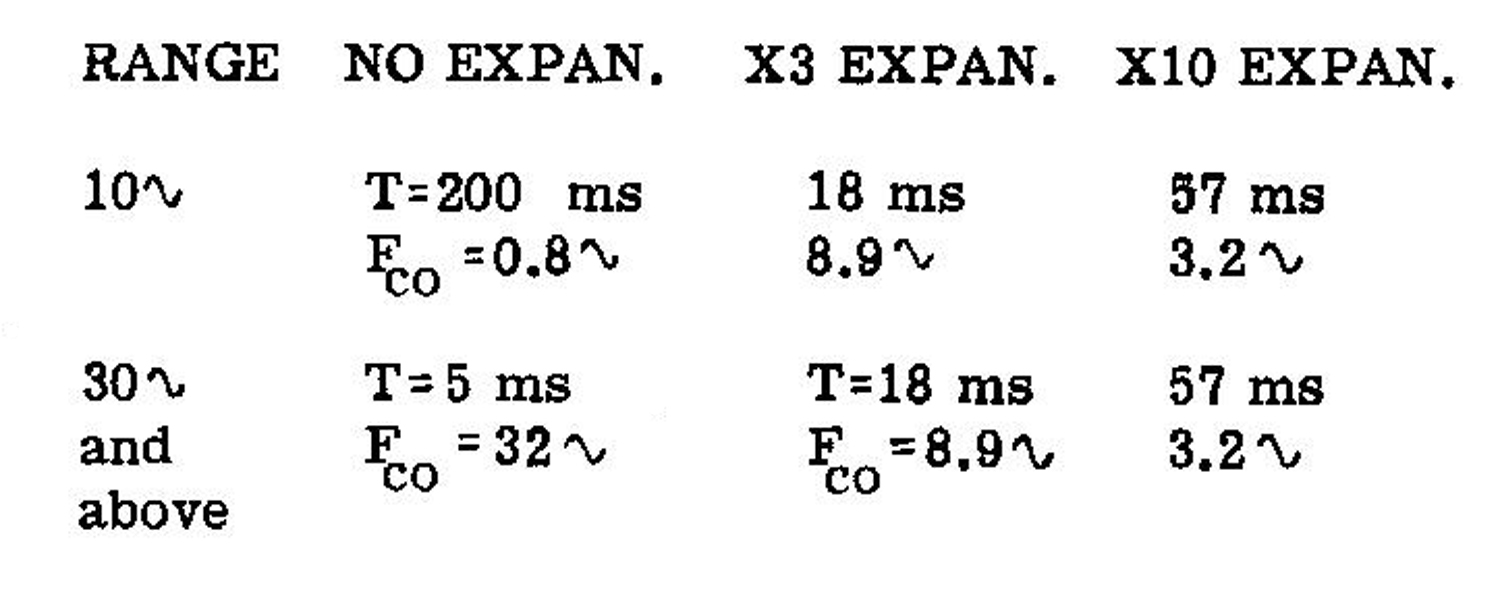
For example, on the 10 cps range, the integrating time constant is 200 milliseconds. Thus, when the frequency of the input signal changes suddenly, there will be an observable lag in the response of the meter or recorder. In fact, after 200 milliseconds, the meter needle will have moved only 63 percent of the distance between the old and new readings. It will move 90 percent of the distance in about one and a quarter seconds. If the input frequency varies about its average value in a sinusoidal manner, the output current will also vary sinusoidally about its average value. The amplitude of this current variation will also be reduced by the integrating circuit. An integrating time constant of 200 milliseconds corresponds to a high frequency cut-off of 0.8 cycles-per-second. Thus if the input frequency is varying at a 0.8 cps rate, the resulting current variation will be attenuated by 3 db, and its phase will lag that of the frequency variation by 45°.
The table below shows the integrating time constants  (T) and cutoff frequency (Fco) for various range settings and expansion conditions on the 500B. The effective rise time (0-90%) of the out-put  current is equal to 2.3T.2B-12 PULSE OUTPUT RESPONSE
The voltage from the PULSE output terminal can be used to drive a recorder at higher speeds than are obtainable using the meter current from the recorder jack. It can be used to drive a stroboscope  or sync an oscilloscope. The PULSE terminal  produces voltage pulses which are identical in shape to the current pulses used in the meter circuit. Since this output signal is direct coupled, it contains a dc component which is proportional to frequency. However, the fact that it consists of unfiltered pulses allows the user to filter the response as desired.
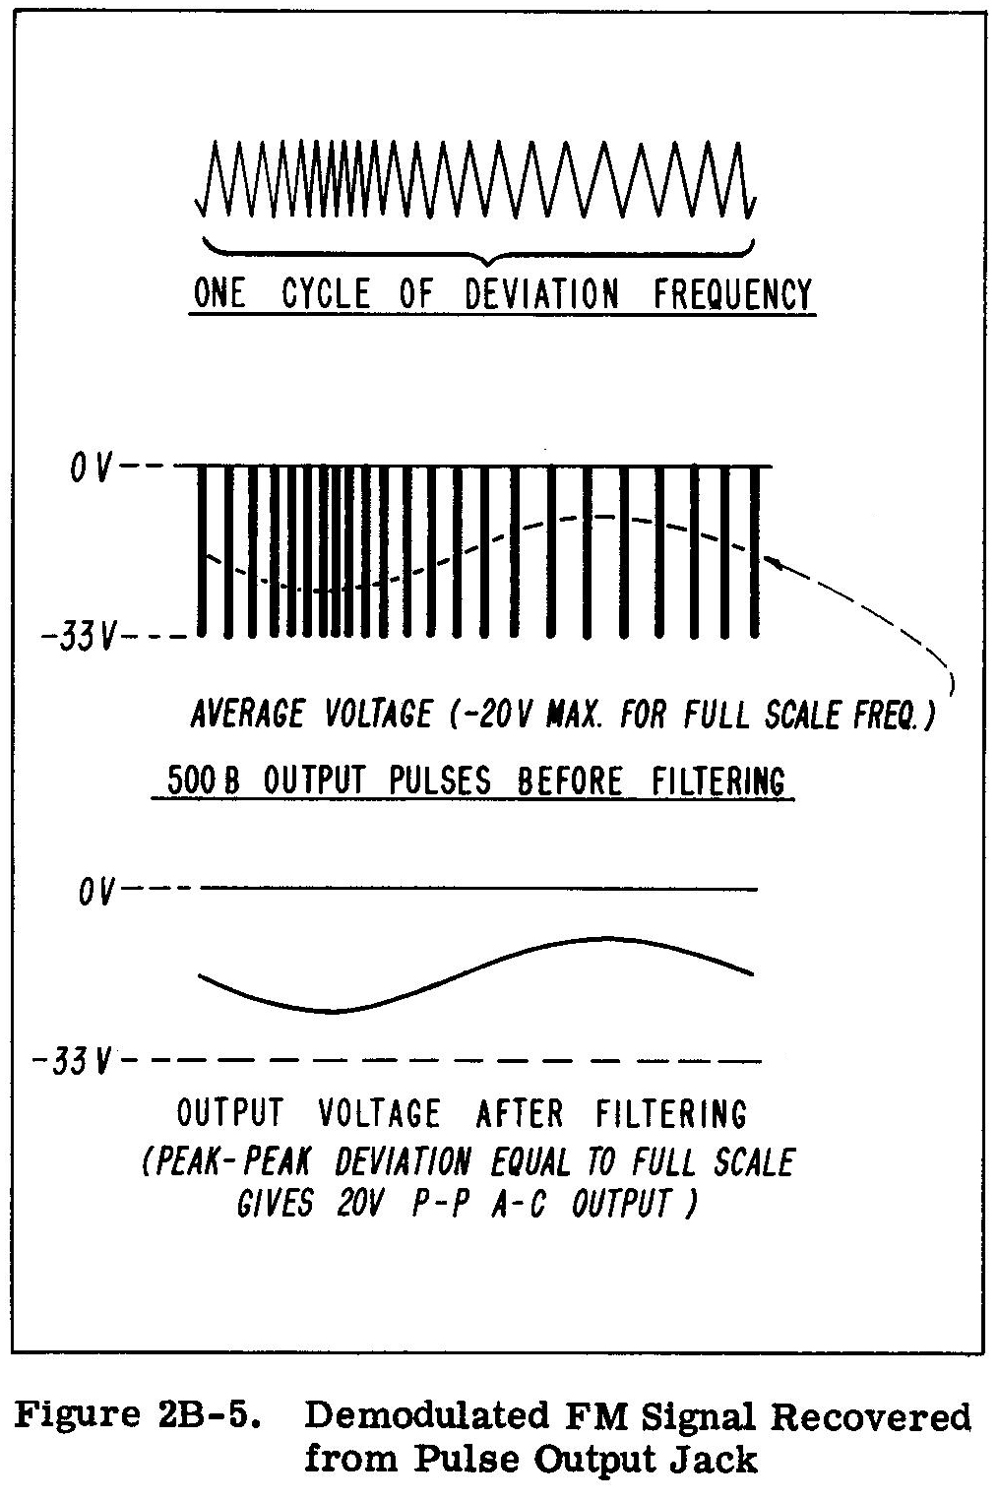
The PULSE output consists of one negative voltage  pulse for every cycle of the input signal. These pulses have an amplitude of -35 volts peak and a constant width such that a full scale meter reading (unexpanded) produces an average voltage of -20 volts. The pulse width is about 6/10 of the period corresponding to a full scale frequency.
For example, on the 100 KC range every input cycle produces an output pulse about 6 microseconds  wide and -35 volts high. This pulse is presented at a resistive output impedance of about 23,000 Ω. If the terminal is shunted by a capacity of .01 microfarads, a filter time constant of RC = 200 microseconds will result. This will produce a maximum peak-to-peak ripple of (6/200) × 35 volts = 1.05 volts, which is 5.25 percent of full scale. This maximum ripple only occurs at  frequencies which correspond to readings at the very low end of the meter scale. The ripple will decrease  to about 4/10 of this maximum for full scale readings. Thus, at 100 KC the peak-to-peak ripple would be about 2 percent of full scale if a .01 mid shunt condenser was used to produce a filter time constant of 200 microseconds. This corresponds to a high frequency  cut-off of 1/2 RC = 800 cps.
This frequency limit can be extended by using a shorter time constant if more ripple can be tolerated.  Although the single shunt condenser is the simplest filter for this application, much better results can be obtained with a multi-section filter properly designed to reject signals at the input frequency and higher.
The particular filter to be used depends upon the application. For example, if it is desired to measure the deviation of a 60 KC signal which is being frequency modulated at 1000 cps, a 1000 cps bandpass filter can be used to select to 1000 cps component from the output terminal and present it to an ac voltmeter which can be accurately calibrated in deviation (20 volts = 100 KC on top range.)
2B-13 PULSE OUTPUT APPLICATIONS
How the PULSE output of the frequency meter proves valuable in measurements can be described by assuming that a frequency of 50 KC is to he measured. Assume further that this frequency contains  a ±5 KC frequency modulation swing at a 1 KC rate and that it is desired to investigate this f-m.
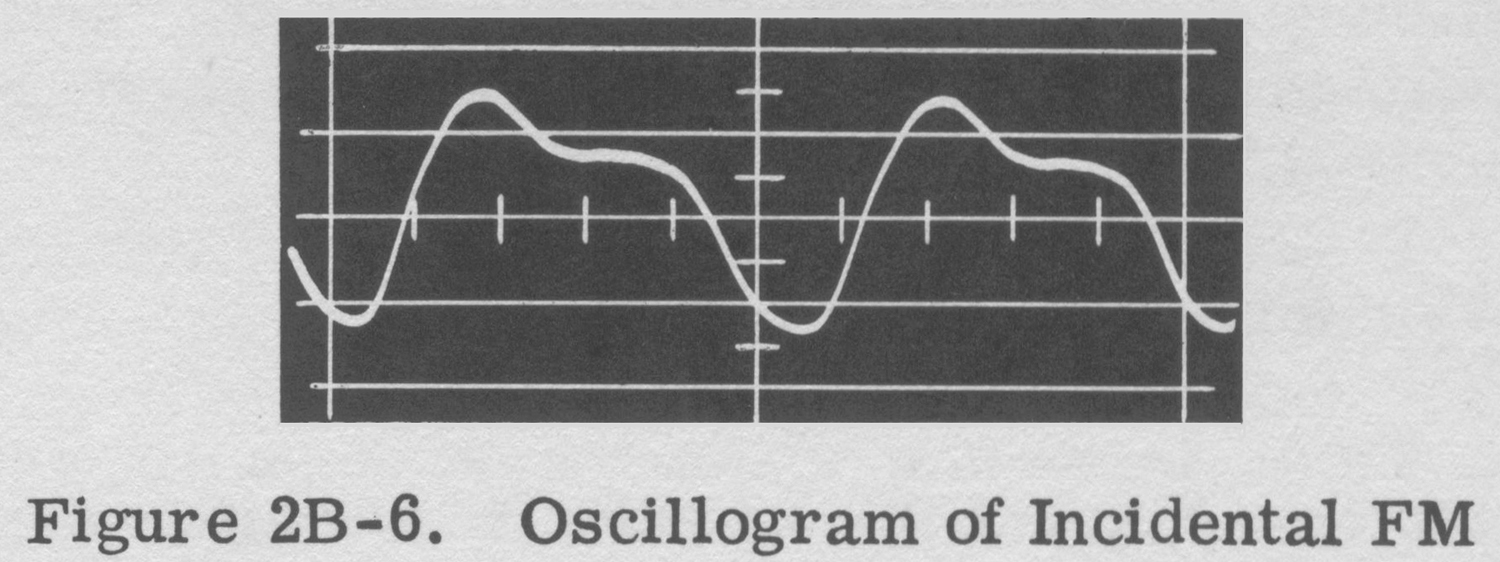
When the frequency-modulated waveform is applied to the frequency meter, the panel meter will indicate  the average frequency of 50 KC. For each cycle of the applied frequency, a voltage pulse will be available from the PULSE terminal, as shown in Figure 2B-5. Since the amplitude and width of these pulses are constant, and since the pulses are negative from ground, their short-time average value will vary in exact accordance with the frequency modulation they contain. The original modulating waveform can therefore be recovered if the pulses are averaged with a suitable low-pass filter. Not only can the waveform be recovered, but the amount of deviation in the signal can readily be measured, because the peak-to-peak amplitude of the variations in the short-time average level will be exactly proportional to the deviation. Since the amplitude and width of the output pulses is such as to give a d-c output level of -20 volts for a full-scale reading on the meter, the applied frequency of 50 KC in this example would cause a half-scale reading on the 100 KC range and therefore an average d-c output of -10 volts or -0.2 volt d-c/KC. By now measuring the peak-to-peak amplitude of the varying component of the d-c output with an oscilloscope or a-c voltmeter, the ± 5 KC deviation in the signal will be found to cause a measured value of 2 volts peak-to-peak.In practice, these voltages will all be affected by the impedance of the filter used. The voltage per cycle or per kilocycle out of the filter can easily be determined by dividing the measured d-c voltage out of the filter by the reading on the frequency meter. A filter suitable for the example above and most applications is shown in Figure 2B-5A. The output of this filter is down 3 db at 15 KC, 5 dB at 18 KC, 10 db at 20 KC, and more than 55 dB at 23 KC and above. The filter need not always be as elaborate as the one shown in Figure 2B-5A; in some cases a single shunting capacitor will do. The cut-off frequency of the filter may be adjusted to any frequency in the audio range, but it must be higher than the modulation frequency and lower than the lowest frequency of the modulated signal. In order to obtain a fair approximation of the modulation signal from the output of the filter, there should be at least ten pulses into the filter for each cycle of the modulation frequency out of the filter. Thus, the average frequency of the modulated signal applied to the 500B should be at least ten times the modulation frequency. For example, if modulation components up to 5 KC are to be  measured, the average frequency supplied to the input of the 500B should be not less than 50 KC. Figure 2B-6 is an oscillogram of a demodulated f-m signal recovered by using the PULSE output of the frequency meter in the method described in paragraph 2B-13. The waveform itself is theincidental f-m modulated into a klystron oscillator from the heater circuit.


2B-14 MEASURING KLYSTRON INCIDENTAL FM
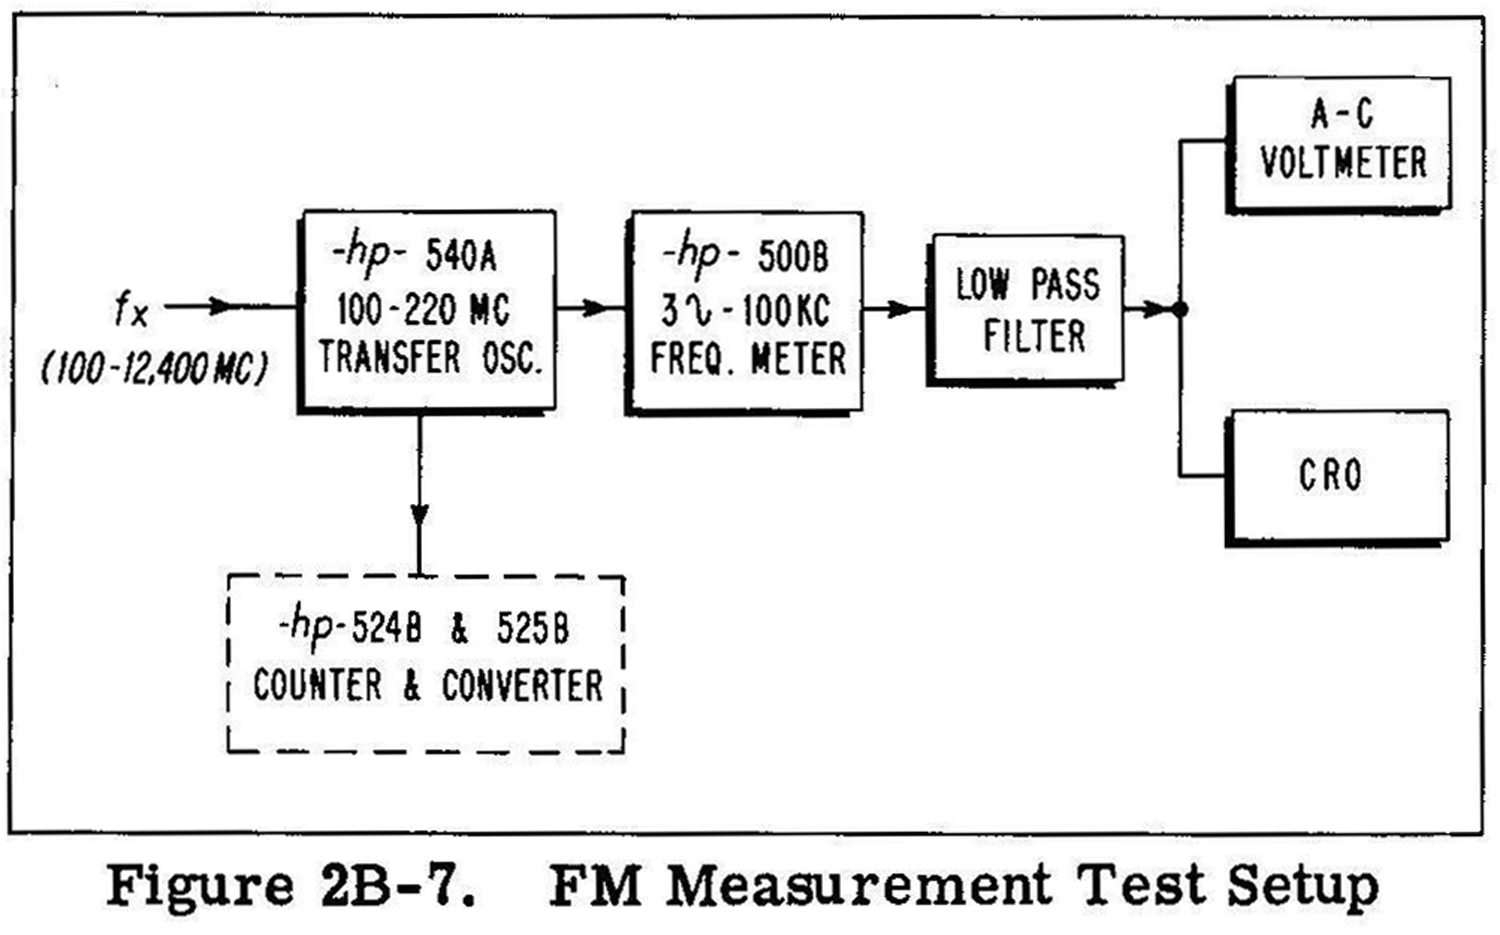
Incidental f-m in the klystron output is translated to the range of the frequency meter by applying the klystron output to an -hp- 540A Transfer Oscillator.1 The Transfer Oscillator is tuned to produce a difference frequency of 70 KC which also contains the incidental f-m. Test arrangement shown in Figure 2B-7.The amplitude of the deviation is measured by adjusting the oscilloscope gain to calibrate the scope graticule. In Figure 2B-6 each major  division on the graticule is equal to 5 KC of deviation. Total deviation represented by the waveform can thus be seen to be 15 KC peak-to-peak.
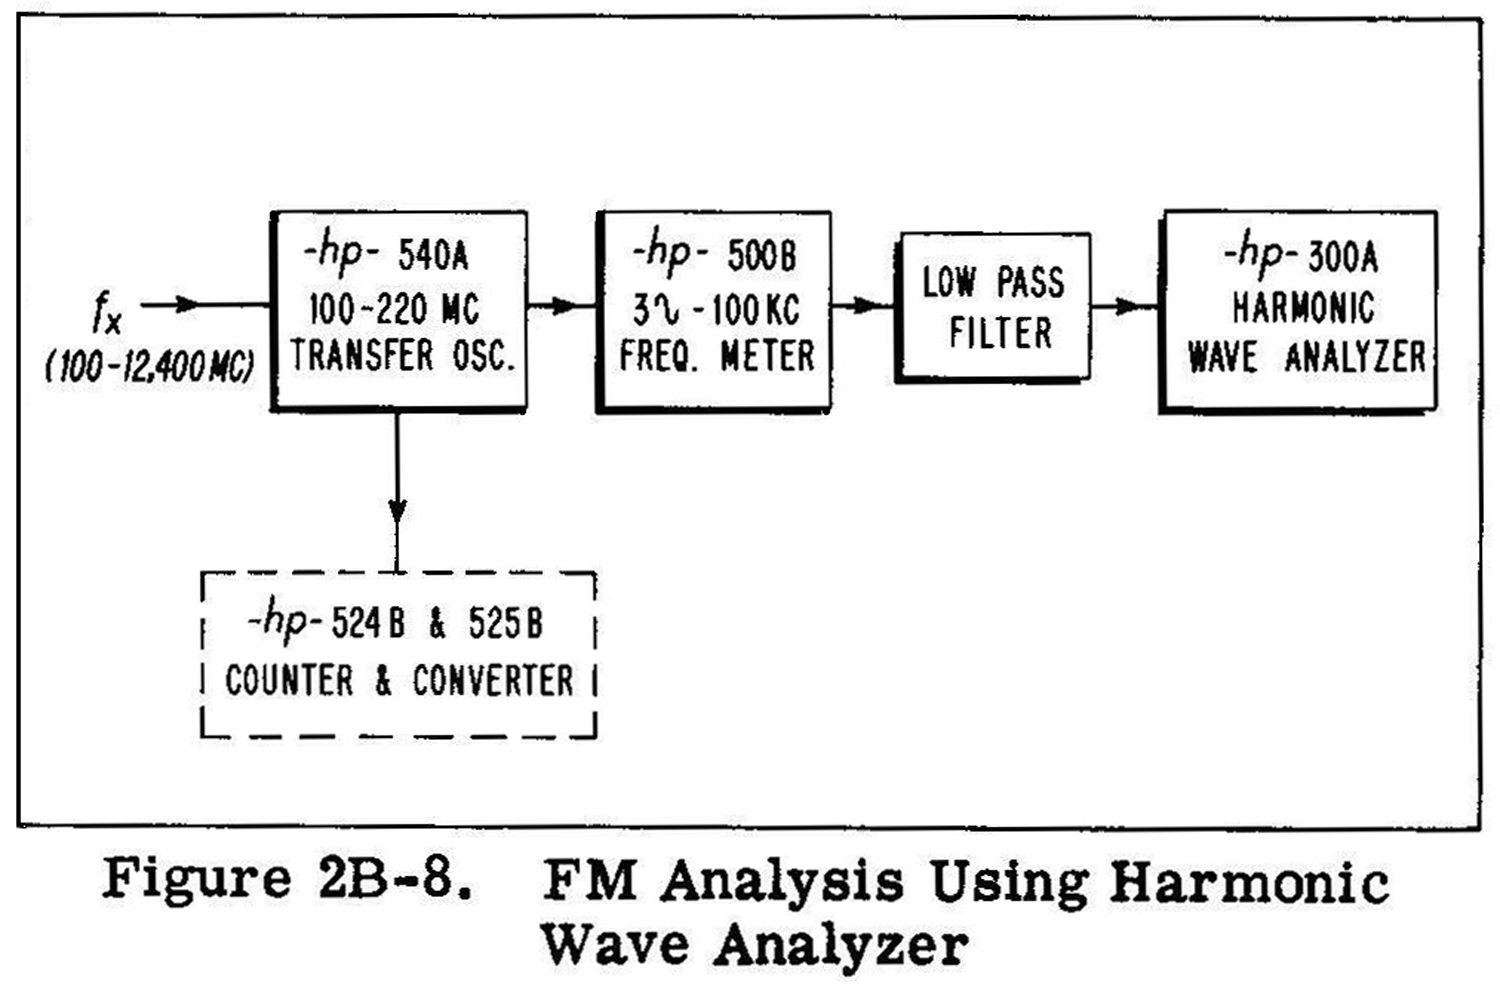
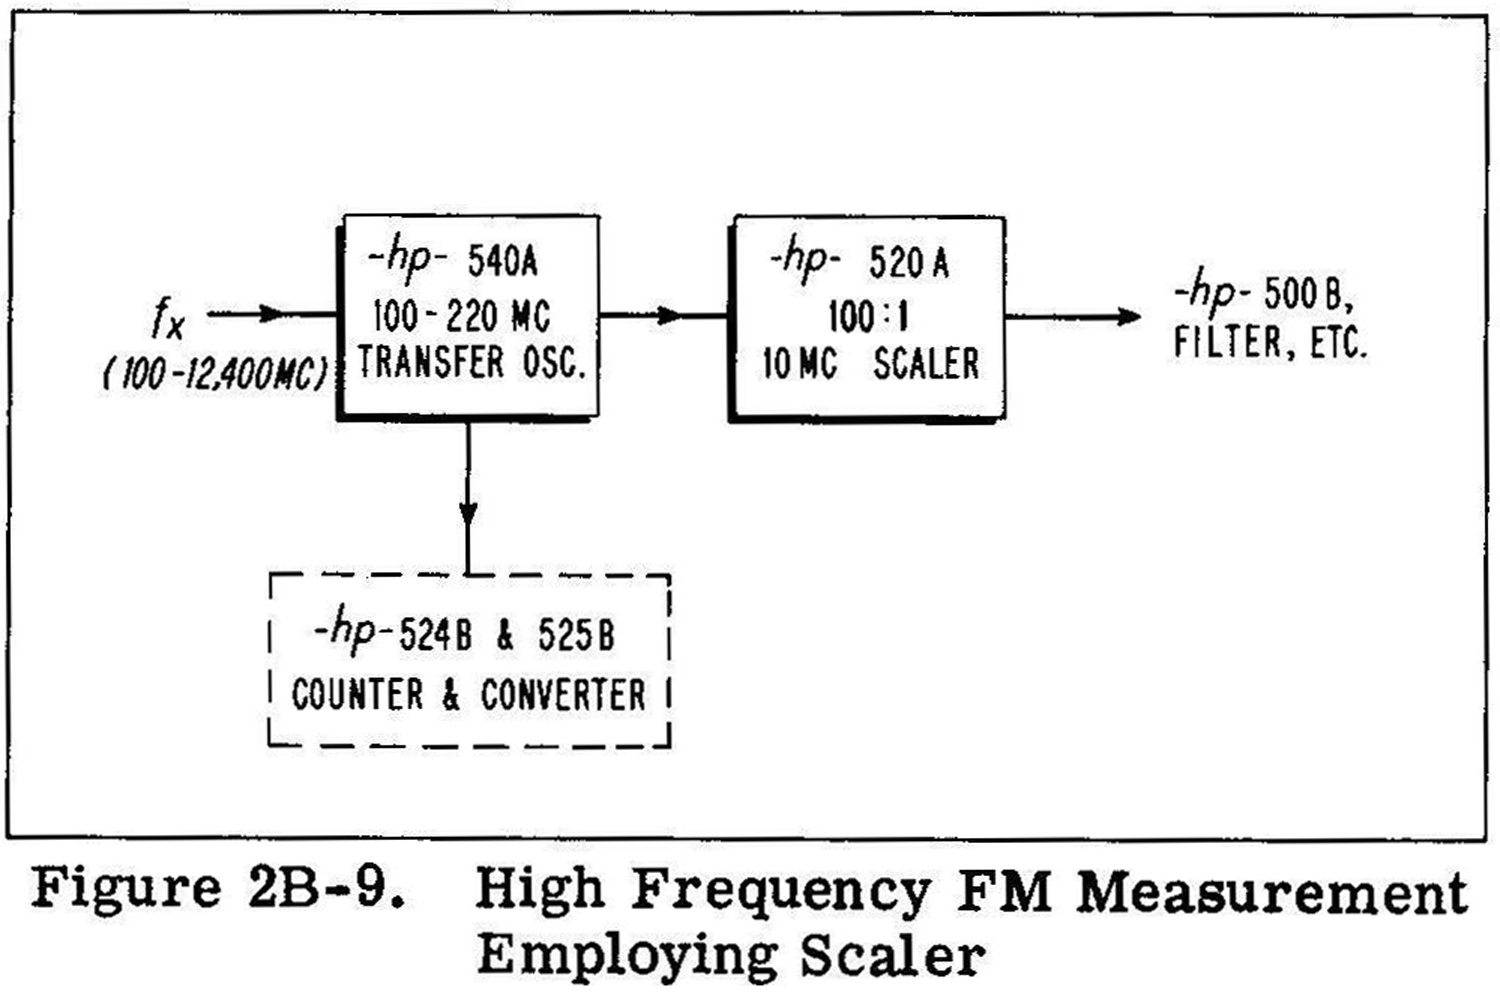
The fundamental component of the modulation is 60 cps which is combined with a large amount of second harmonic. If desired, an accurate measurement of each of the components could be made by applying the waveform to an harmonic wave analyzer (Figure 2B-8). If deviation larger than 100 KC peak-to-peak are encountered, the -hp- 520A 100:1 sealer can be connected ahead of the
____________________
1.  Dexter Hartke, “A Simple Precision System for Measuring CW and Pulsed Frequencies Up to 12,400 MC”, Hewlett—Packard Journal, Vol. 6, N0. 12, August, 1955.

frequency meter (Figure 2B-9). This will allow deviations of up to 10 MC peak-to-peak to be measured. 2B-15 MEASUREMENT SET-UPS
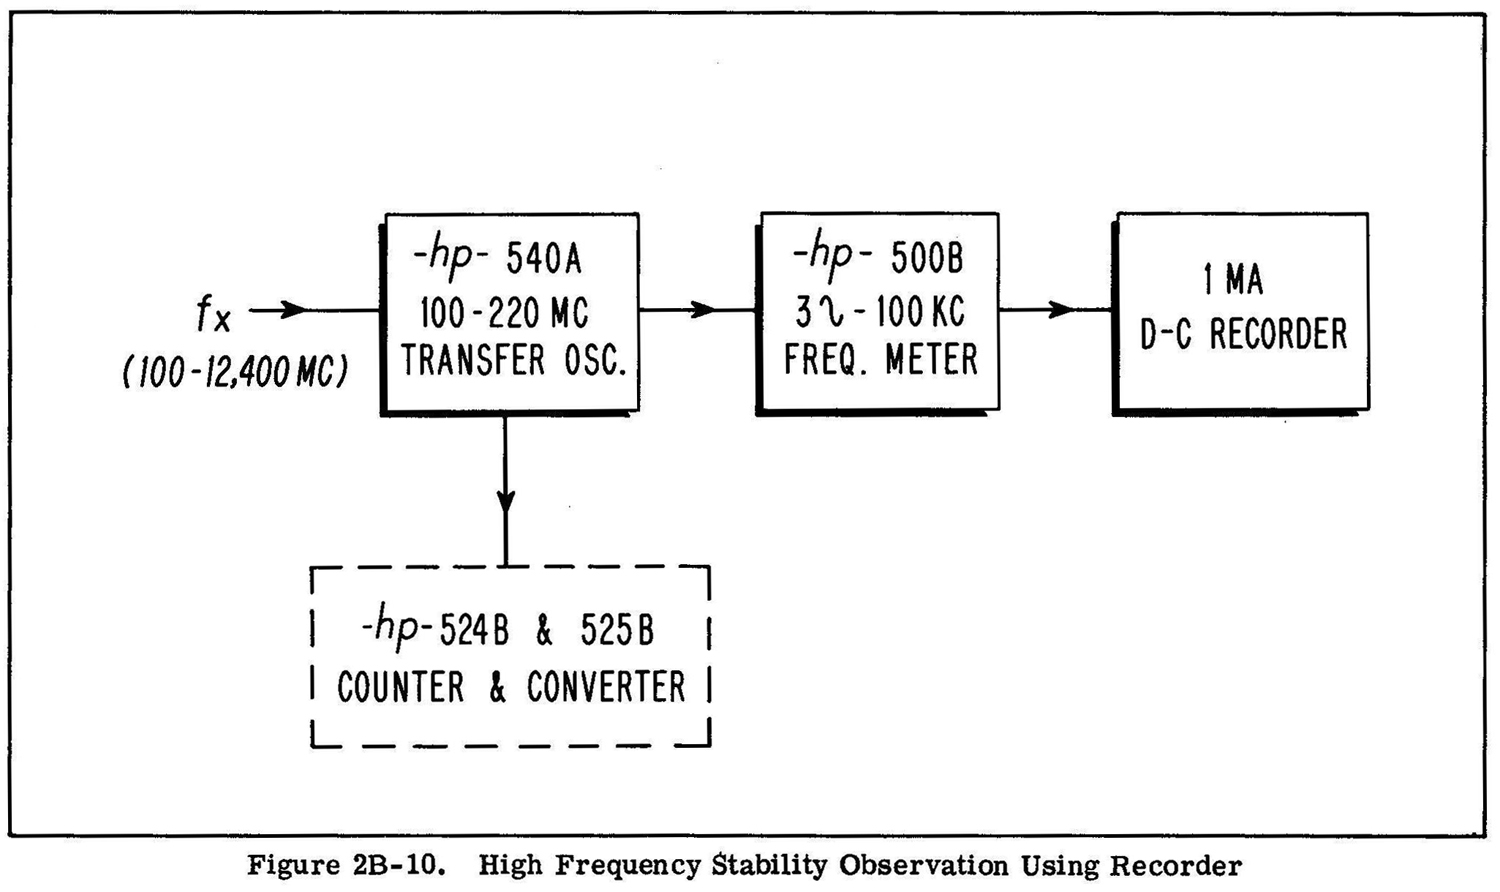
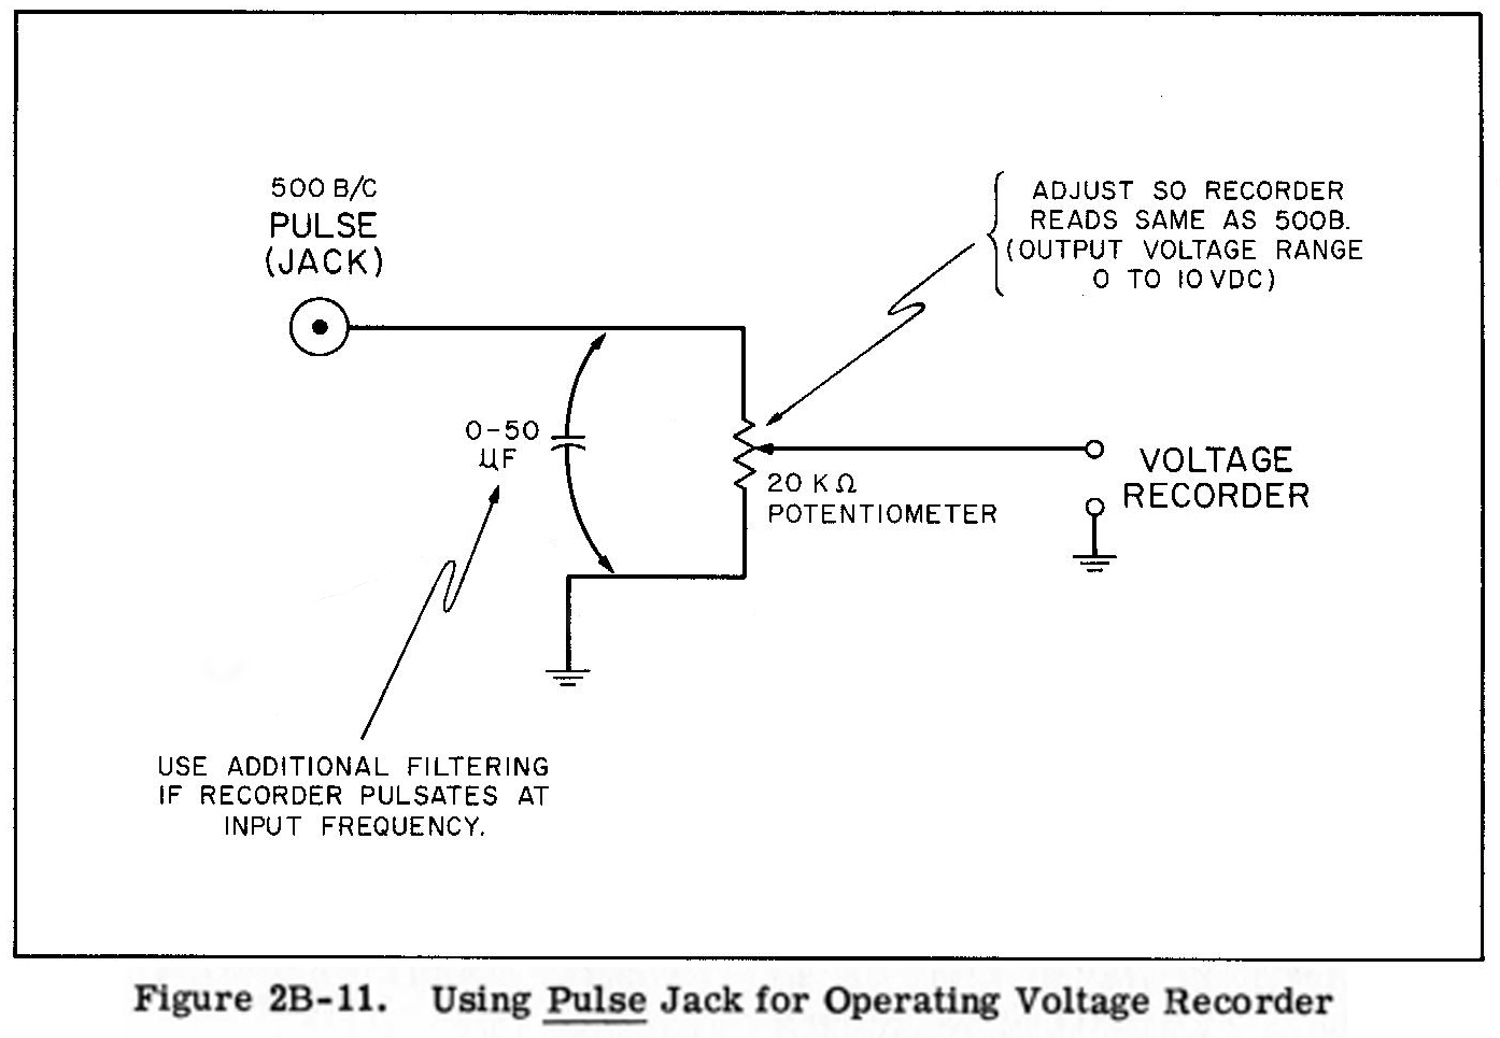
The 500B frequency meter is a versatile tool for investigating many frequency and stability phenomena. Figures 2B-7 to 2B-11 indicate how the instrument can be combined with other -hp- instruments to measure such quantities as peak-to-peak f-m deviation, components of f-m modulation, stability, and driving voltage recorders.SECTION IIC
500C OPERATING INSTRUCTIONS
2C-1 CONTROLS AND TERMINALS
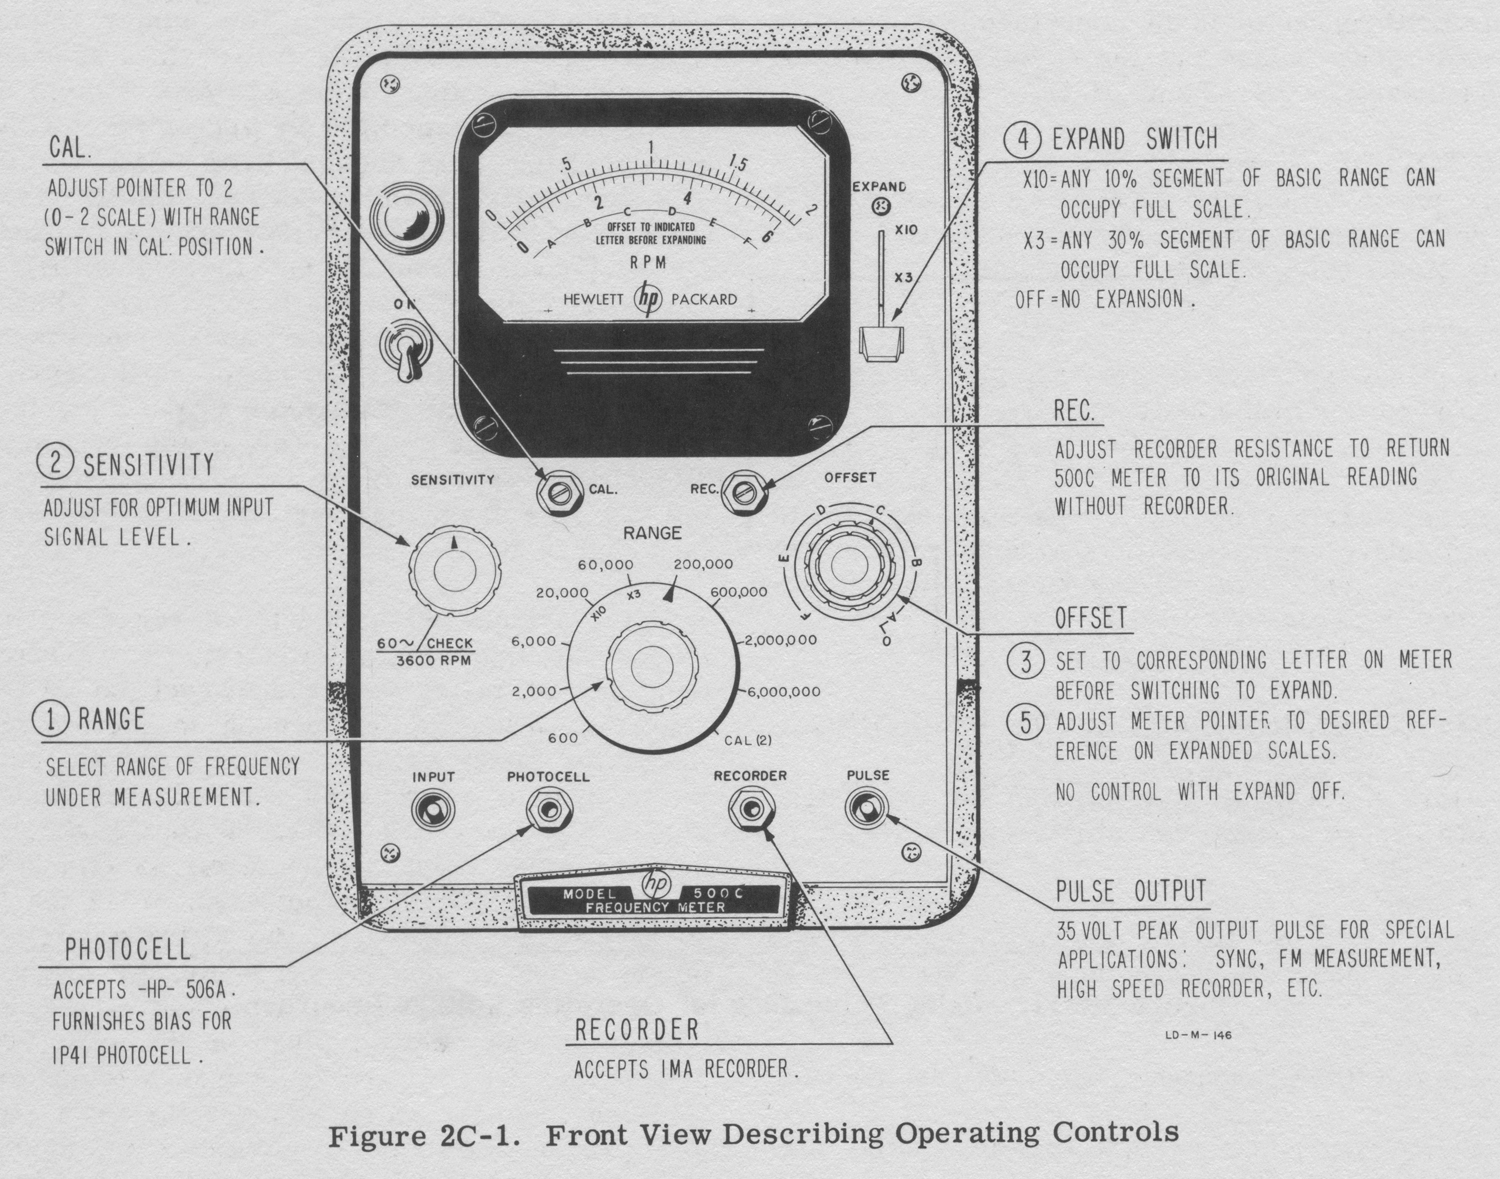
SENSITIVITY
This control, normally in the maximum position, is used to decrease the sensitivity of the input amplifier to eliminate errors resulting from spurious modulation of the desired signal.
3600 RPM CHECK
This witch position on the SENSITIVITY CONTROL places the line frequency into the input circuit. With the RANGE switch in the appropriate position (usually 6000) and the EXPAND switch OFF, the meter should indicate 3600 rpm.
RANGE
This rotary switch selects the desired range.
CAL
The CAL position of the RANGE switch checks satisfactory calibration of the constant current source in the circuit by indicating full scale on the 0-2 scale. In this position, input signals have no effect upon the meter.
CAL ADJUST
This screwdriver adjustment is used to calibrate the constant current source. See paragraph 2B-9.
EXPAND
This switch permits expansion to full scale any 10 percent (X10) or any 33 percent (X3) of the basic range in use. Use of the expanded scales is discussed in paragraph 2C-3.
INPUT
This BNC connector accepts any unknown signal from 0.2 to 150 volts rms.
PULSE
This BNC connector is an output terminal providing 35-volt peak pulses out for special applications. See paragraphs 2B-12 and 2B-13.
PHOTOTUBE
This phone-type jack furnishes bias for a 1P41 phototube permitting the direct connection of the -hp- Model 506A Optical Tachometer.
RECORDER
This phone-type jack is provided for connecting a 1 ma recorder to the instrument.
REC ADJ
This screwdriver-operated potentiometer adjusts the effective resistance of a recorder to match the instrument. The adjustment procedure is described in paragraph 2B-10.
2C-2 OPERATING PROCEDURE, COUNTING
a.Allow a period of five minutes for the instrument to reach a stable operating temperature after turning ON.
b.Turn the SENSITIVITY control to the maximum clockwise position. Place the EXPAND switch to OFF.
c.Set the RANGE switch to the 6,000,000 position.
d.Place signal under test across the INPUT connector.
e.Step the RANGE switch down from the 6,000,000 position as necessary until the meter pointer rests in the top 2/3 of the meter scale. Decrease the SENSITIVITY control and watch for a change in the reading. The reading should remain constant over a plateau of control to indicate that noise modulation is not being; measured as part of the signal under test.
It is necessary with unknown input signals to start the RANGE switch at 6,000,000 and step down, because inputs in excess of the value indicated on RANGE switch can overdrive the instrument causing erroneous readings; i.e.: 120,000 rpm will be erroneously displayed on the 60,000 range, but not on the 200,000 range and above.
2C-3 EXPANDED SCALE, GENERAL
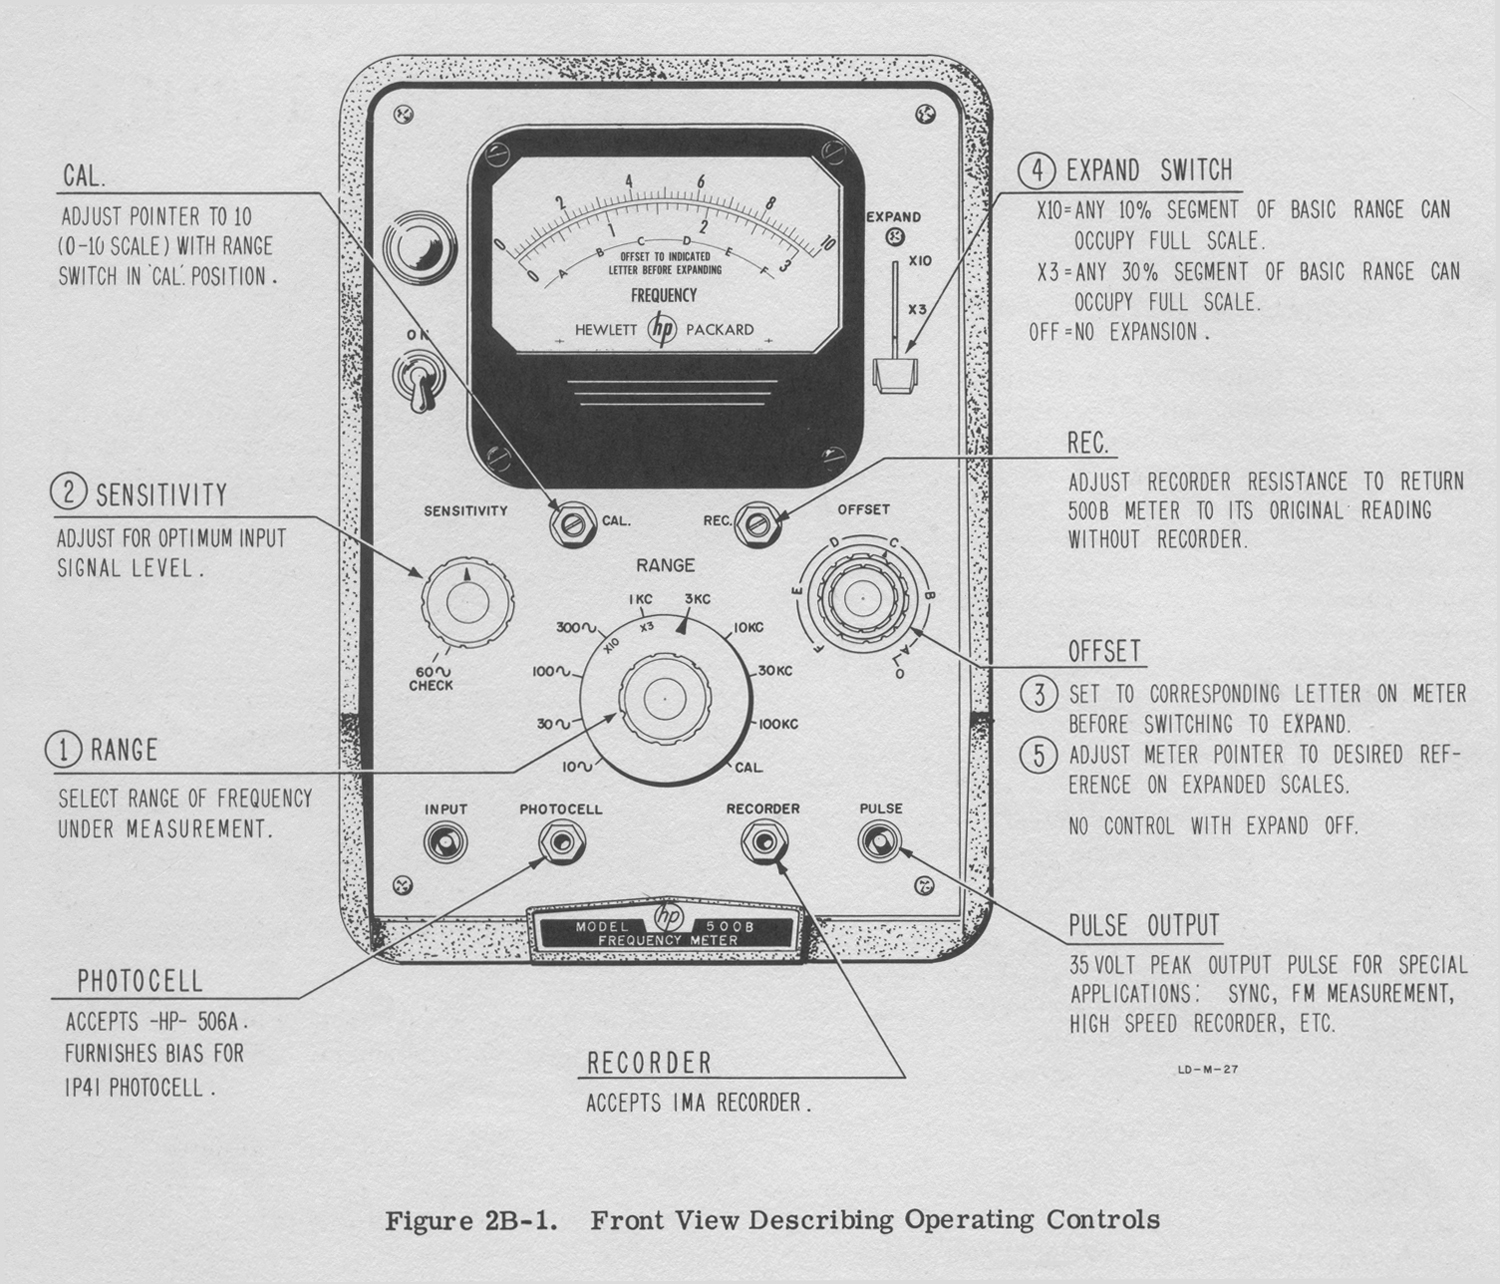
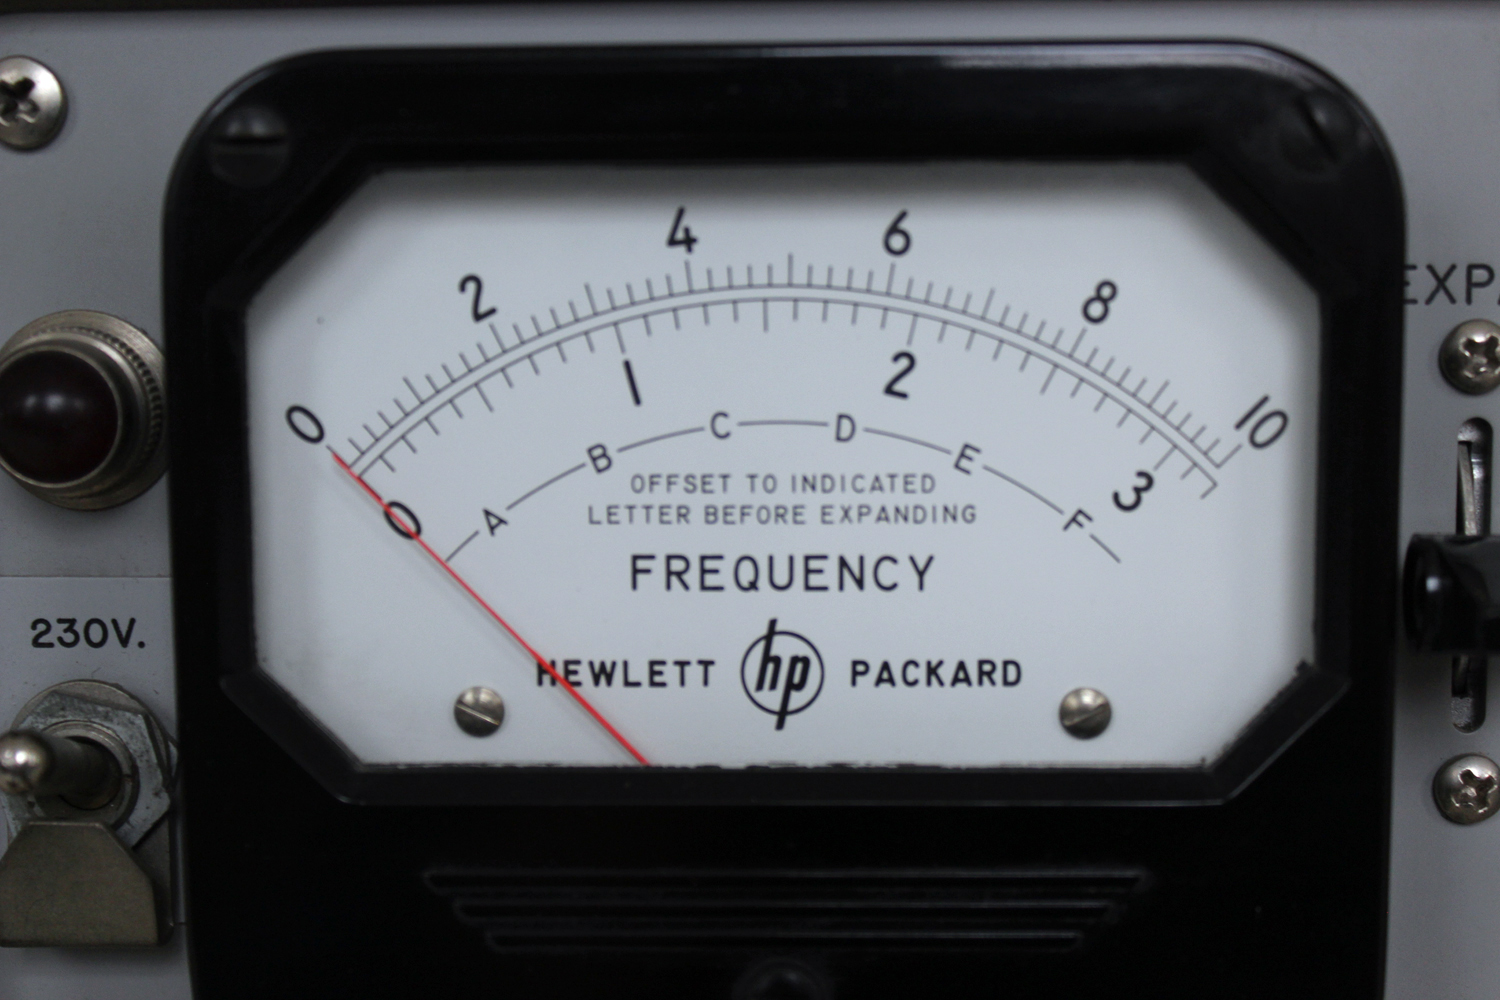
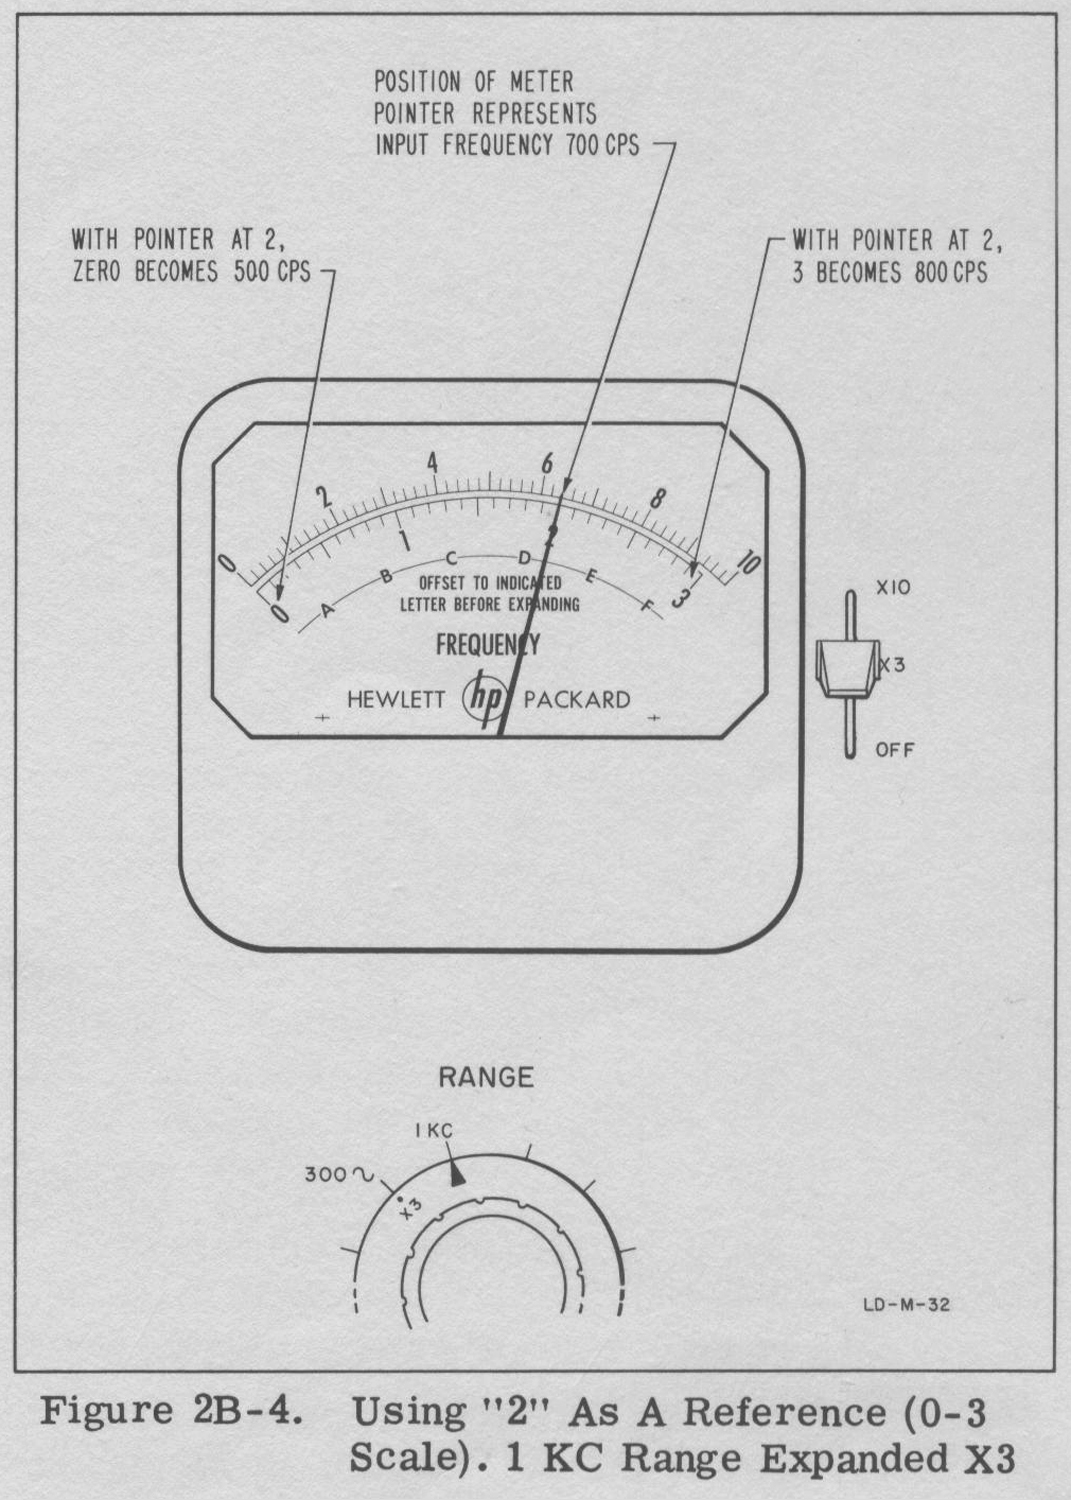
The expanded scale feature allows increased  accuracy in the measurement of changes in rpm by magnifying pointer action. The pointer action is magnified by expanding to full scale a 33 percent segment (X3 setting of the EXPAND switch) or a 10 percent segment (X10 setting of the EXPAND switch) of the range selected by the RANGE switch. The particular expanded segment represented by the meter scale is determined by the concentric OFFSET controls, which move the segment between zero and full scale of the basic range. Since the segment selection is arbitrary and the meter pointer always indicates the value of the input signal, the meter pointer will be on scale only if the selected segment includes the frequency of the input signal.
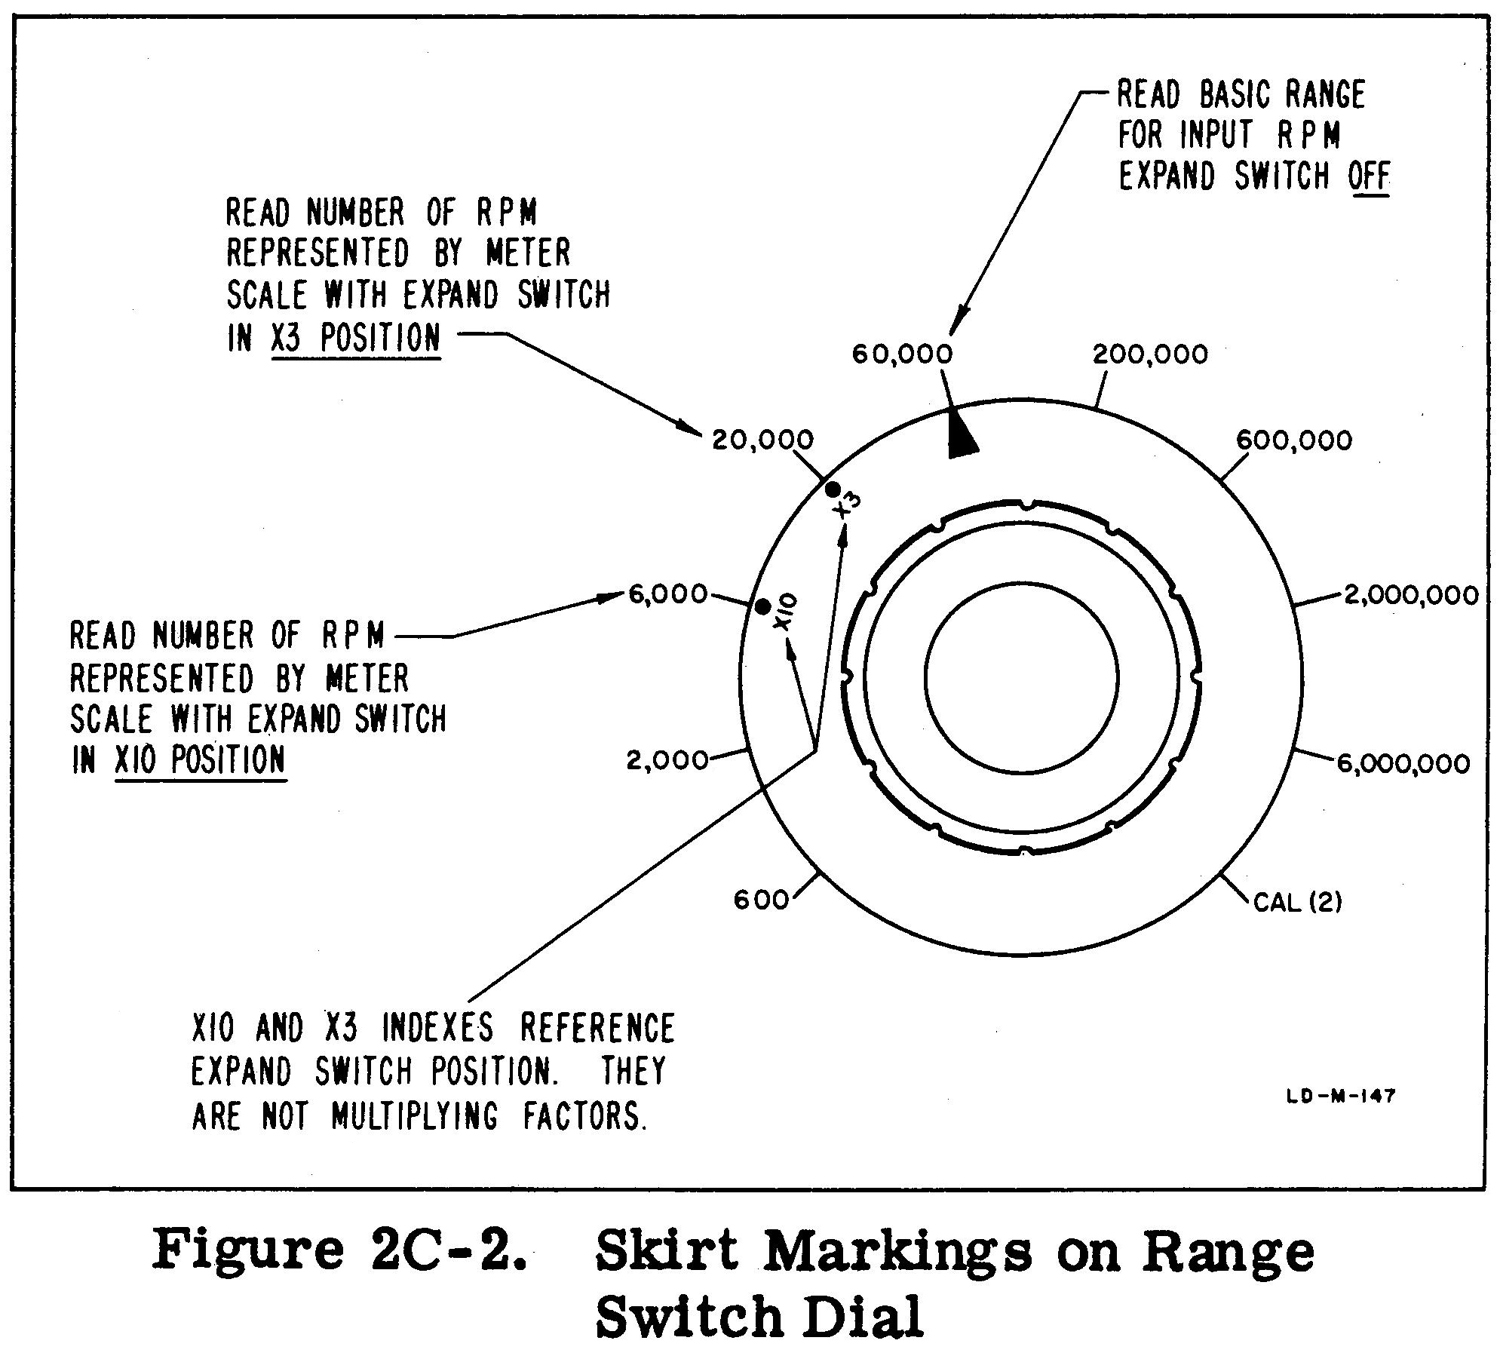
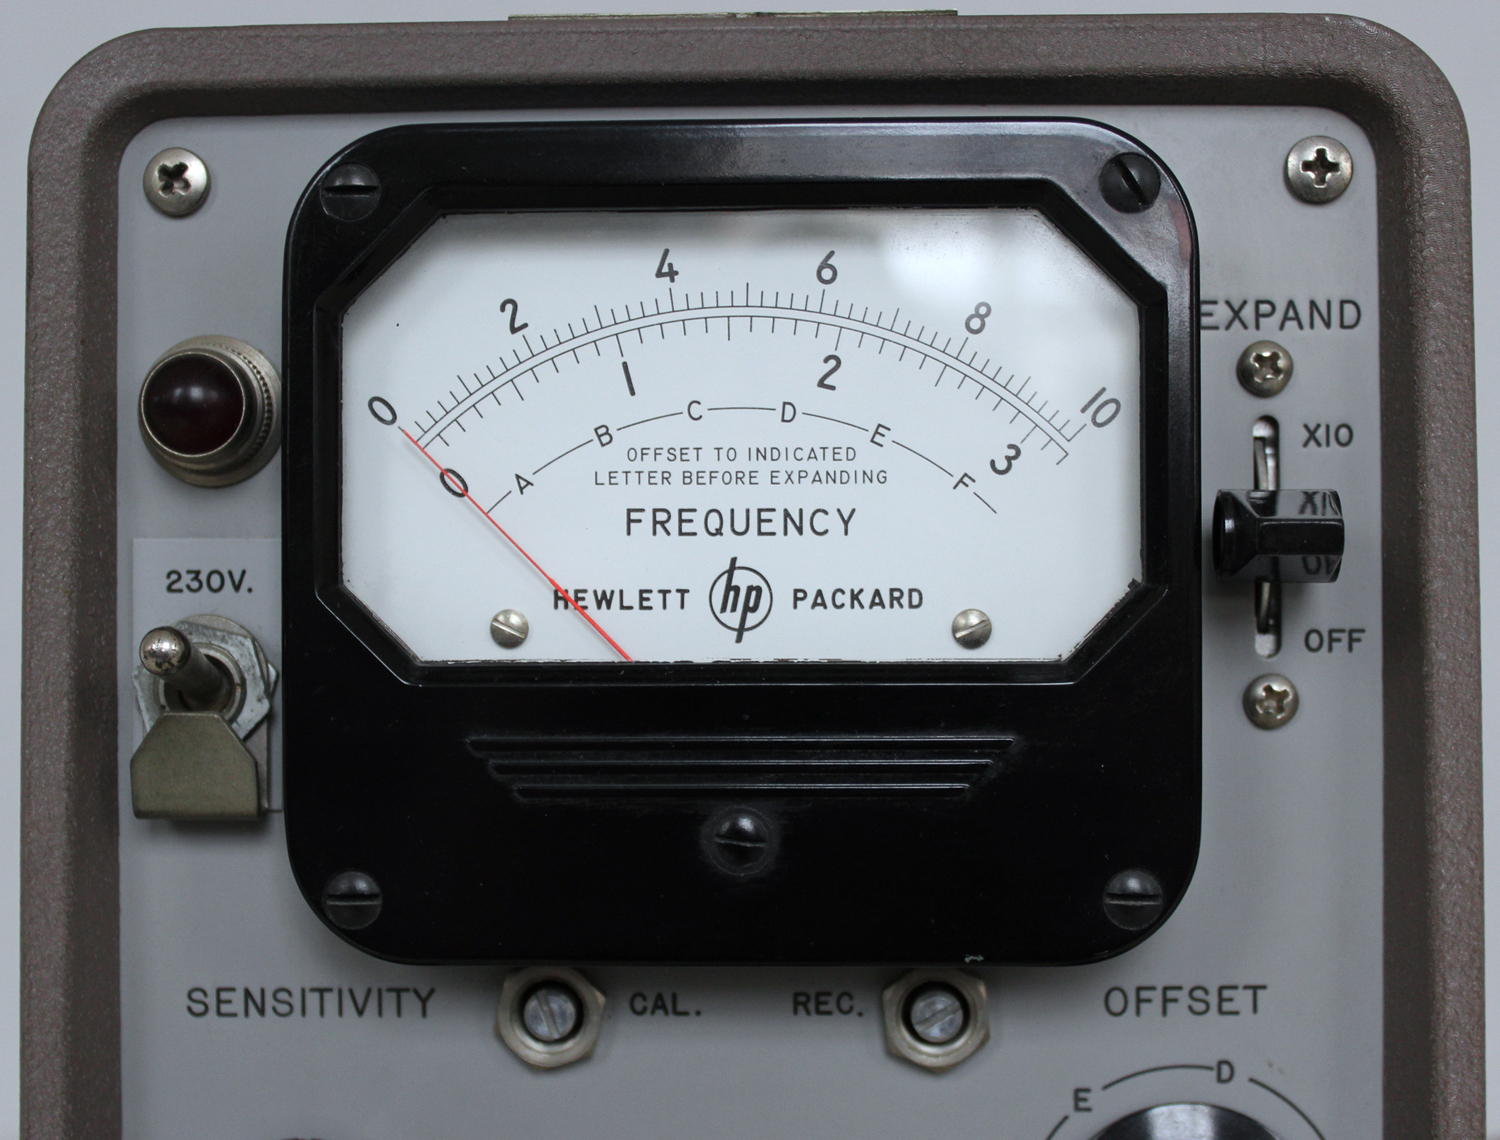
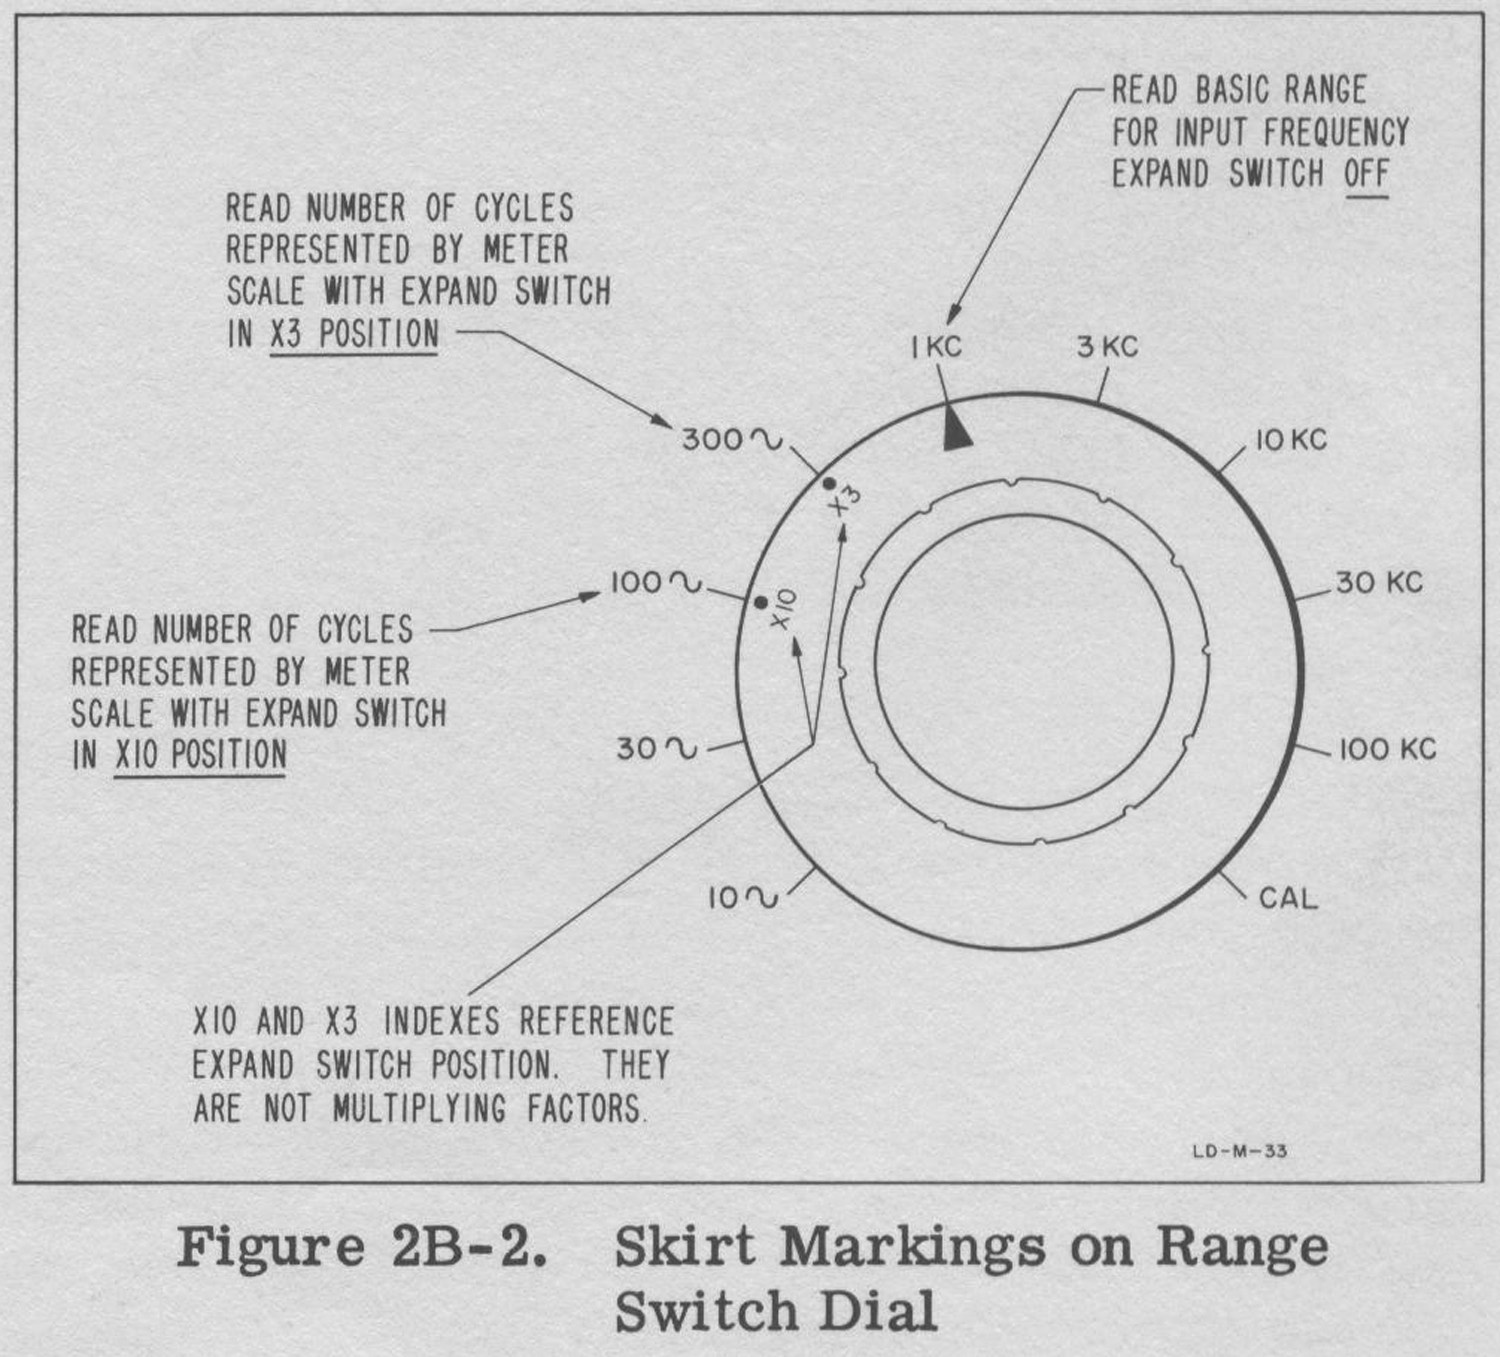
The number of rpm in the segment is indicated by the X3 or X10 on the skirt of the RANGE switch (see Figure 2C-2).A letter system helps find the segment which  includes the input signal; the letters are marked both on the meter face and around the OFFSET controls. When an unexpanded measurement  is made, the meter pointer indicates a point on the letter system as well as the value of the input signal, and the coarse OFFSET control should be set near that point of the letter system before the EXPAND switch is actuated. When the EXPAND switch is actuated, the meter pointer will be on scale or not far off scale, and slight adjustment of the OFFSET controls will set the meter pointer to the desired place on the scale.
Presetting the OFFSET controls makes it easier to find the segment which includes the input signal and prevents the meter pointer from violently pinning off scale when an expanded scale is selected.
Four things must be remembered when the expanded scales are used:
1.The setting of the OFFSET controls is  arbitrary! Any segment may be chosen. However, only segments which include the input signal are useful.
2.The letter system is a guide to help find the segment which includes the input signal. It is not exact.
3.The numbers on the meter scales do not indicate specific speeds because the segment can be set anywhere along the basic range. However, if the selected segment includes the input signal, the pointer indicates the relative position of the input signal within the segment. If the segment does not include the input signal, the pointer will be off scale.
4.Calibration of the meter scales is determined by the position of the pointer, the basic range selected, and the degree of expansion. For example, if the 60,000 range is expanded X3, the 0-2 scale becomes a 20,000 rpm segment of the 60,000 range. If the pointer is placed over the 1.8 marker by the OFFSET controls, and it subsequently moves to the 0.4 marker, a 14,000 rpm decrease in the input signal is indicated.
The following paragraph describes the use of the expanded scale by following through a differential measurement example.
2C-4 EXAMPLE PROCEDURE
a.Connect the Model 500C to proper source; turn on the power switch and allow five minutes for the instrument to reach a stable operating temperature.
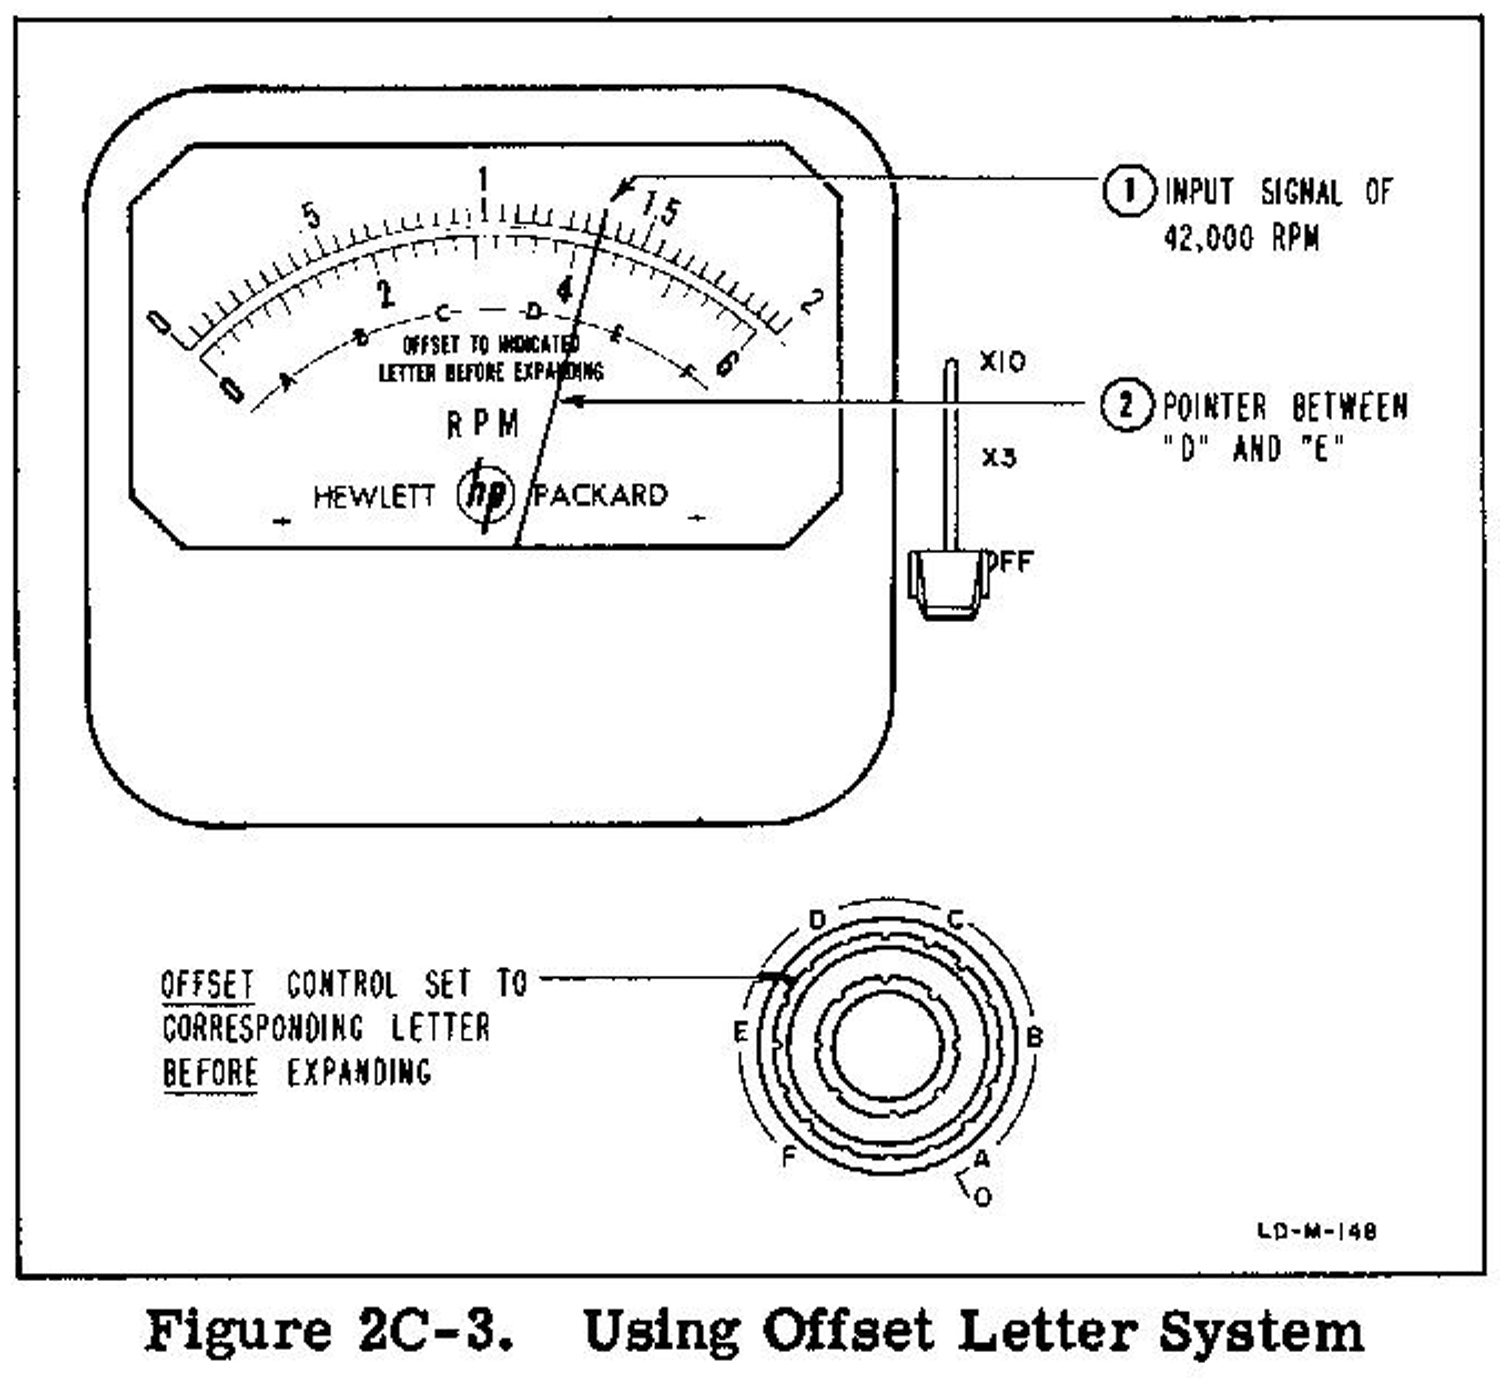
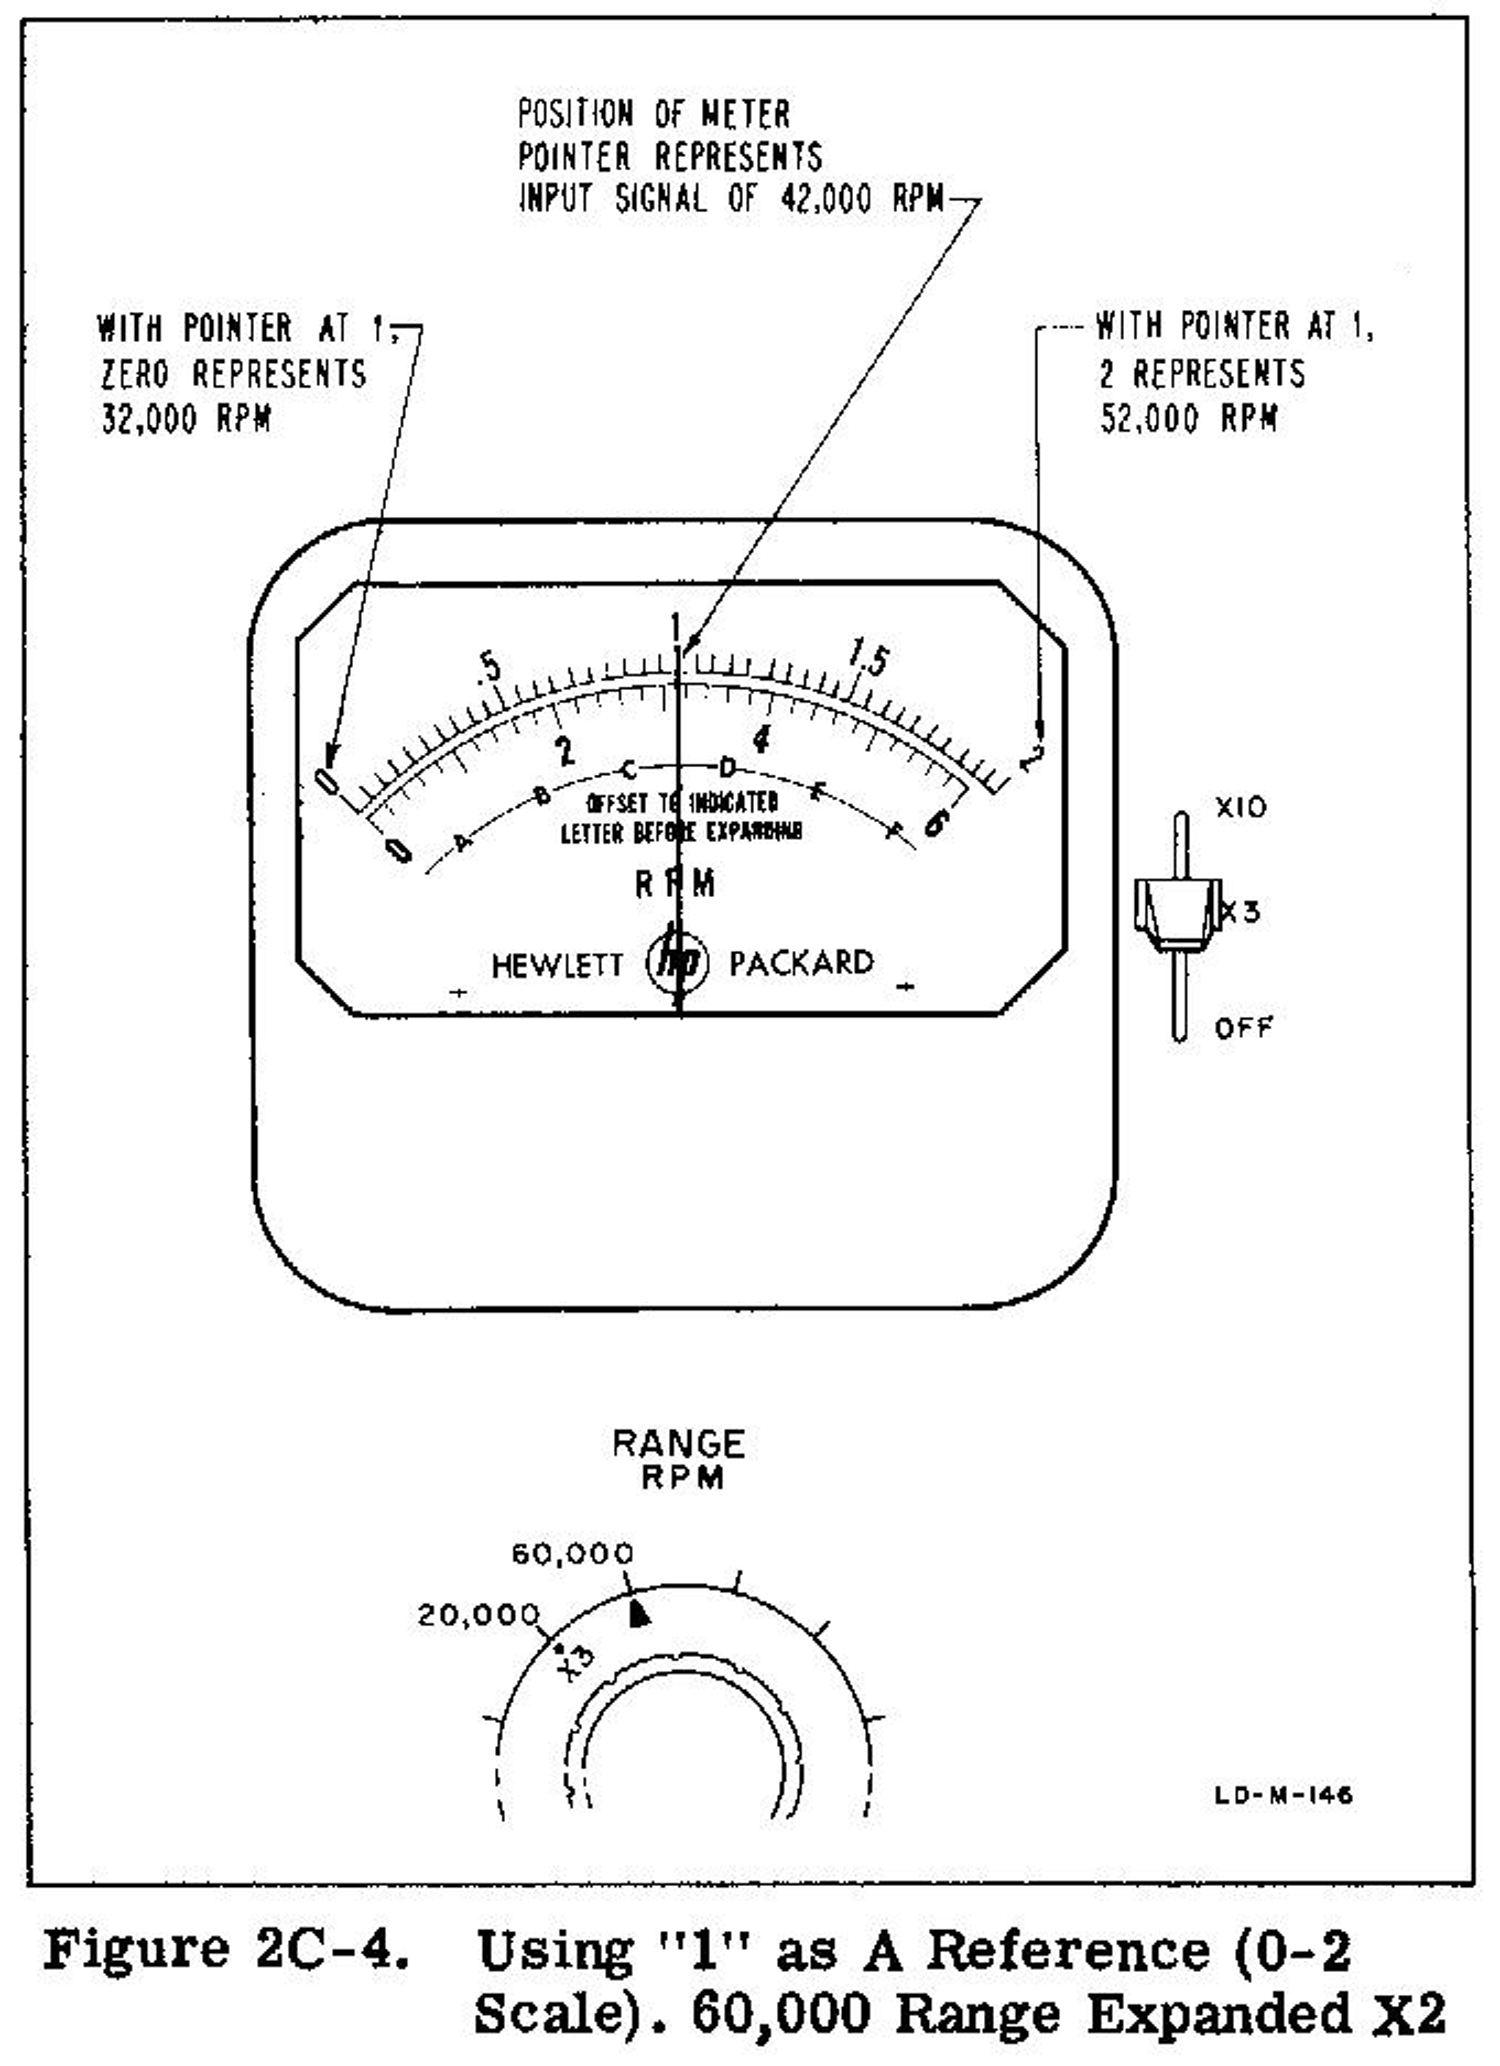
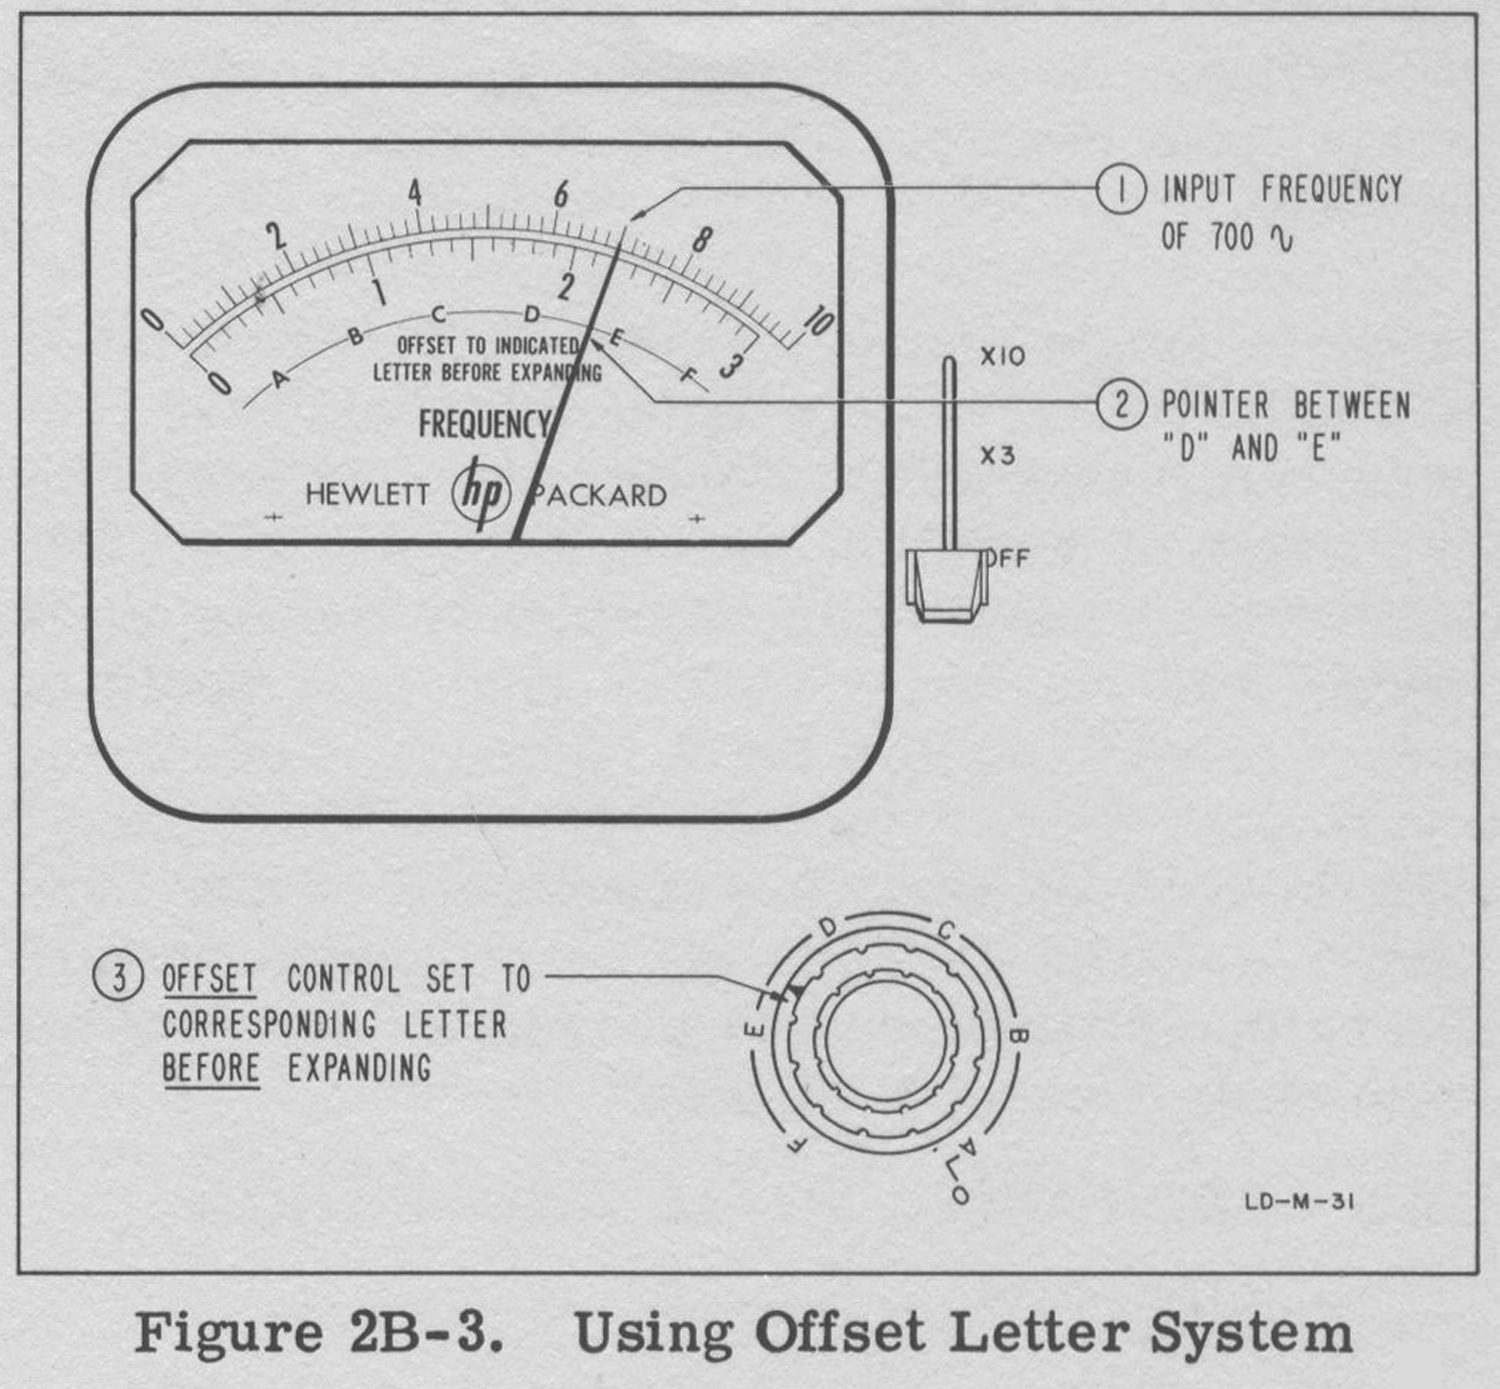
b.Make an tm expanded measurement of the input signal as described in paragraph 2C-2. Assume that the measurement is 42,000 rpm on the 60,000 range, and that ± 6000 rpm variation is to be observed. Note that the meter pointer rests between D and E on the letter system. See Figure
2C-3.c.Adjust coarse OFFSET control to the corresponding point between D and on the letter system around the control.
d.Place EXPAND switch to X3 position. With the EXPAND switch in the X3 position, the 0-2 scale is a 20,000 rpm segment of the 60,000 range.
e. Refine OFFSET adjustment to place pointer at the desired reference. The meter pointer can be placed anywhere on the expanded scale, but to observe the ± 6000 rpm variation, the pointer must be at least 6000 rpm from either end of the scale.
Suppose the pointer is placed at “1” on the 0-2 scale. Figure 2C-4 illustrates the resulting  calibration of the meter scale.
If the pointer had been placed at “0”, the “0” would have become 42,000 rpm, and the meter scale would have displayed a 20,000 rpm segment from 42,000 rpm to 62,000 rpm with the 62,000 rpm point at “2”. In this case, only the +6000 rpm variation could be observed.2C-4A EXAMPLE SUMMARY
Control of the meter pointer allows an arbitrary calibration of an expanded scale within a small segment of the basic range. This control establishes a reference point suitable to a particular  differential or comparative measurement. In the example developed above, the expanded segment contained 20,000 rpm displayed full scale with an input frequency of 42,000 rpm. Greater pointer excursion occurs per revolution of variation than would occur using the unexpanded 60,000 scale. The greater pointer excursion allows more  sensitive observation of fluctuations, variations, and drift in the input signal. It displays these changes more accurately than would have been possible on the 60,000 rpm range unexpanded.
In the example above, suppose a ± 3000 rpm variation was to be observed.  X10 expansion could have been used to present an even greater pointer excursion per revolution of variation than that for X3. In the X10 case, the segment would  contain only 6000 rpm (0-6 scale), and the meter pointer (42,000 rpm) would be placed at the 3.0 marker to allow the variation to be observed.
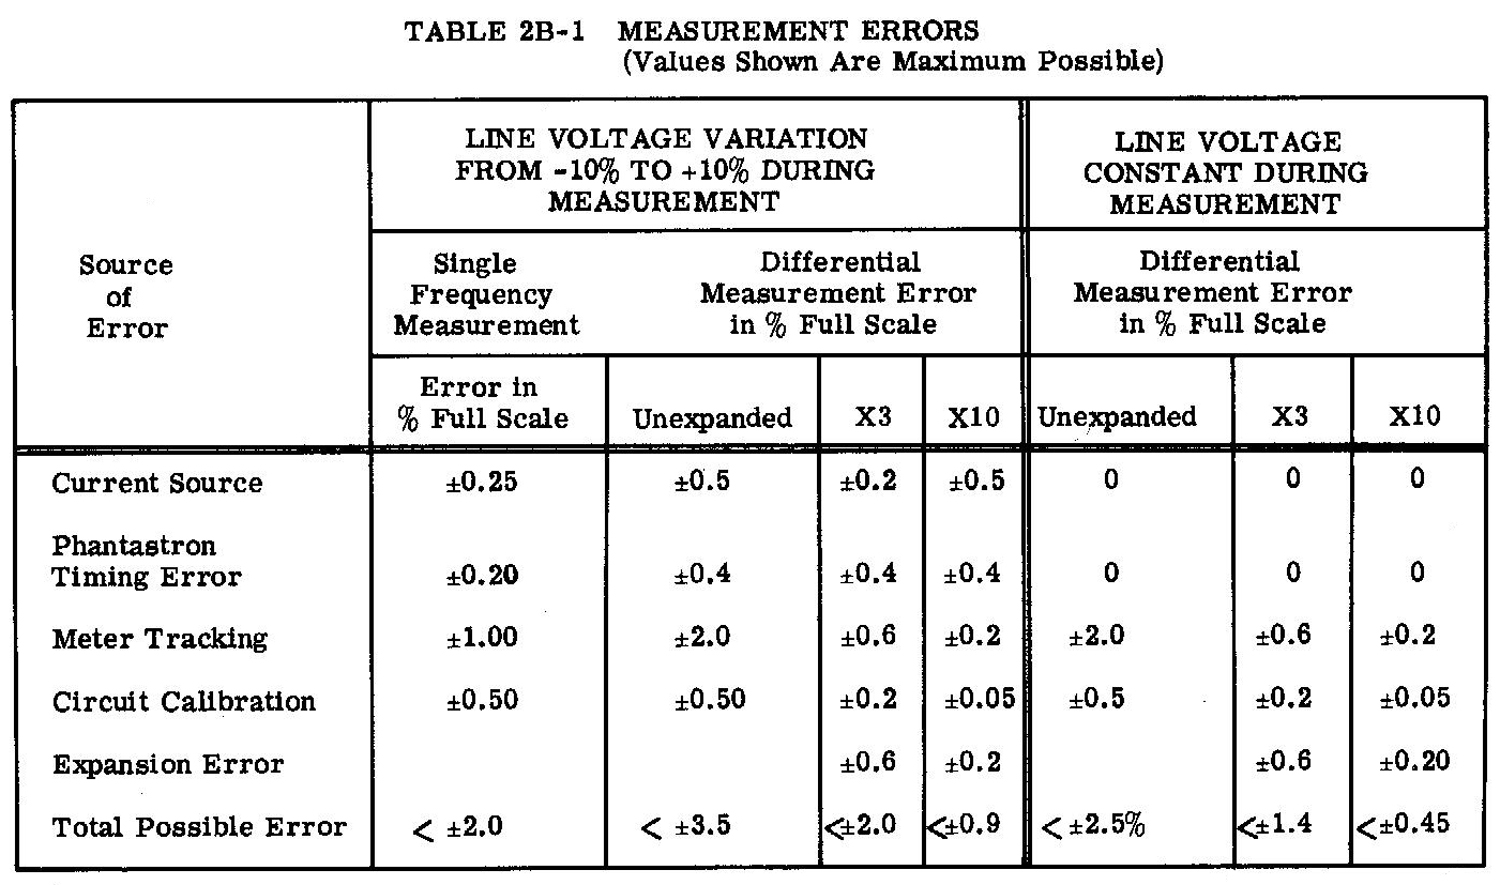
The amount of variation anticipated on the input signal governs the amount of expansion chosen. Paragraph 2B-6 discusses instrument accuracy for each measurement condition.

                            —————NOTE ————-
The 500B and 500C instruments are identical except for meter and range switch calibration. On the 500B, the meter and range switch are calibrated in cycles per second. On the 500C, the meter and range switch are calibrated in revolutions per minute. Thus the two instruments are operated in the same way, and identical results are  obtained from identical inputs. For example, the 500B will display a 500 cps input as 500 cps; the 500C, with the same input, will display 60 × 500 or 30,000 rpm, which is equivalent to 500 cps.
The paragraphs above (2C-1 through 2C-4A), which pertain only to the 500C, parallel  exactly paragraphs 2B-1 through 2B-4A, which pertain to the 500B. Section IIC is written to avoid any confusion which might arise from attempting to operate the 500C from the 500B operating instructions. However, paragraphs 2B-5 through 2B-15 will not be duplicated for the 500C. Simply remember to convert cycles per second to revolutions per minute when applying these paragraphs to the 500C. This means that the input  frequency in cps multiplied by 60 will give the reading obtained on the 500C.
SECTION III
THEORY OF OPERATION3-1 INTRODUCTORY
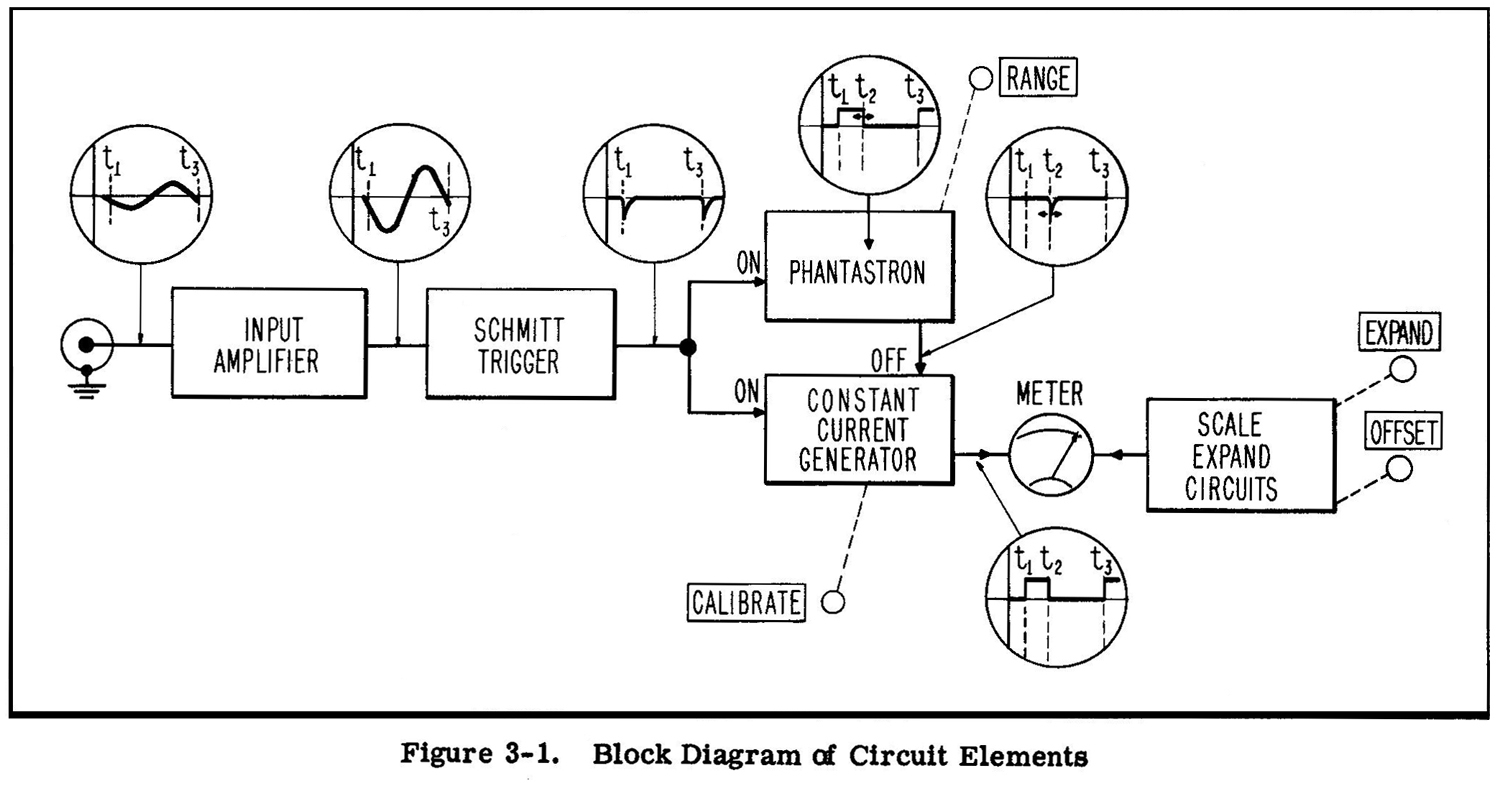
This section describes circuit operation for the Model 500B by discussing each element of the block diagram shown in Figure 3-1.
3-2 INPUT AMPLIFIER, V1
V1 is a conventional differential amplifier with V1A acting as a cathode follower driving the cathode of V1B. Since there is no variation in the V1B grid source (bias network consisting of R8 R9, R11), V1B acts a a grounded grid amplifier.
Bias for V1A and V1B is provided by the network R4, R8, R9, and this bias is fixed at ac ground through C3. Because V1A has no plate load it tends to conduct more current than V1B so the bias network furnishes more bias for V1A than for V1B  and equalizes the plate currents in the two sections.  The output signal from the input amplifier is coupled to the Schmitt Trigger through C5.3-3 SCHMITT TRIGGER, V2
V2 is a Schmitt Trigger, conventional in all respects  except in the use of C6, which permits the amplitude of the output wave leading edge to be greater than that normally encountered in the conventional circuit.
The positive going portion of the trigger output is eliminated by one-half V3, while the negative going portion is differentiated by C7 and R20 and passed through the other half V3 as a negative spike to the V4A grid.
The sensitivity of the trigger is adjusted by R12 which adjusts the no signal voltage on the V2A grid.
3-4 SWITCHING MULTIVIBRATOR, V4
V4 is a one shot cathode coupled multivibrator. In the no signal condition V4A conducts while V4B is cut off. A negative spike from the trigger  V2 cuts off V4A causing the rapid switch in conduction to V4B associated with multivibrators  of this type. However, V4 is not a true multivibrator because it does not return to the no signal state of its own accord. Recovery is determined by the action of the phantastron circuit, V5 – V7.
3-5 SWITCHING CONTROL CIRCUIT
As a negative trigger spike hits the V4A grid, a positive switching pulse appears on the V4A plate. This pulse is coupled to the phantastron tube V5 through C11 and C12, starting a typical Miller voltage rundown in the phantastron circuit1.  At rundown start, the screen voltage on V5 rises holding the V4B grid against the diode clamp V7A, thus maintaining conduction in V4B during the rundown period. At rundown completion, the screen voltage on V5 descends cutting off V4B. The period of the rundown is fixed by the RC time constant selected by S1, RANGE switch.
Phantastron action, therefore, causes V4B to develop a current pulse during conduction which is stable in length. At the same time degenerative action of the V4 cathode resistor and the action of the clamp V7A causes the current pulse to be stable in amplitude. One such stable pulse is passed through the meter circuit for each input cycle. The meter averages the pulses it receives and presents an indication proportional to average frequency.
__________________

1. An excellent discussion of the phantastron circuit  may be found in Terman, F. E. and Pettit, J. M., ELECTRONIC MEASUREMENTS, 2nd Edition, McGraw-Hill Book Co., New York, 1952.

3-6 EXPANDED SCALE
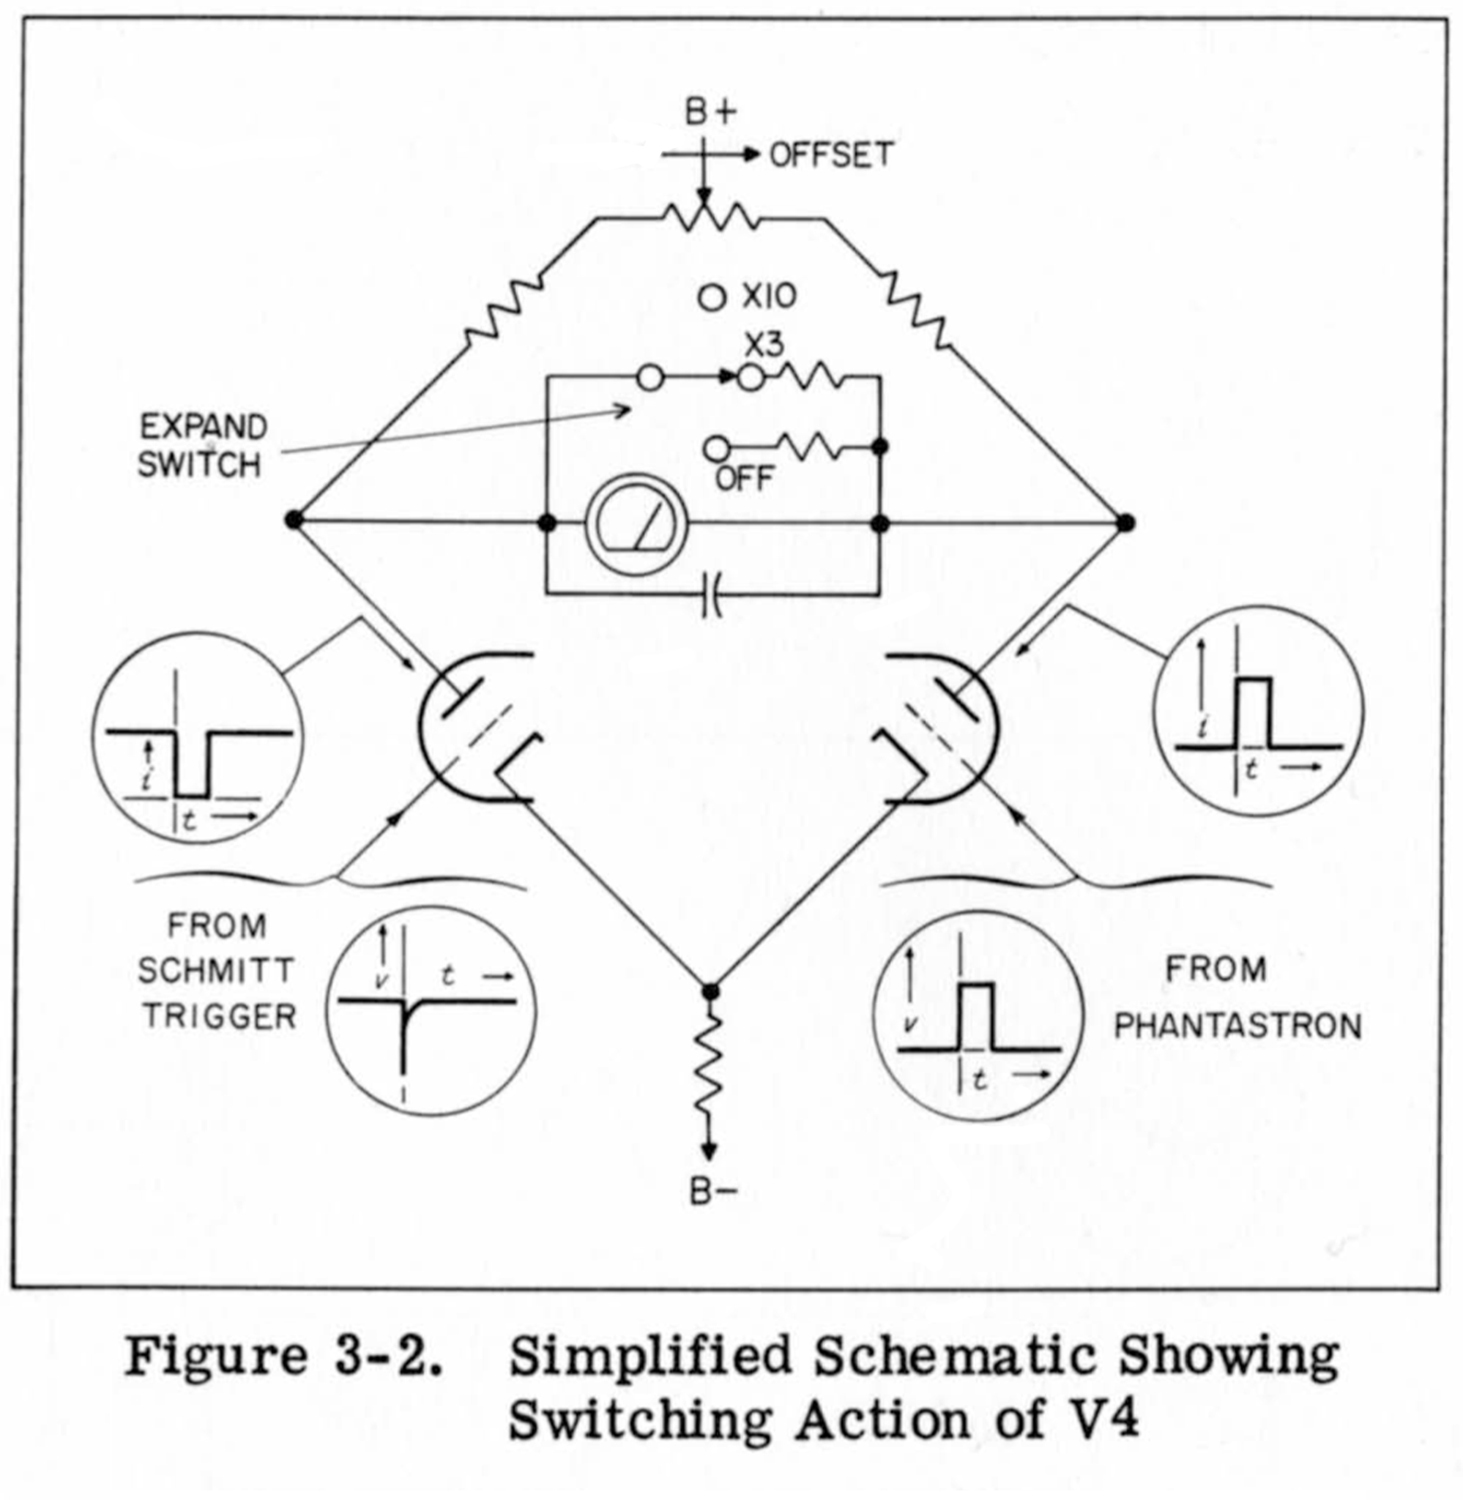
When the expand switch is placed in either X3 or X10, the meter shunts, R32 and R30, are removed respectively, and the OFFSET control R24 and R25 is placed across the meter. This configuration is essentially a bridge as shown in Figure 3- 2.
The two halves of V4 conduct alternately and represent two arms of the bridge. The input frequency determines the current ratio in which the tubes conduct. The bridge is balanced for the input frequency with the OFFSET control to keep the meter pointer on scale. Resistor R27 preserves  the calibration of the meter circuit over the range of OFFSET control.
3-7 CALIBRATION
When the Range switch S1 is placed in the CAL position the circuit action is as follows: The grid of V4B, the Switching Multivibrator is  disconnected from the -320 volt bus and rises  against the V7A clamping voltage. This allows V4B to conduct through the meter circuit, while V4A is cut off. The amount of current through V4B is then adjusted by means of R35 in its cathode circuit. The amount of current through V4B determines the amount of current flowing through the meter and the OFF position shunt of the EXPAND switch S2. This shunt consists of R31 and R32.
The meter is calibrated when the steady current through the meter circuit from V4B  produces a full scale deflection (or 10) on the meter.
Adjusting R35 will produce this calibration.»
§§§
Per consultare la prima parte scrivere ”500B” su Cerca.
Foto di Claudio Profumieri, elaborazioni e ricerche di Fabio Panfili.
Per ingrandire le immagini cliccare su di esse col tasto destro del mouse e scegliere tra le opzioni.


 

Frequency Meter HP mod. 500B 1ª parte.


Frequency Meter HP mod. 500B. Prima parte.
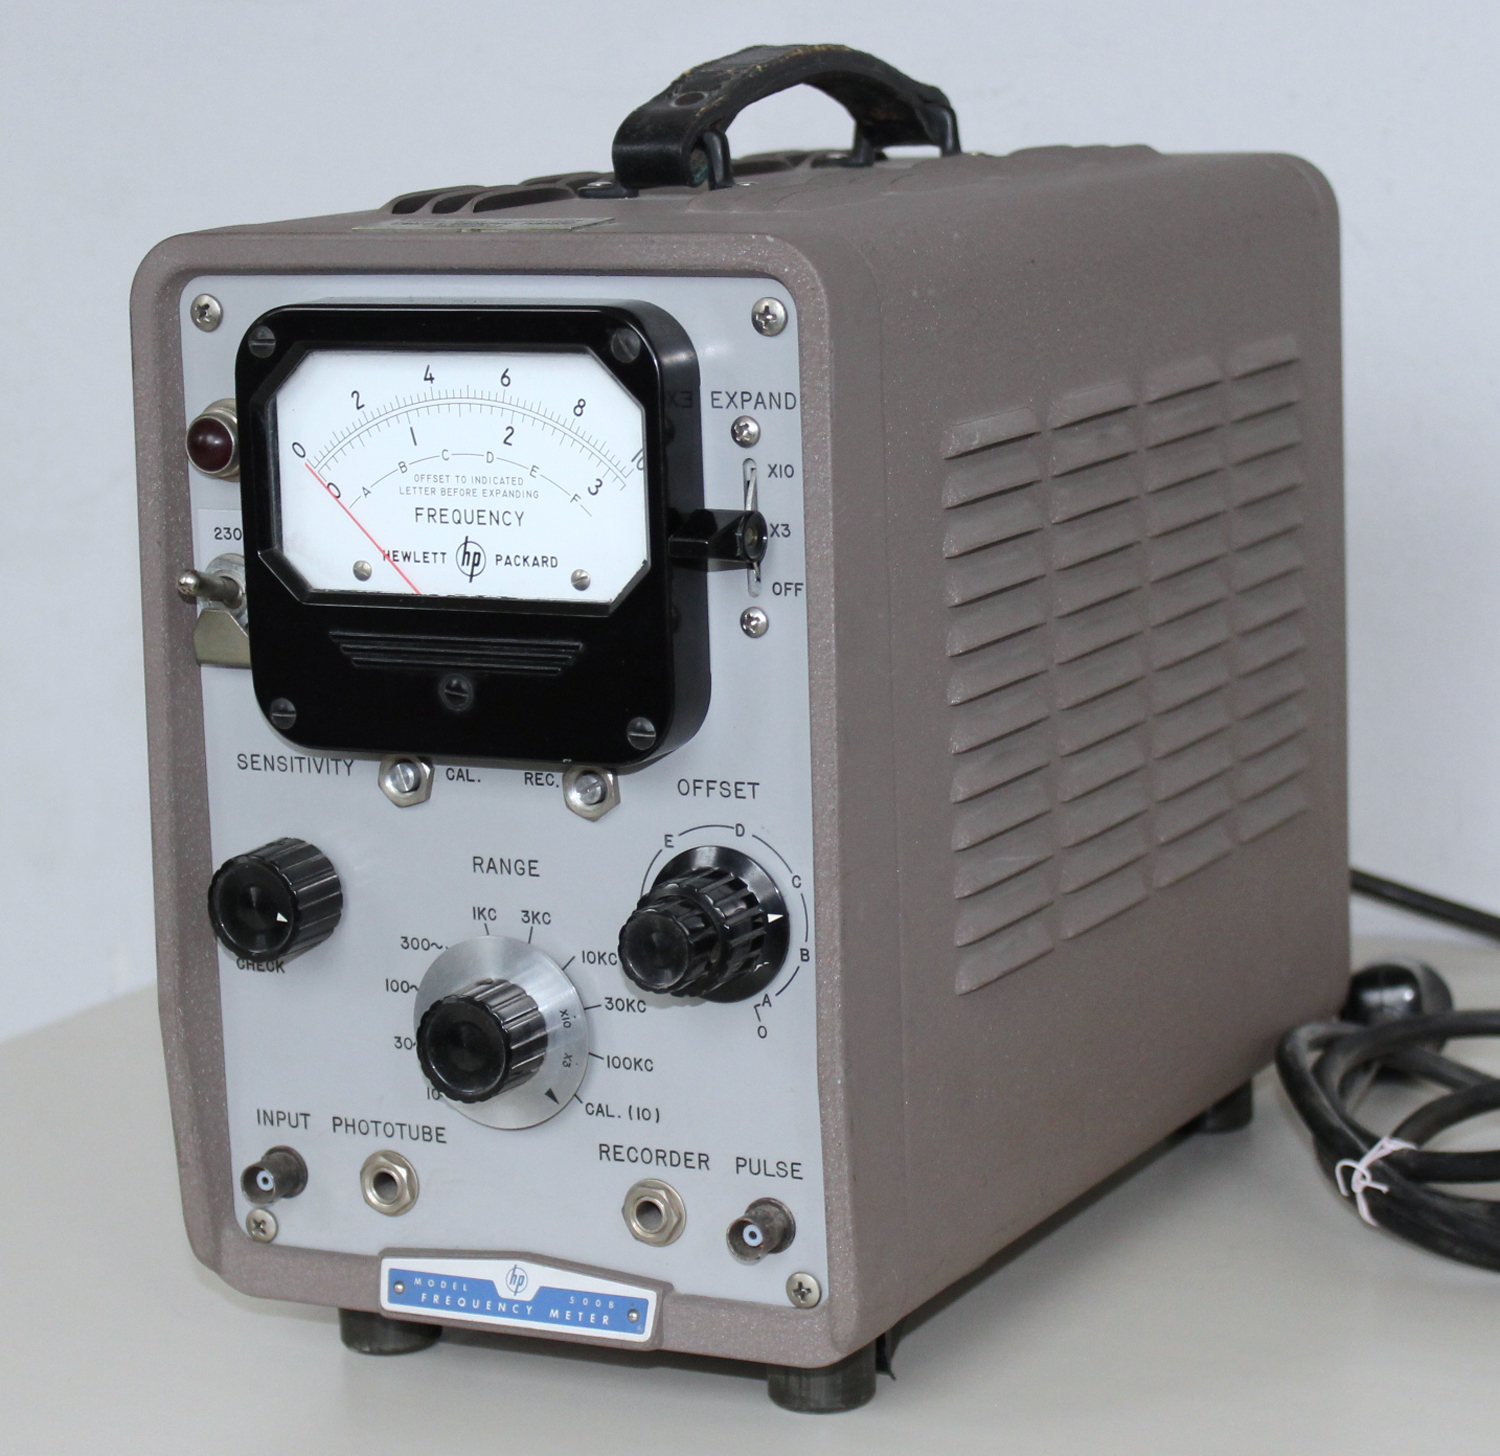
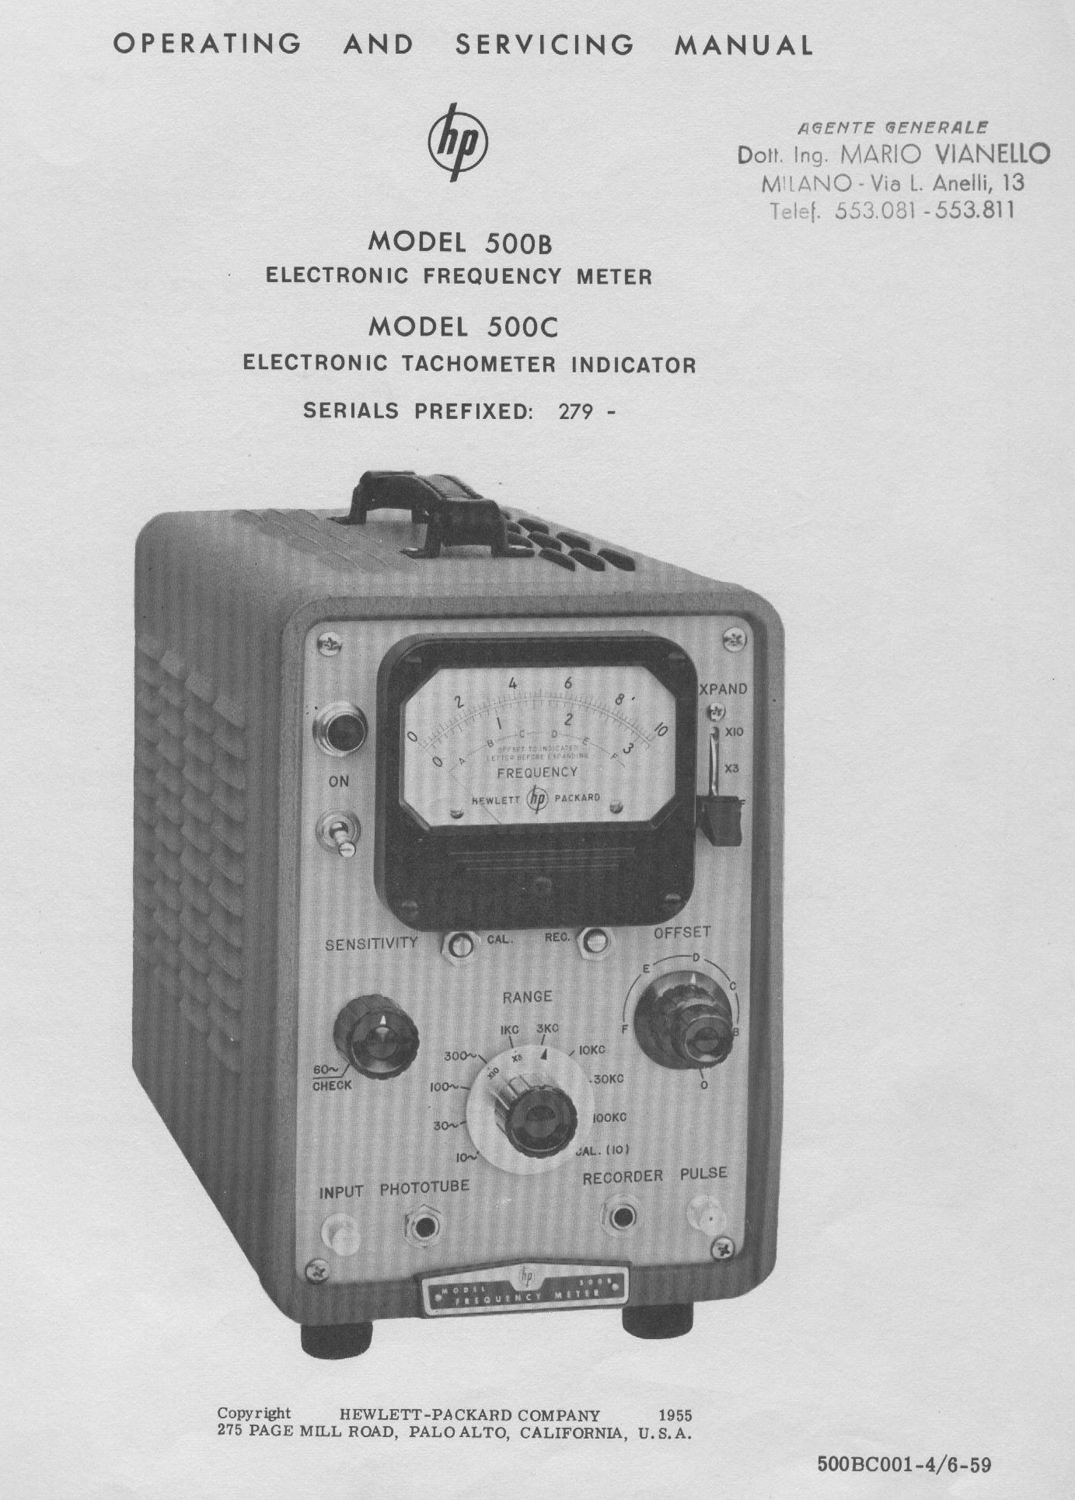
Importato da Ing. Mario Vianello, Milano.
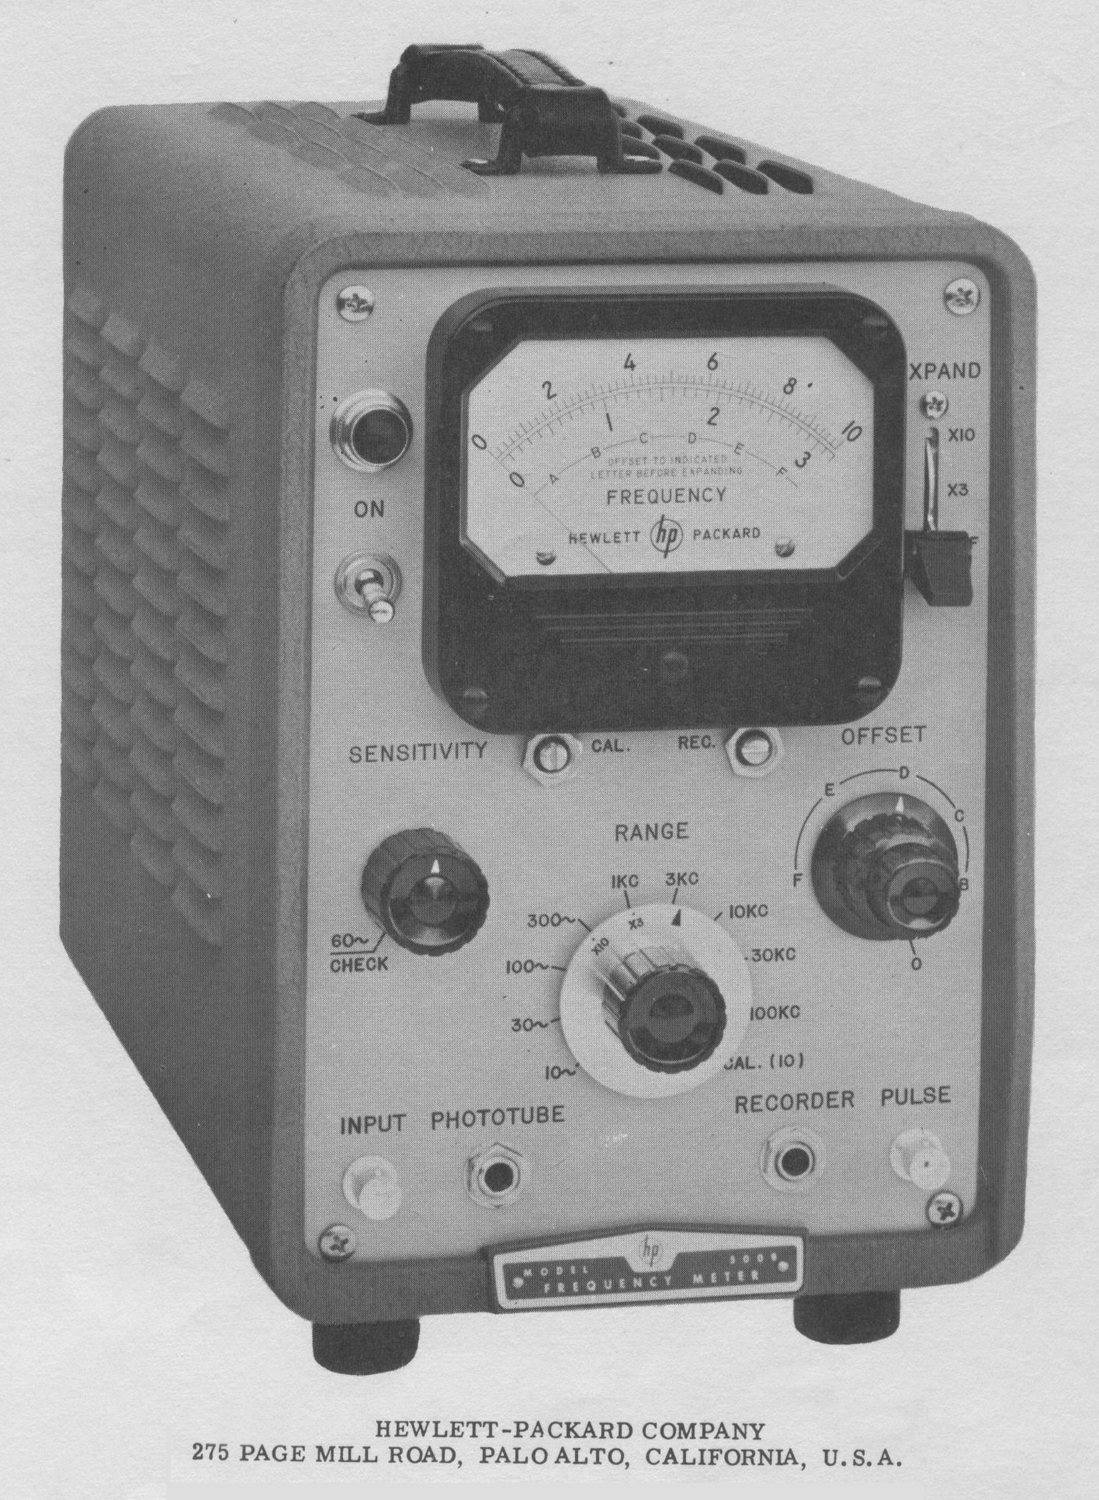
Nell’inventario D del 1956, in data 30 dicembre 1960, al n°  1858  si legge:  “Piaggio- Genova.  Frequenzimetro -hp-, mod. 500B, destinazione Elettronica”.
Nell’Estratto dell’Inventario ad uso della Sezione Elettronica, al n° 1858, in data giugno 1961, si legge: “Frequenzimetro portatile mod. 500B 3 Hz 100 Hz. Destinazione Laboratorio”.
Dono della Fondazione Carlo e Giuseppe Piaggio di Genova, come si legge nella targhetta visibile in una foto.
Un manuale di istruzioni si può trovare all’indirizzo:
http://hparchive.com/Manuals/HP-500B-C-Manual.pdf .

Noi riportiamo in due schede una parte del manuale del 1959 conservato presso la Sezione Elettronica. Abbiamo ritenuto opportuno omettere la sezione MAINTENANCE, per abbreviare il testo, ma inserendo alcune figure interessanti contenute in essa.§§§
«SECTION I GENERAL DESCRIPTION
1.1 GENERAL DESCRIPTION
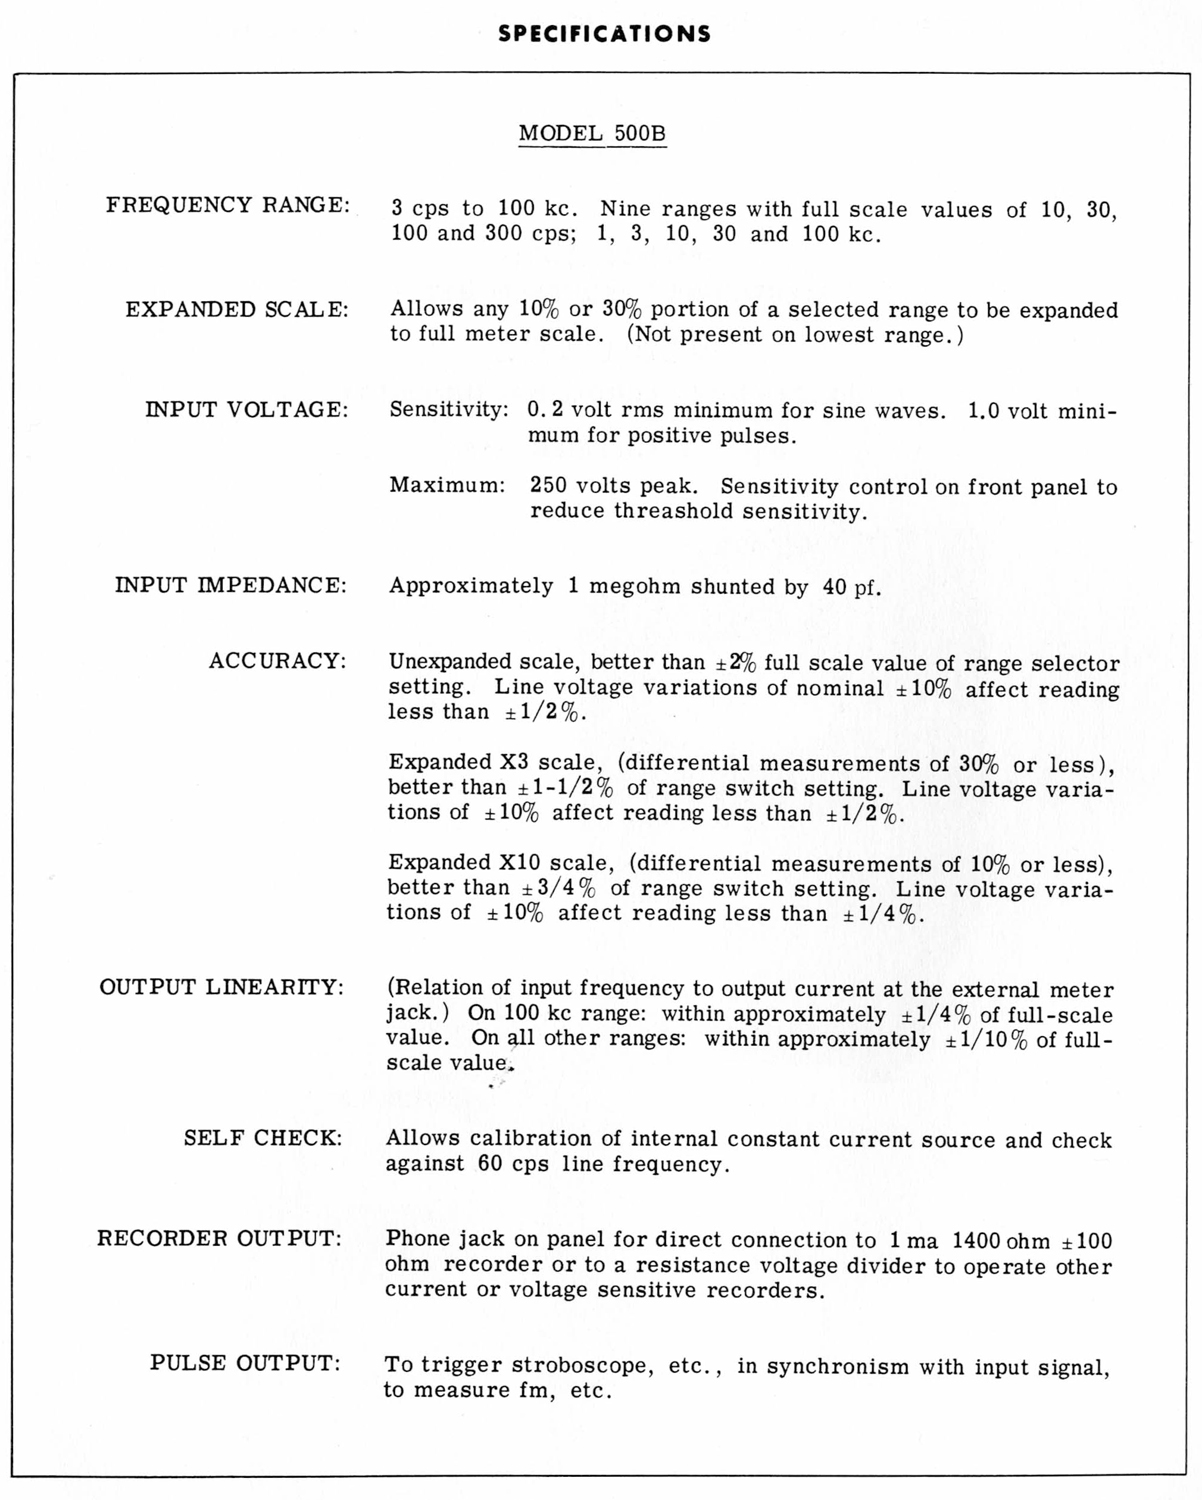
The Model 500B directly measures the frequency of an alternating voltage from 3 cps to 100 KC. It is suitable for laboratory measurement or production testing of audio and supersonic frequencies or for direct tachometry measurement with appropriate transducers, such as the -hp- 506A Optical Tachometer Pickup or the -hp- Model 508A/B Tachometer Generators. The indications of the meter are independent of input waveform, permitting the instrument to count sine-waves, square waves, or pulses and to indicate the average frequency of random events. A RECORDER  jack permits operation of a 1 ma recorder, such as the Esterline-Angus Automatic Recorder, for continuous frequency record. The impedance characteristics of this terminal may be adjusted to match any 1400 ohm (±100 ohm) 1 ma recorder to the 500B meter circuit. The RECORDER jack also may be employed to drive a remote indicating meter available from the Hewlett- Packard Company as an accessory. Besides indicating an applied frequency and providing a recorder output, however, the Model 500B is designed to be valuable in two other types of measurements. First, it is designed to be able to expand its scale readings by factors of 3 or 10 times, an arrangement that facilitates measurements of frequency changes such as might be caused by line voltage changes on frequency-generating circuits. Second, the instrument is designed to provide an output voltage which is proportional to the applied frequency. This signal from the PULSE terminal enables the instrument to be used as a wide band discriminator in applications where the measured signal contains very rapid frequency changes or frequency modulation. The discriminator voltage, when filtered, can be used to measure the amount of deviation in the signal as well as the rate and components of deviation. The Model 500C Electronic Tachometer Indicator is similar in circuitry to the 500B except for the meter calibration. The Model 500C is calibrated in terms of RPM with a counting range from 180 RPM to 6,000,000 RPM. In conjunction with the Hewlett-Packard Model 508B Tachometer Generator  the 500C will measure speeds from 15 to 40,000 RPM. When used with the Model 506A Optical due Tachometer Pickup the instrument is capable  of measuring very high speeds of moving parts which have small energy, or which for mechanical  reasons  cannot tolerate mechanical loading.
1-2 DAMAGE IN TRANSIT
Instructions and information concerning shipping  damage are contained in the WARRANTY section on the last page of this manual.
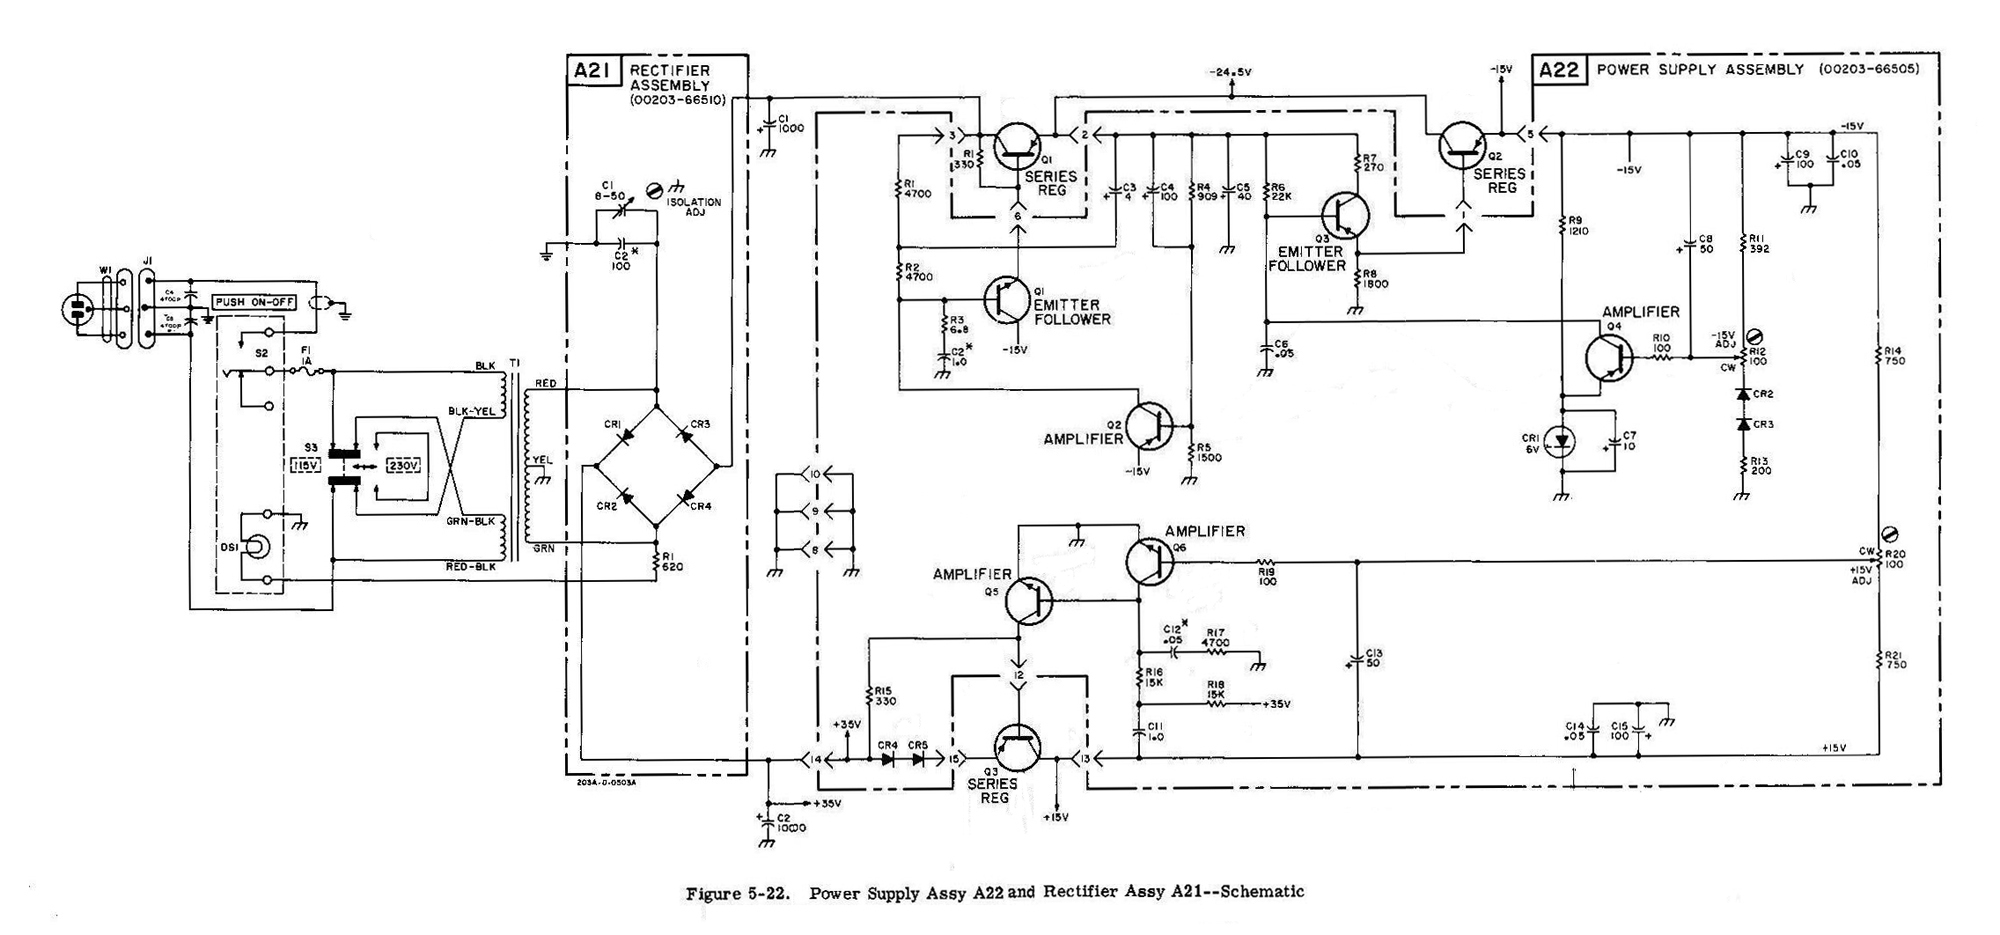
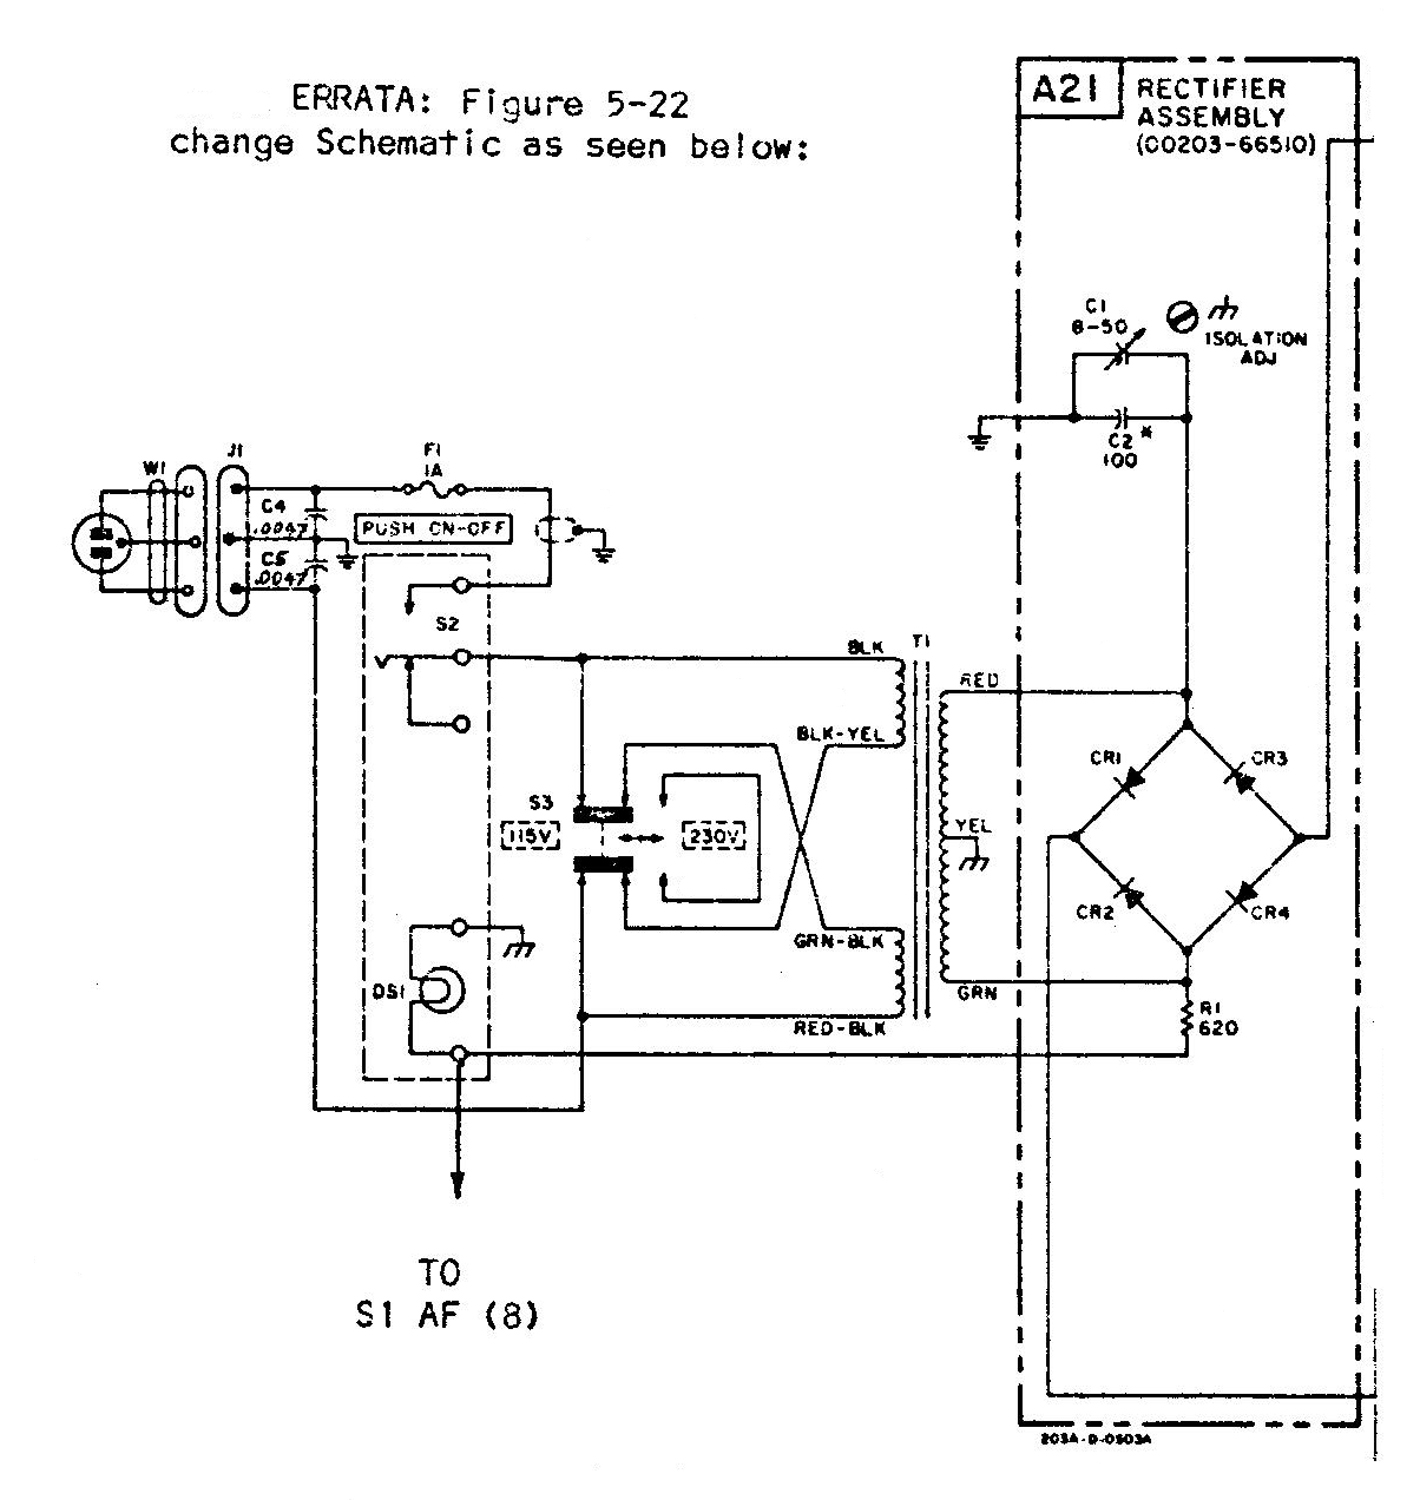
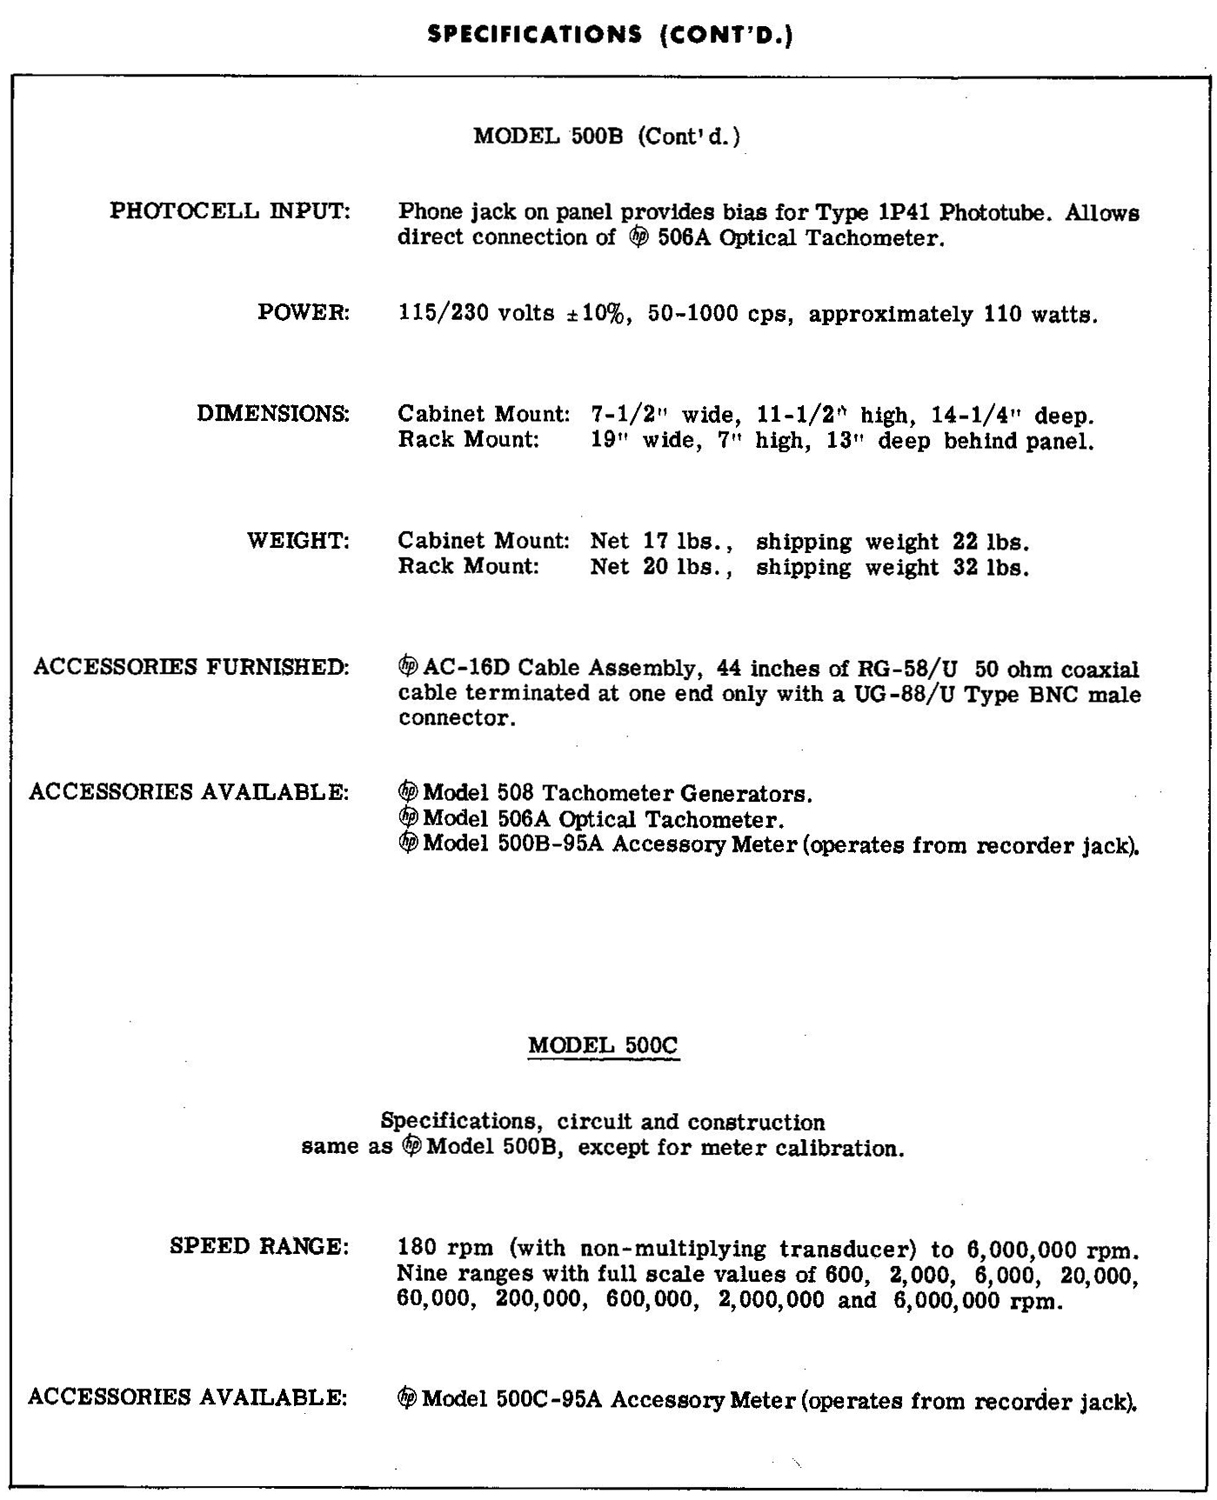
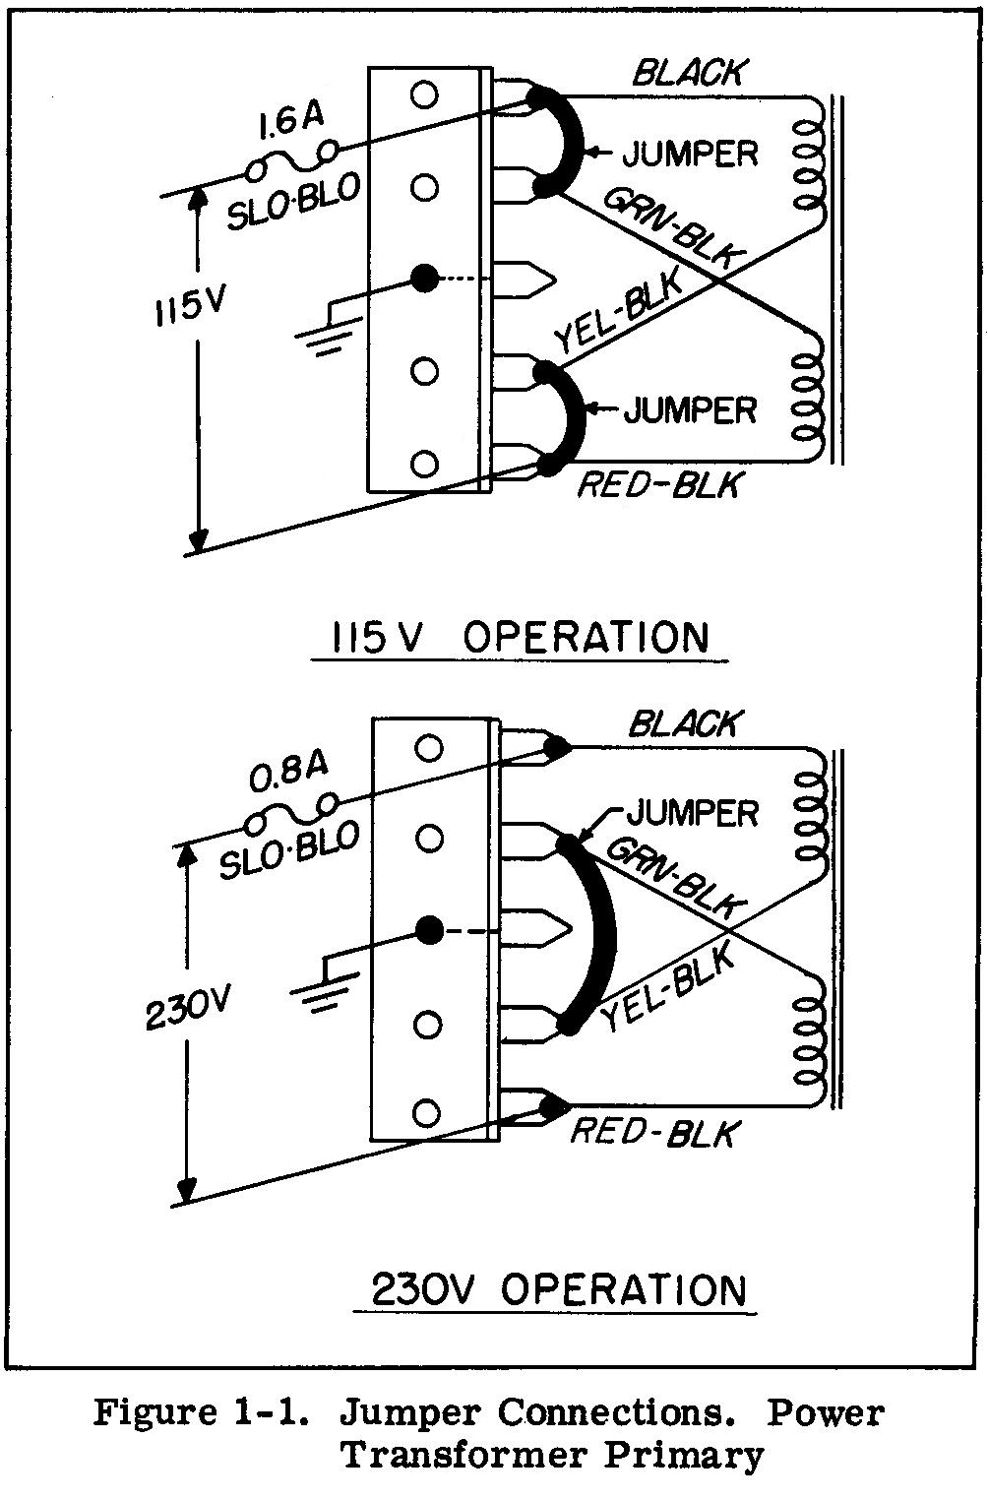
1-3 POWER TRANSFORMER CONVERSIONThe Model 500B may be easily converted  to operate from a 230 volt line source by removing the bare wire jumpers from the terminal strip, located beneath the power transformer, and inserting a new jumper as shown in Figure 1-2.

As shown in the schematic diagram the 230 V connection changes the primary winding arrangement from parallel (115V) to series (230 V). After converting the instrument to 230 volt  operation, change the line fuse, as shown, to 0.8 amperes, slo-blo.
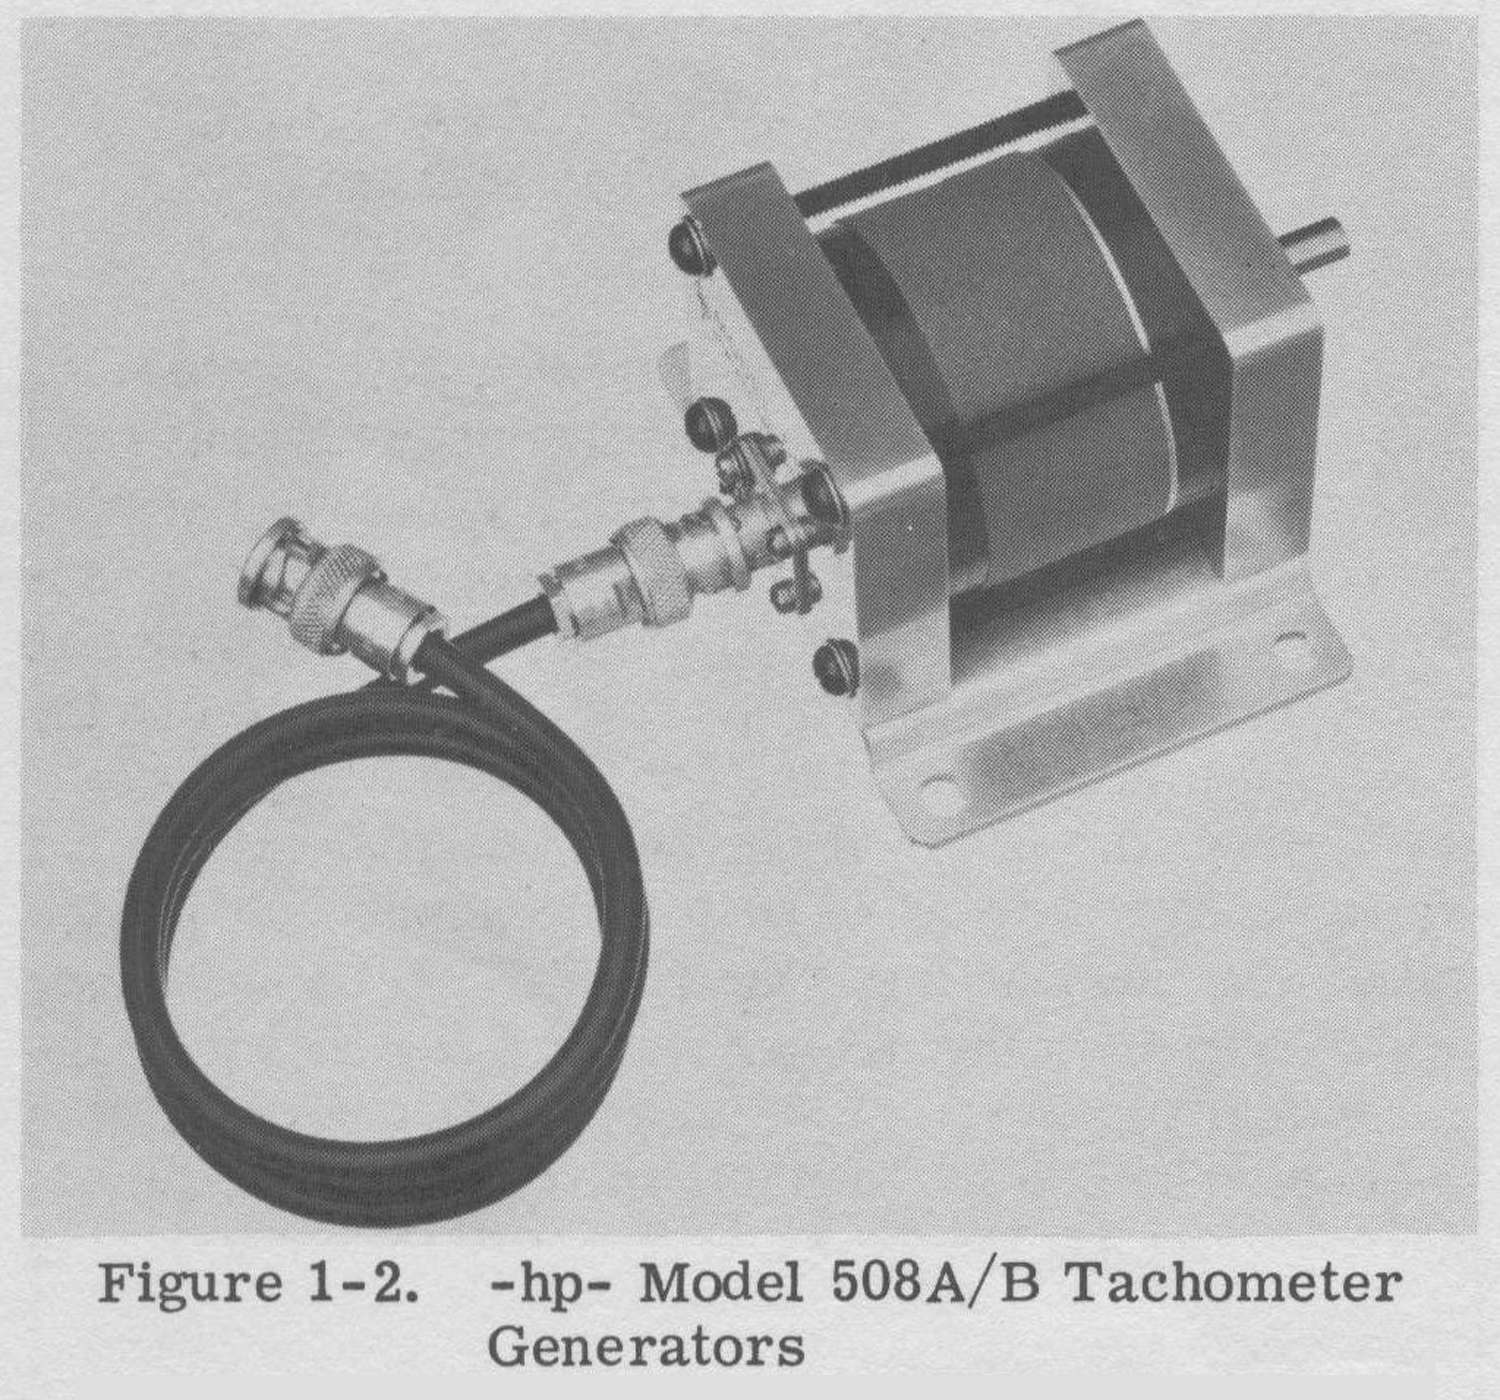
1-4 RPM MEASUREMENT WITH TACHOMETER GENERATORS
The Model 500B measures RPM and RPS by measuring an electrical frequency that is proportional to the speed of a rotating shaft. Generation of this frequency may be accomplished by several types of transducers which allow considerable latitude in measurement technique. A simple and direct way to measure RPM is through the use of a tachometer generator that produces a frequency that is proportional to the speed of its own shaft. The -hp- Models 508A and 508B are examples of this type of transducer, and are recommended  for use with the Model 500B. Both are of the variable reluctance type and have no brushes or slip rings to cause noise or random irregularities that result in inaccurate readings. Other types of generators may be used if they have an output frequency proportional to their shaft speeds and are free of electrical noise and transients.

(Limiting case: S/N = 1.) To assure accurate counts, the use of an oscilloscope to check the signal from other types of tachometer generators is recommended.
1-5 ACCESSORY TACHOMETER GENERATORS
The -hp- Models 508A and 508B are compact low-torque tachometer generators. The Model 508A produces 60 ∼ for each revolution of its drive shaft, while the Model 508B produces 100 ∼ for each shaft revolution. When using the 508A the Model 500B indicates shaft speed directly in RPM. When using the 508B, the displayed answer is divided by 100 to obtain revolutions/sec. When using the 508B, the Model 500C indicates RPM directly when divided by 100. The useful shaft speed range for Model 508A Tachometer Generator is from approximately 15 RPM to 40,000 RPM. Consequently, this tachometer generator is entirely suitable for all shaft speeds normally encountered. The output voltage from these transducers increases almost linearly from 15 RPM to 5000 RPM from a minimum of about 0.1 volt RMS to a maximum of almost 10 volts. At shaft speeds above 5000 RPM, the output voltage decreases gradually to a value of about 1 volt at 40,000 RPM. The linear relationship between out-put voltage and shaft RPM to about 5000 RPM provides  a very useful auxiliary function for the tachometer  generator. The speed-voltage relationship makes it possible to present on an oscilloscope screen a curve describing the instantaneous rate of rotation of a shaft as a function of time. This allows analysis of the instantaneous effect on rotating equipment from the action of clutches, brakes, or other mechanical components. For this application, connect the output of the tachometer generator to the vertical deflection  plates of an oscilloscope. Since the data presented on the oscilloscope screen is usually nonrepetitive in nature, a photographic record is normally made. Torsional vibration, harmonic-ringing and the action of intermittent motions are shown as a function of time by variations in the height of the oscilloscope trace.

1-6 PHOTOELECTRIC TACHOMETRY
Photoelectric tachometry pickups have three particular advantages: they are effective over a wide range of speeds; they are easily adaptable to a wide range of situations; they do not load a system  under measurement. The Model 500B is designed for use with photoelectric transducers and a special connector (PHOTOTUBE), located on the front panel of the instrument, supplies the necessary  bias voltage to a photocell of type 1P41 or equal. This jack serves also as the signal input jack for this application. The Model 506A Tachometer provides for counting speeds or revolutions over a wide range from about 300 RPM (5 RPS) to 300,000 RPM (5,000 RPS). The light source in the Model 506A Tachometer Pickup illuminates a moving part which is prepared with alternate reflecting and absorbing surfaces. The interrupted reflected light is picked up by the phototube and the electrical impulses generated are transmitted to the 500B. This system is positive in action and the danger of fractional or multiple errors inherent in other measuring methods is eliminated. For best results, the size of the reflecting and absorbing surfaces should be approximately 3/4 in. square. This means that the shaft whose speed is to be measured should have a diameter of at least 1/2 inch. The speeds of smaller diameter shafts may be measured by installing a sleeve of larger diameter, or by providing a rotating, reflecting, and absorbing surface at right angles to the plane of the shaft. Surfaces such as these are also used for increasing resolution in measurement of low RPM where the multiple absorbing and reflecting surfaces provide a large number of impulses per revolution. When this is done, a division factor is applied to the reading obtained on the Model 500B. The -hp- Model 506A consists of a pair of shielded tubes, one of which contains an incandescent light source, while the other houses a Type 1P41 Phototube. These are equipped with condensing lenses and are so oriented that proper focus is obtained at a distance between 3 and 6 inches from the reflecting surface. The light source and phototube assembly is mounted on an adjustable stand for optimum positioning of both light source and phototube. The base of this stand contains a transformer which provides the proper voltage for operating the incandescent lamp. The phototube requires a bias voltage from +70 to +90 volts. This voltage is automatically supplied by the PHOTOTUBE jack on the -hp- Model 500B.

SECTION II OPERATING INSTRUCTIONS

SECTION  IIA
2A-1 GENERAL
The operating instructions for the 500B and the 500C are given in two separate sections. The 500B is covered in Section IIB and the 500C is covered in Section IIC. The instruments are identical electrically. The only difference is the meter face calibration and the range selector markings. The paragraphs in the 500B which cover accuracy of measurements, random counting procedure, recorder operation, and pulse applications, are not repeated in Section IIC, although they apply equally well to the 500C.
SECTION  llB
500B OPERATING INSTRUCTIONS
2B-1 CONTROLS AND TERMINALS
SENSITIVITY

This control, normally in the maximum position, is used to decrease the sensitivity of the input amplifier to eliminate errors resulting from spurious modulation of the desired signal.
60 ∼  CHECK
This switch position on the SENSITIVITY control places the line frequency into the input circuit. With the RANGE switch in the appropriate position (usually 100∼) and the EXPAND switch OFF, the meter should indicate the frequency of the line voltage.
RANGE
This rotary switch selects the desired frequency range.
CAL
The CAL position of the RANGE switch checks satisfactory calibration of the constant current source in the circuit by indicating full scale on the 0-10 scale. In this position, input signals have no effect upon the meter.
CAL ADJUST
This screwdriver adjustment is used to calibrate the constant current source. See paragraph 2-9.
EXPAND
Expands any 10 percent (X10) or any 30 percent (X3) of the basic range in use to full scale. Use of the expanded scale is discussed in paragraph 2B-3.
INPUT
This BNC connector accepts any unknown signal from 0.2 to 150 volts rms.
PULSE
This BNC connector is an output terminal providing 35 volt peak pulse out for special applications (see paragraphs 2B-12, 2B-13).
PHOTOTUBE
This phone-type jack furnishes bias for a 1P41 phototube permitting the direct connection of the -hp- Model 506A Optical Tachometer.
RECORDER
This phone-type jack is provided for connecting a 1 ma recorder to the instrument.
REC  ADJ
This screwdriver-operated potentiometer adjusts the effective resistance of a recorder to match the instrument. The adjustment procedure is described in paragraph 2-B-9.
2B-2 OPERATING PROCEDURE, COUNTING
a. Allow a. period of five minutes for the instrument to reach a stable operating temperature after turning ON.

b. Turn the SENSITIVITY control to the maximum clockwise position. Place the EXPAND switch to OFF.
c. Set the RANGE switch to the 100 KC position.
d. Place signal under test across the INPUT connector.
e. Step the RANGE switch down from the 100 KC position as necessary until the meter pointer rests in the top 2/3 of the meter scale. Decrease the SENSITIVITY control and watch for a change in the reading. The reading should remain constant over a plateau of control to assure you that noise modulation is not being measured as part of the signal under test.
It is necessary with unknown input frequencies to start the RANGE switch at 100 KC and step down, because inputs in excess of values on RANGE switch can overdrive the instrument to display erroneous readings, i.e.: 2 KC will be erroneously displayed on the 1 KC range, but not on3 KC range and above.
2B-3 EXPANDED SCALE. GENERAL
The expanded scale feature allows increased accuracy in the measurement of changes in frequency by magnifying pointer action. The pointer action is magnified by expanding to full scale a 30 percent segment (X3 setting of the EXPAND switch) or a 10 percent segment (X
10 setting of the EXPAND switch) of the range selected by the RANGE switch. The particular expanded segment represented  by the meter scale is determined by the concentric OFFSET controls, which move the segment between zero and full scale of the basic range. Since the segment selection is arbitrary and the meter pointer always indicates the value of the input signal, the meter pointer will be on scale only if the selected segment includes the frequency of the input signal. The number of cycles in the segment is indicated by the X3 or X10 on the skirt of the RANGE switch (see Figure 2B-2).A letter system helps find the segment which includes the input signal; the letters are marked both on the meter face and around the OFFSET controls. When an unexpanded measurement is made, the meter pointer indicates a point on the letter system as well as the value of the input signal, and the coarse OFFSET control should be set near that point of the letter system before the EXPAND switch is actuated. When the EXPAND switch is actuated, the meter pointer will be on scale or not far off scale, and slight adjustment of the OFFSET controls will set the meter pointer to the desired place on the scale. Presetting the OFFSET controls makes it easier to find the segment which includes the input signal and prevents the meter pointer from violently pinning off scale when an expanded scale is selected.
Four things must be remembered when the expanded scales are used:
1.The setting of the OFFSET controls is arbitrary! Any segment may be chosen. However, only segments which include the input signal are useful.
2.The letter system is a guide to help find the segment which includes the input signal. It is not exact.
3.The numbers on the meter scales do not indicate specific frequencies because the segment can be set anywhere along the basic range. However, if the selected segment includes the input signal, the pointer indicates the relative positionof the input signal within the segment. If the segment does not include the input signal, thepointer will be off scale.
4.Calibration of the meter scales is determined by the position of the pointer, the basic range selected, and the degree of expansion. For example, if the 1 KC range is expanded X3, the 0-3 scale becomes a 300 cps segment of the 1 KC range. If the pointer is placed over the 2.8 marker by the OFFSET controls, and it subsequently moves to the 1.3 marker, a 150 cps decrease in the input signal is indicated.The following paragraph describes the use of the
expanded scale by following through a differential
measurement example.
2B-4 EXAMPLE PROCEDURE
a.Connect the Model 500B to proper source; turn on the power switch and allow five minutes for the instrument to reach a stable operating temperature.

b.Make an unexpanded measurement of the input signal as described in paragraph 2B-2. Assume that the measurement is 700 cps on the 1 KC range, and that ±100 cps variation is to be observed. Note that the meter pointer rests between D and E on the letter system. See Figure 2B-3.
c.Adjust coarse OFFSET control to the corresponding point between D and E on the letter system around the control.
d.Place EXPAND switch to X3 position. With the EXPAND switch in the X3 position, the 0-3 scale is a 300 cps segment of the 1 KC range.
e.Refine OFFSET adjustment to place pointer at the desired reference. The meter pointer can be placed anywhere on the expanded scale, but to observe the ±100 cps variation, the pointer must be at least 100 cps from either end of the scale.
Suppose the pointer is placed at “2” on the 0-3 scale. Figure 2B-4 illustrates the resulting calibration of the meter scale.
If the pointer had been placed at “0”, then “0” would have become 700 cp, and the meter scale would have displayed a 300 cps segment from 700 cps to 1,000 cps with the 1,000 cps point at “3”. In this case, only the +100 cps variation could be observed.2B-4A  EXAMPLE SUMMARY
Control of the meter pointer allows an arbitrary calibration of an expanded scale within a small segment of the basic range. This control establishes a reference point suitable to a particular differential or comparative measurement. In the example developed above, the expanded segment contained 300 cps displayed full scale with an input frequency of 700 cps. Greater pointer, excursion occurs per cycle of variation than would occur using the unexpanded 1 KC scale. The greater pointer excursion allows more sensiti
ve observation of fluctuations, variations, and drift in the input signal. It displays these changes more accurately than would have been possible on the 1 KC range unexpanded. In the example above, suppose a ± 50 cps variation was to be observed. X10 expansion could have been used to present an even greater pointer excursion per cycle of variation than that for X3. In the X10 case, the segment would contain only 100 cps (0- 10 scale), and the meter pointer (700 cps) would be placed at “5” to allow the variation to be observed. The amount of variation anticipated on the input signal governs the amount of expansion chosen. Paragraph 2B-6 discusses instrument accuracy for each measurement condition.2B-5 ADDITIONAL SCALE CALIBRATION METHODS
In the example of paragraph 2B-4 the expanded scale was calibrated with the input frequency for differential measurement. The accuracy of such a calibration is limited by the basic accuracy of the unexpanded scale used for the initial measurement, i.e. ±2 percent full scale, but the measurement accuracy of change in frequency is improved (see paragraph 2B-6). Another method of calibration, useful in random counting, for example (paragraph 2B-7), consists of placing both OFFSET controls fully clockwise. This action calibrates the expanded scale “0” as zero cycles, and calibrates full scale to the magnitude of the segment. For example, the 10 KC range expanded X10 with the OFFSET controls fully clockwise would calibrate the 0 to 10 meter scale from 0 to 1 KC. Calibration of expanded scale with a known frequency, such as a standard or calibrated oscillator,  can also be accomplished to improve the accuracy of expanded scale calibration. In this method an accurate frequency, close to the unknown in magnitude, would drive the instrument to establish a convenient calibration on the expanded scale. This signal would be removed and the unknown signal would be measured on
the instrument without changing the OFFSET control.
2B-6 ACCURACY OF MEASUREMENTS
The basic accuracy of measurement on an unexpanded range of the Model 500B is better than ±2% of full scale value for any range in use. In this discussion the term full-scale, whether or not the scale is expanded, always relates to the frequency value shown under the arrow marker on the RANGE switch dial skirt. This accuracy applies only to single frequency measurement. When differential measurements are made two readings are implicit in the process, and the double liability of error doubles the possible error. As shown in Table 2B-1, the unexpanded scale accuracy is ±2% full scale for single frequency measurement and is 13.5% full scale for differentia
l measurement. In examining the various sources for error in the first two columns of the table, it is seen that all errors double in differential measurement, except the circuit calibration error which is linear, always in the same direction, and constant for single or differential frequency measurement. Moving to the third column, X3, it is seen that the sources for differentia1 error are divided by three-except  the phantastron timing error which remains constant. This error is not reduced upon expanding  because it arises in the phantastron circuit with line variation. The timing error varies the length of the constant current pulses to produce an erroneous meter indication which is expanded along with the scale expansion so that it remains constant percentage when related to the full-scale range value. All other errors are related to “pin to pin” meter behavior and remain constant in percentage when related to the number of scale divisions on the meter. The effect is to reduce the percentage full-scale  error when the scale divisions are related back to the unexpanded full-scale value. For example, consider meter tracking error on the 100 KC range as ±1%. This is ±1/2 scale division or ±100 cps. Expanding the 100 KC range to X10, ±1% then becomes ±1/2 scale division or ±100 cps. Relating this 100 cp back to  full-scale value, 100 KC, meter tracking error becomes ±0.1%: doubled for differential error it becomes ±0.2%. Thus, expanded scale error is determined in all cases, except phantastron timing, by dividing the basic range error by the factor of expansion, and then doubling this quantity to obtain total differential error. The last three columns of Table 2B-1 show maximum possible errors when differential measurements are made with constant line voltage. In these cases the errors arising from line voltage variation become zero. It should be noted that the line variation (assuming a 115 V line) described for the first four columns of the table constitutes a 30-volt fluctuation from 130 volts to 100 volts or from 100 volts to 130 volts, between readings. Most measurement conditions will be better than this with a substantial improvement in the accuracy of the Model 500B.2B-7 RANDOM COUNTING, GENERAL
During random counting operation several instrument considerations should be kept in mind by the operator: (1) the time constant of the meter, (2) the basic full-scale accuracy of the meter, and (3) a predictable error arising from the nature of the internal pulse forming circuit. These considerations will be discussed in the following paragraphs.
2B-7A METER TIME CONSTANT
Since the random count is averaged over the time constant of the meter, in some applications of measurement the meter pointer may exhibit a tendency to vibrate or oscillate about the average reading. In so
me cases this vibration may become severe enough to inhibit readings. If this situation occurs it is recommended that a capacitor be placed in the meter circuit to increase its time constant. The capacitor should be placed from the plus (+) side of the meter to ground. The capacitance used will depend upon the particular application,  but 500 μf has been found sufficient to damp the vibration in most cases. If desired, the Hewlett-Packard Accessory Meter (described in Specifications) could be modified by placing 500 μf directly across its terminals and used for random counting operation.
2B-7B BASIC ACCURACY
The basic accuracy of the Model 500B/C is 12% full-scale division. The effect of this error is minimized for the frequency of interest as the pointer approaches a full-scale indication. In measurement operation it is desirable to maintain the pointer as close to a full-scale indication as practicable.
2B-7C PREDICTABLE ERROR
In random counting the possibility of missing an input pulse while the circuit is developing a current pulse from the previous signal constitutes a predictable error. Since the constant current pulse, developed internally, occupies approximately 60 percent of the period time for any given basic RANGE position, unexpanded, a correction factor can be formulated to correct readings.
If F = random average frequency,
and fi = indicated frequency,
and  fs = frequency represented by full scale in use,
and d = width of current pulse × number pulses,
then d = .60/fs(fi).
The time available for counting an input pulse is given by the expression:
Time avail. ≅ 1-d or 1 – .60 fi / fs
The random average frequency with no expansion is:

 F ≅  fi /[1- (.6 fi/fs)].  (1)    

With X10 expansion:  

F  ≅  fi / [1- (.06 fi/fs)]   (2). 

With X3 expansion:

F ≅ fi / [1- (.2 fi/fs)]   (3).  ».
§§§
Il testo prosegue nella seconda parte; per consultarla scrivere “500B” su Cerca.
Foto di Claudio Profumieri, elaborazioni e ricerche di Fabio Panfili.
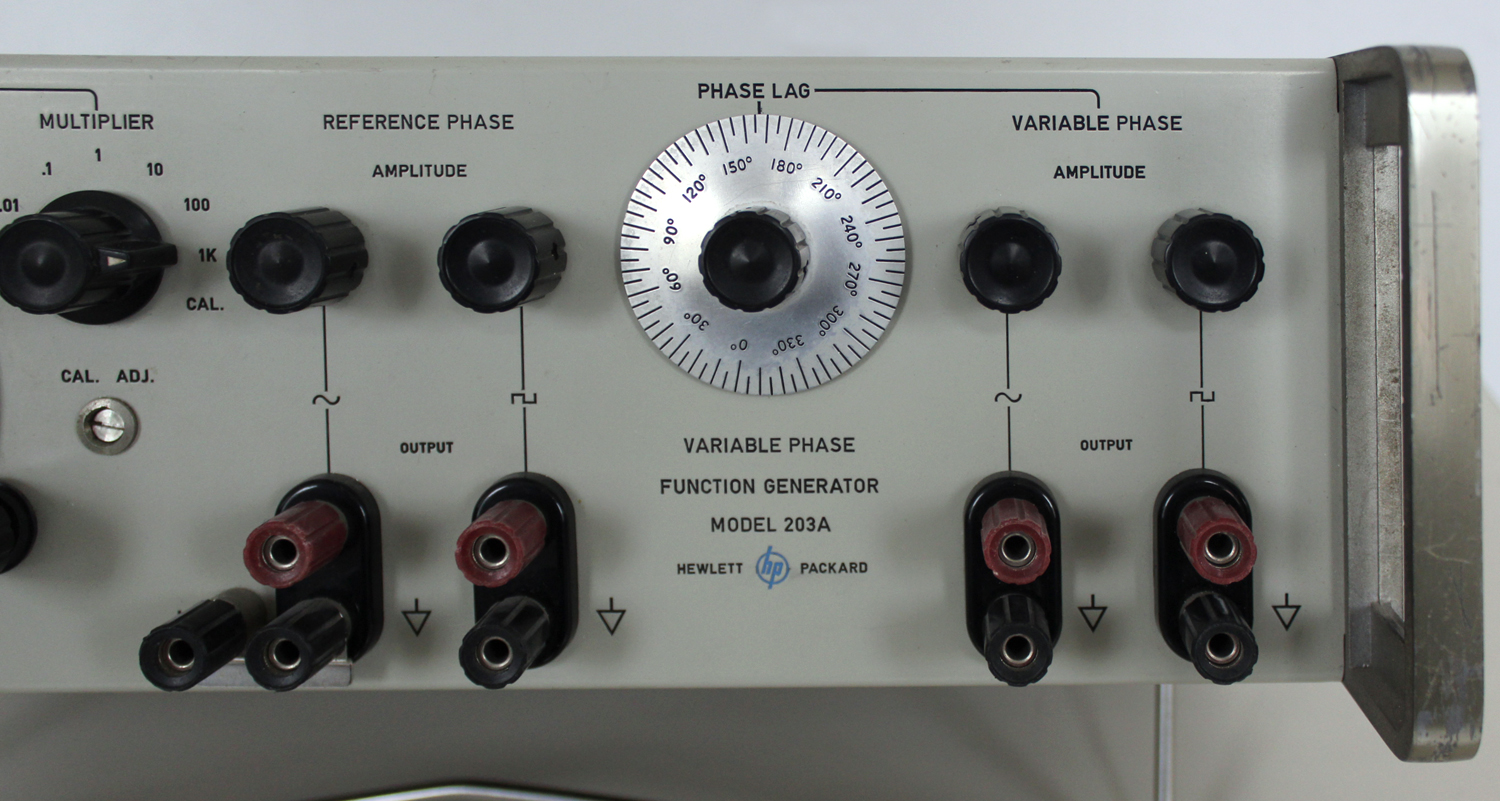
Per ingrandire le immagini cliccare su di esse col tasto destro del mouse e scegliere tra le opzioni.